Smart Freeway - Safe-D UTC
←
→
Page content transcription
If your browser does not render page correctly, please read the page content below
ti o n  o  f  a
                    c t  Ev  a lu a
   e ty  I m   p  a                    m   a t e d
Saf                       ow    A u to
                 Na   r r                    i b l e
                               e R  e ve r s
               - E xc  lu s i v                    g
 V  eh i c l e                     n  E x i st i n
                      n  e o  n  a
                  La                     r e  e w  a y
                            Smart F

                                                              P   R
                                                                  R e#p!or t
                                                            P
                                                         FPin a l
                                      r u a r y 2021
                                  Feb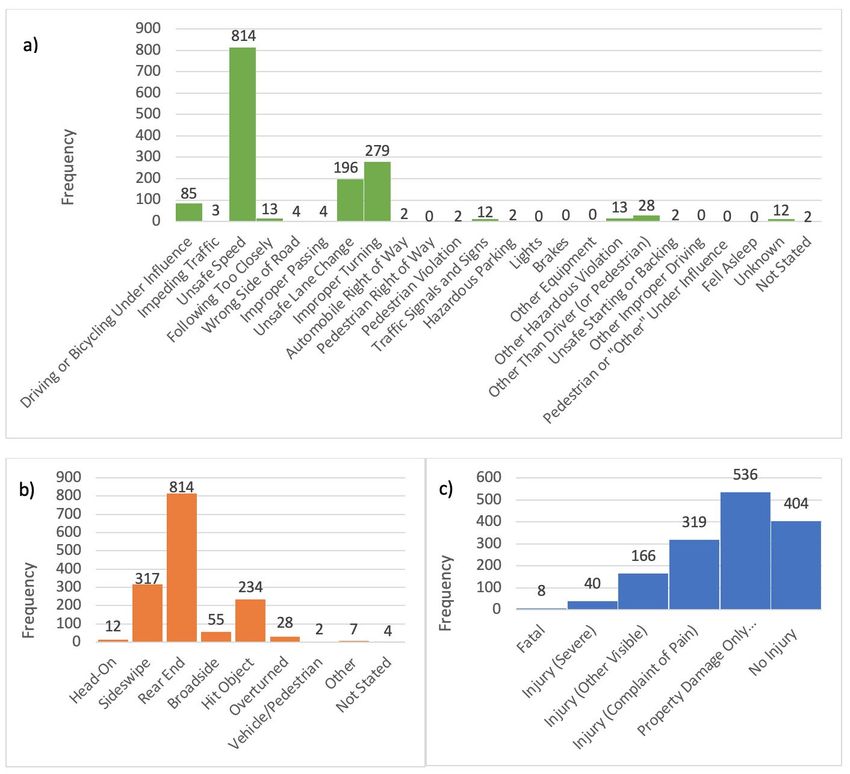
Disclaimer
The contents of this report reflect the views of the authors, who are responsible for the
facts and the accuracy of the information presented herein. This document is
disseminated in the interest of information exchange. The report is funded, partially or
entirely, by a grant from the U.S. Department of Transportation’s University
Transportation Centers Program. However, the U.S. Government assumes no liability for
the contents or use thereof.
TECHNICAL REPORT DOCUMENTATION PAGE

1. Report No. 04-101            2. Government Accession No.        3. Recipient’s Catalog No.

4. Title and Subtitle                                              5. Report Date
Safety Impact Evaluation of a Narrow-Automated Vehicle-            Feburary 2021
Exclusive Reversible Lane on an Existing Smart Freeway             6. Performing Organization Code:

7. Author(s)                                                       8. Performing Organization Report No.
[insert authors as: First M. Last including links to ORCIDs,       Safe-D Project 04-101
such as:
Sahar Ghanipoor Machiani
Arash Jahangiri
Benjamin Melendez
Anagha Katthe
Mahdie Hasani
Alidad Ahmadi
Walter B. Musial

9. Performing Organization Name and Address:                       10. Work Unit No.
Safe-D National UTC                                                11. Contract or Grant No.
San Diego State University                                         69A3551747115/[insert project number, e.g.
5500 Campanile Dr, San Diego, CA 92182                             Project 01-001]

12. Sponsoring Agency Name and Address                             13. Type of Report and Period
Office of the Secretary of Transportation (OST)                    Final Research Report
U.S. Department of Transportation (US DOT)                         14. Sponsoring Agency Code

15. Supplementary Notes
This project was funded by the Safety through Disruption (Safe-D) National University Transportation Center, a
grant from the U.S. Department of Transportation – Office of the Assistant Secretary for Research and Technology,
University Transportation Centers Program.
16. Abstract
This study fills the gap in the limited research on the effect of emerging Automated Vehicle (AV) technology on
infrastructure standards. The main objective of this research is to evaluate implications of an innovative
infrastructure solution, exclusive AV lanes, for safe and efficient integration of AVs into an existing transportation
system. Examining a real-world case study, this project investigates implications of adding a narrow reversible
AV exclusive lane to the existing configuration of the I-15 expressway in San Diego, resulting in a 9-foot AV
reversible lane, and in both directions of travel, two 12-feet lanes for HOV and HOT vehicles. Given the
difference between the operation of AVs and human-driven vehicles and reliance of AVs on sensors as opposed to
human capabilities, the question is whether we can provide exclusive and narrower roadways for AVs while
maintaining proper safety and mobility? To accomplish the project’s goal, the research team conducted a series of
research approaches including a literature review, an AV manufacturers product review, expert interviews, a
consumer questionnaire review, a crash data analysis, and a traffic simulation analysis. Recommendations and
guidelines from the results of the study may be used for practitioners and professional organizations involved or
interested in AV development.

17. Key Words                                           18. Distribution Statement
Publication, guidelines, report, brochure,              No restrictions. This document is available to the
communication, marketing                                public through the Safe-D National UTC website, as
                                                        well as the following repositories: VTechWorks, The
                                                        National Transportation Library, The Transportation
                                                        Library, Volpe National Transportation Systems
                                                        Center, Federal Highway Administration Research
Library, and the National Technical Reports Library.
 19. Security Classif. (of this report)   20. Security Classif. (of this         21. No. of Pages     22. Price
 Unclassified                             page) Unclassified                       [insert # pages]   $0
Form DOT F 1700.7 (8-72)                                                 Reproduction of completed page authorized

                                                        ii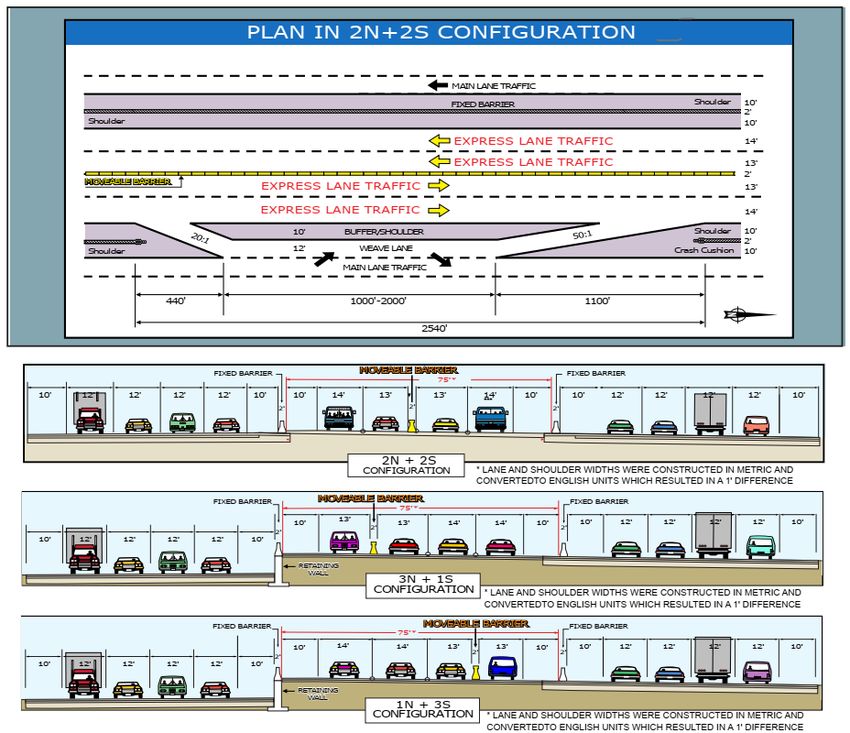
Abstract
This study fills the gap in the limited research on the effect of emerging Automated Vehicle
(AV) technology on infrastructure standards. The main objective of this research is to
evaluate implications of an innovative infrastructure solution, exclusive AV lanes, for safe
and efficient integration of AVs into an existing transportation system. Examining a real-
world case study, this project investigates implications of adding a narrow reversible AV
exclusive lane to the existing configuration of the I-15 expressway in San Diego, resulting
in a 9-foot AV reversible lane, and in both directions of travel, two 12-feet lanes for HOV
and HOT vehicles. Given the difference between the operation of AVs and human-driven
vehicles and reliance of AVs on sensors as opposed to human capabilities, the question
is whether we can provide exclusive and narrower roadways for AVs while maintaining
proper safety and mobility? To accomplish the project’s goal, the research team
conducted a series of research approaches including a literature review, an AV
manufacturers product review, expert interviews, a consumer questionnaire review, a
crash data analysis, and a traffic simulation analysis. Recommendations and guidelines
from the results of the study may be used for practitioners and professional organizations
involved or interested in AV development.

                             Acknowledgements
This project was funded by the Safety through Disruption (Safe-D) National University
Transportation Center, a grant from the U.S. Department of Transportation – Office of the
Assistant Secretary for Research and Technology, University Transportation Centers
Program.
Special thanks are extended to Mansoureh Jeihani who served as the Subject Matter
Expert and reviewed and provided suggestions for the successful completion of this
report.
The authors also recognize the generous contributions by Sam Amen, Lima Saft, and
Brian Hadley, project champions from CALTRANS, who provided invaluable feedback
throughout the project.

                                            iii
Table of Contents
INTRODUCTION AND BACKGROUND ............................................................................. 1

LITERATURE REVIEW ......................................................................................................... 2
Existing Lateral Control Systems in AVs ..................................................................................................................2
Lane Width...................................................................................................................................................................3

EXPERTS’ OPINIONS ON AV-EXCLUSIVE LANES ............................................................ 4

CONSUMERS’ OPINIONS ON AVS’ LATERAL CONTROL SYSTEMS .............................. 7

INVESTIGATION OF I-15 EXPRESS LANES CRASH HISTORY....................................... 10
Primary Collision Factor, Type of Collision, and Collision Severity .................................................................... 10
   Interaction of Top Three Primary Collision Factors With Type of Collision and Collision Severity..................... 10

IMPACTS ANALYSIS USING MICROSIMULATION ........................................................ 14
Technical Approach .................................................................................................................................................. 14
  Corridor Network.................................................................................................................................................... 14
  Input Assumptions .................................................................................................................................................. 14
  Baseline Volumes ................................................................................................................................................... 15
Calibration ................................................................................................................................................................. 15
Results ......................................................................................................................................................................... 16
  Traffic Flow ............................................................................................................................................................ 16
  Average Density ..................................................................................................................................................... 16
  Average Speed ........................................................................................................................................................ 16
  Speed Differential ................................................................................................................................................... 17
Key Microsimulation Findings ................................................................................................................................. 18

CONCLUSIONS AND RECOMMENDATIONS ................................................................. 18
General Recommendations ....................................................................................................................................... 18
Specific to I-15............................................................................................................................................................ 20

ADDITIONAL PRODUCTS ................................................................................................ 20
Education and Workforce Development Products ................................................................................................. 20
Technology Transfer Products ................................................................................................................................. 20
Data Products............................................................................................................................................................. 21

REFERENCES ..................................................................................................................... 22

                                                                                        iv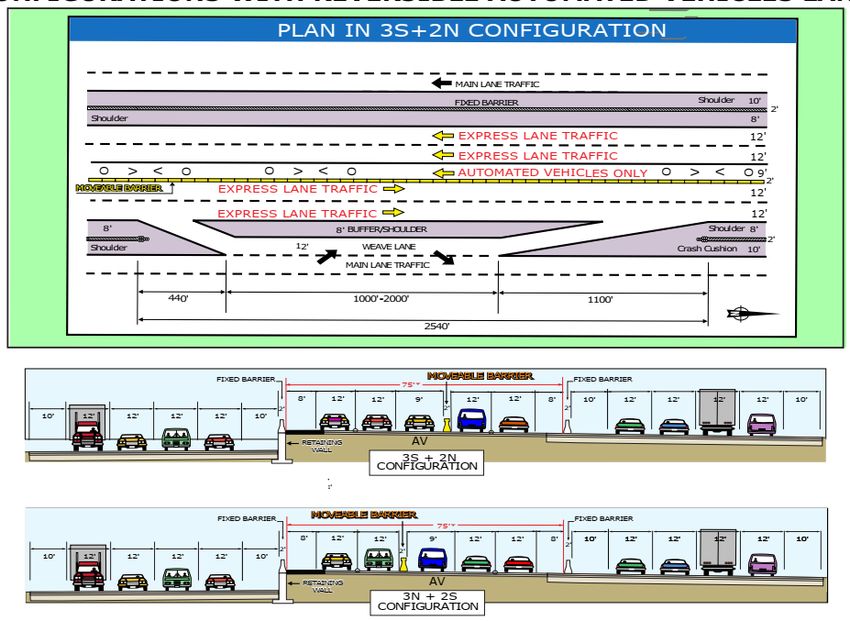
APPENDIX A: I-15 EXPRESS LANES CONFIGURATION ................................................ 27

APPENDIX B: LITERATURE REVIEW ............................................................................... 28
Lane Departure Warning Systems ........................................................................................................................... 29
Lane Keeping Assist .................................................................................................................................................. 30
Lane Centering .......................................................................................................................................................... 30
AV Considerations and Initiatives ........................................................................................................................... 32

APPENDIX C: REVIEW OF AV LATERAL CONTROL SYSTEMS USING
MANUFACTURERS’ MANUALS AND WEBSITES ........................................................... 34
SAE Level 1-2 ............................................................................................................................................................. 34
SAE Level 3 ................................................................................................................................................................ 35
SAE Level 4/5 ............................................................................................................................................................. 36
Summary Table of Reviewing AV Lateral Control Systems Using Manufacturers’ Manuals and Websites ... 37

APPENDIX D: EXPERT QUESTIONNAIRE ....................................................................... 44
(1) Academia and Transportation Officials............................................................................................................. 44
(2) Manufacturers/Technologists.............................................................................................................................. 45

APPENDIX E: CRASH ANALYSIS UNDER NON-IDEAL ENVIRONMENTAL
CONDITIONS .................................................................................................................... 47

APPENDIX F. SPEED DIFFERENTIAL GRAPHS ............................................................... 50

                                                                                      v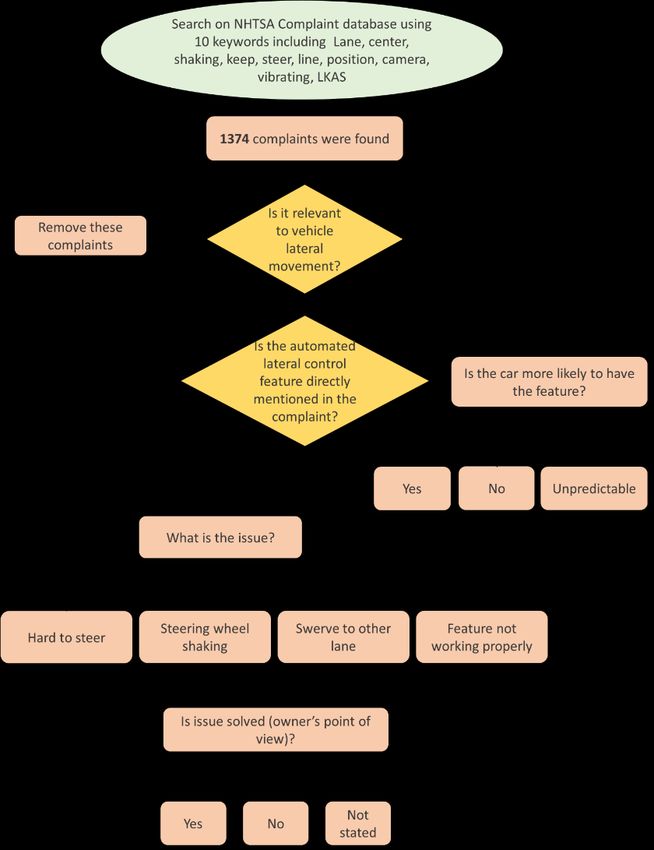
List of Figures
Figure 1. Flowchart of NHTSA Complaint Database analysis. ...................................................... 8
Figure 2. a) Frequency of keywords in complaints, b) complaint category. .................................. 9
Figure 3. a) Primary collision factor (PCF), b) collision type, c) collision severity..................... 12
Figure 4. Types of collisions for different collision severities attributed to three main PCFs. .... 13
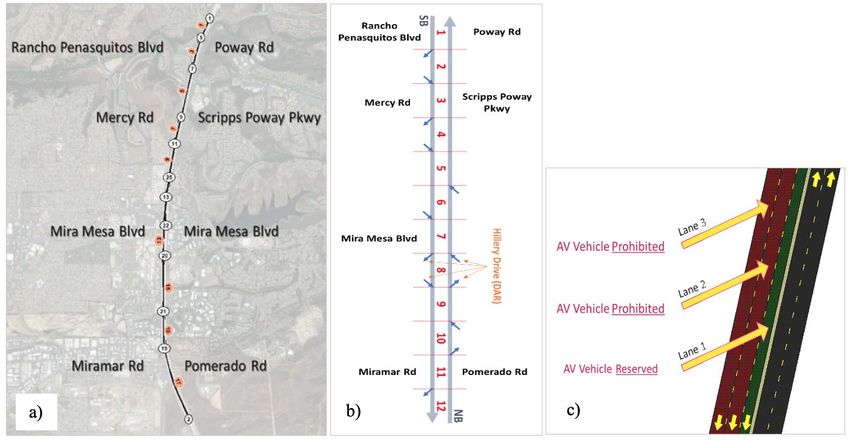
Figure 5. a) Network extents, b) network features, c) a sample of the road in scenario 3............ 15
Figure 6. Average density and average speeds. ............................................................................ 17
Figure 7. I-15 Express lanes existing 4-lane configurations [plans courtesy of Caltrans]. .......... 27
Figure 8. I-15 Express lanes configuration with reversible AV lane [plans courtesy of Caltrans].
....................................................................................................................................................... 28
Figure 9. Non-ideal environmental conditions for AV a) PCFs b) Type of collision c) Collision
severity .......................................................................................................................................... 49
List of Tables
Table 1. Simulation calibration ..................................................................................................... 16
Table 2. Speed Differential Range (mph) ..................................................................................... 17
Table 3. Traffic Flow Change from EX ........................................................................................ 50
vi
Introduction and Background
The purpose of this study is to expand the knowledge base in terms of safety and operational
impacts of exclusive freeway lanes for automated vehicles (AVs), and to investigate the
implications of including a narrow AV-exclusive reversible lane on I-15 in San Diego County,
California as a case study. The Interstate 15 (I-15) Express Lanes (EL) Corridor, between State
Route 163 (SR-163) and Via Rancho Parkway, currently provide 4 HOV and toll-paying FasTrak
lanes divided by a moveable barrier that allows reversible operation to accommodate peak hour
movements. The lane combinations that can be provided, depending on peak direction and position
of the moveable barrier that separates the northbound (NB) and southbound (SB) EL traffic, are 2
NB and 2 SB, or 1 NB and 3 SB, or 3 NB and 1 SB (see Figure 7 in Appendix A). Caltrans is
seeking efficient ways to handle more traffic in the ELs, especially during rush hours or during
major incidents when ELs are open to all traffic. In the available width between the fixed concrete
barriers that separate the EL facility from the regular lanes, it would be possible to add a narrow
reversible lane to be used only by AVs. This reversible AV lane for travel in the peak traffic
direction would be 9 feet wide and located next to the moveable barrier. In both the NB and SB
directions of the EL, there would be two 12-foot wide lanes for HOV and FasTrak vehicles and
the outside shoulder next to the fixed barrier would be 8 feet wide (see Figure 8 in Appendix A).
Considering this new configuration, we explore the traffic implications and considerations of AV
lanes and whether AVs could operate safely in a 9-foot lane.
AVs are dependent on several sensors to recognize the surrounding environment and navigate the
roadway. A road map is formed using the inputs from these various sensors, including ultrasonic,
radar, imaging, and LiDAR sensors, allowing the vehicle to stay in the lane and adjust the control
features for proper driving actions. Therefore, the operational features and logic of AVs are
different from human-driven vehicles where operational decisions are made based on driver
capabilities and behavioral characteristics. AVs’ lane-keeping capabilities could allow for
infrastructure standard adjustments, such as narrower lanes, fewer lanes, and smaller and less
signage, which could result in more efficient mobility.
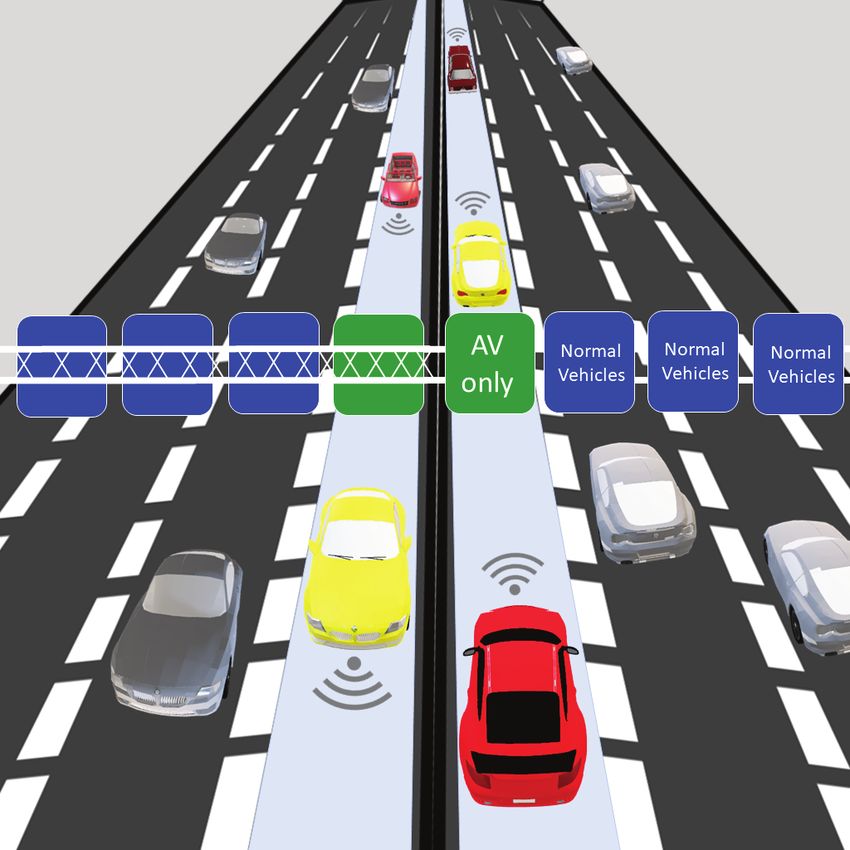
A full infrastructure adaptation will not take place quickly, especially given that the transportation
system will be serving both AVs and human-driven vehicles for quite some time. Therefore, a mix
of dedicated AV lanes and normal vehicle lanes seems to be a viable solution. Opportunities for
dedicated AV lanes within regular lanes should be sought wherever possible to make a smoother
transition to an AV-capable roadway system.
This research will shed light on the barriers AVs might face and benefits they could have on the
existing infrastructure as well as the safety implications of infrastructure adaptation to AV
technology. A series of tasks was completed, including a literature review, determining existing
lateral control systems in AVs, collecting experts’ and consumers’ opinions on the study subject,
and conducting crash data and traffic simulation analysis on I-15 ELs. The rest of this report details
1these tasks and provides recommendations and guidelines for narrow AV-exclusive lane development. Literature Review Existing Lateral Control Systems in AVs Lateral control is what keeps a vehicle in a lane. Lateral control technologies have developed progressively, evolving from lane departure warning systems to lateral assist systems to lane centering systems. A comprehensive literature review was prepared considering existing research in the development of AV environmental perception technologies as it relates to lateral control, and current literature examining recommendations of infrastructure improvements to support AVs (see Appendix B). Additionally, a review of 15 different vehicle manufacturers’ existing AV technologies related to lateral control systems is presented in Appendix C. The vast majority of the vehicles reviewed incorporated some form of AV technology that placed them in SAE International’s definition of AV levels 2–3 (1). A few manufacturers, such as WAYMO and Toyota, are developing level 4 and 5 vehicles. The review of vehicles is limited in scope to information available in the public domain (i.e., manufacturer websites, journal publications, and manuals). The review represents the major AV developers between the years 2014 to mid-2019. This review is intended to provide readers with an assessment of the general state of AV capabilities on the market at the time of this review’s writing (June 2019). AV capabilities will continue to develop and be refined for the foreseeable future. Concomitantly, AV safety and performance in real-world conditions needs to be continuously evaluated. The majority of corporate AV testing is on surface streets in urban areas. As most streets and freeways in the United States are designed to be 12 feet wide, AVs are trained and built for these conditions, and thus their performance in narrow lanes (
Lane Width
The research team also reviewed literature related to lane width. Almost all research on lane width
is in reference to conventional vehicles rather than AVs. Reduced width lanes have been previously
considered for their traffic calming effects or because of geographical restrictions or existing right
of way realities. It is important to consider research on reduced lane widths in order to understand
how it impacts road design in the present. Previous research in this area may additionally aide in
the identification of safety considerations should AVs be deployed on reduced width lanes.

A substantial amount of research regarding reduced lane widths pertains to safety considerations.
Sharma et al. (3) found that 10-foot lanes on higher speed (40–45 mph) roads had an ambiguous
impact on safety, observing improvements in safety at some locations and reductions at others.
Wider lanes tended to be safer at corner speed limit curves. Sharma et al. also posit that drivers
were more careful while driving in high speed locales with narrower lanes, but that narrower lanes
tended to be associated with a larger number of lane violations. Intersections with narrower lanes
for both the left turn and through lanes were safer than intersections with a narrower left turn lane
and regular through lane. With regard to accidents, Potts et al. (4) concluded that lanes narrower
than 12 feet did not consistently increase crash frequencies. Therefore, lane design policies should
remain flexible with regard to narrower lane widths. An examination of roads from Minnesota and
North Carolina showed no consistent and statistically significant relationship between lane width
and safety. Potts et al. still caution narrowing lanes to less than 12 feet.

Public agencies are very sensitive to the impact of roadway infrastructure modifications. These
impacts are quantified in accident/crash modification factors (5). Gross et al. (6) researched the
impact of shoulder/widths combinations on accident rates and developed corresponding crash
modification factors. The authors found that reallocating lane and shoulder widths given a fixed
total pavement width can be a cost-effective measure for reducing accidents on rural, two-lane
undivided highways. Gross et al. posit that for narrow widths, slight reductions in crashes can be
achieved by adding shoulder widths compared to lane widths, but only in low traffic scenarios.
Lee et al. (7) developed a comprehensive safety model with accident modification factors. The
authors found that, in general, shoulder widths have a more substantial impact on safety when the
lane width is narrow. The study also indicated that accident modification factors increase with
decreasing lane or shoulder width.

It is important to also consider the functional impacts of lane width reduction, especially in regards
to flow, speed, and level of service. A Federal Highway Administration research initiative (8)
noted that the 1985 Highway Capacity Manual found that a roadway with 9-foot lanes and no
shoulders could only support two-thirds of the capacity of a two-lane roadway with 12-foot lanes
and 6-foot shoulders. The report found no flow benefits in reducing lanes to 10 feet or 9 feet. Rosey
et al. (9) compared simulator derived data to a previous field study on the impact of lane width
reduction on speed. The researchers found that simulator results corroborated previous field study
findings on speeds, which indicated that speeds remained unaffected by lane narrowing, However,

                                                  3
drivers tended to move towards the centerline after narrowing occurred and moved to the right
(outside edge of lane) prior to meeting an oncoming vehicle. Dorothy and Thieken (10) explore
the relationship between a number of different highway design variables, such as speed, level of
service, physical characteristics of the design vehicle, and capabilities of the driver. In reference
to lane width, the authors consider the recommendations of the 2004 edition of the Greenbook
(11): “9-foot lanes are appropriate on low volume roads in rural and residential areas, or in urban
areas, inside lane to accommodate wider shared use outside lanes.” It is important to note that the
aforementioned considerations are all heavily linked to human factors, and may be null and void
in AV-exclusive lane scenarios.
It should also be noted that there is another challenge associated with introducing AV-exclusive
lanes, especially narrow ones. Because AVs are programmed to follow a set path with minimum
lateral wandering, they may have an unintended and unfavorable impact on pavement life and
roadway hydroplaning. This aspect has caught researchers’ attention recently, resulting in
solutions such as proposing an optimal AV lateral wandering pattern (12).
Experts’ Opinions on AV-Exclusive Lanes
A key task of the project was to survey and explore relevant academic researchers’, transportation
officials’, and industry leaders’ attitudes and opinions on the topic of AV-exclusive lanes. Given
the rapid advancement of AV technology and the challenges of integrating AVs into the existing
transportation network, these perspectives from experts are invaluable for decision makers to
consider. A comprehensive questionnaire was developed, with questions ranging from identifying
the value of the project as conceived and engineering and safety considerations of narrow lanes to
public perception and engagement strategies and considerations. The survey was sent out to several
experts; 17 responses were completed and sent back to the research team. The questionnaire was
designed for two groups of (1) academia and transportation officials and (2)
manufacturers/technologists. Out of 17 responses, 14 were provided by the first group and 3 by
the second. Some of the questions were the same for both groups. The questionnaires are provided
in Appendix D.
Several survey questions pertained to the feasibility and the value of the proposed configuration
of the 9-foot AV-exclusive lanes. In general, most respondents (≈ 70%) were positive about the
exclusive AV lane concept on the I-15 corridor, citing several advantages, including improving
lane capacity and throughput, reducing congestion, improving road safety, increasing efficiency,
helping demonstrate the viability of AV technology and therefore widening its public acceptance,
and environmental benefits due to reduced emissions and fuel economy. Many surveyed
recognized the technical and political challenges of integrating AVs into the existing transportation
network. Some respondents (≈ 30%) expressed major reservations with the concept because an
exclusive AV lane in the middle of I-15 could potentially lead to confusion among non-AV drivers
and create conflict points during an AV’s entry or exit. Many questioned the perceived advantages
4of an exclusive AV lane in low market penetration conditions, citing low capacity and efficiency,
high cost, and potential increase in congestion in non-AV lanes. Some respondents asserted that
exclusive AV lanes could create safety issues due to the inability of most AVs to take evasive
actions and due to the absence of a concrete barrier between AV and non-AV lanes. Some others
believed that exclusive AV lanes could create equity issues, especially in low market penetration
conditions because of the perceived favorable road access to wealthy people who could afford
AVs.
The next few questions placed a major emphasis on AV operation safety. Some of the safety issues
were related to the limitations and uncertainties associated with AV environmental sensor
technology. Many respondents expressed concern over the reliability, accuracy, and
communication latency of AV sensor operation and strongly expressed the need for clear markers
and signage for proper AV sensor operation at all times of the day and night. Some cited
uncertainties arising from the low margin of error on a 9-foot lane, while others cited compatibility
issues for sensors that were calibrated to operate on 12-foot lanes. Many experts also raised
concerns regarding adverse weather conditions as a major limitation that may hamper proper
sensor operation and thus may affect safety. Adverse weather conditions have the potential to
negatively impact key navigation systems, such as optical camera systems. In addition, poor
weather conditions can also affect the pavement marking retroreflectivity performance. Most of
the respondents showed similar or stronger concerns with respect to the impact of wind
gusts/snow/ice/fog on AVs’ lateral control function. Vehicles pushed away by heavy wind gusts,
pavement markings covered due to snow/ice, and decreased visibility due to fog are some of the
negative impacts of adverse weather condition concerns expressed by the experts. To mitigate
these issues, they suggested several solutions, including improved striping: 6-inch lines and dashed
striping through gore and ramp areas according to The National Committee on Uniform Traffic
Control Devices (NCUTCD), installing wet reflective markings that aid machine vision systems
to improve performance (especially during nighttime), and providing physical barriers on both
sides.
The survey then explored several questions related to AV lane infrastructure, as it plays an
important role in the success of the exclusive AV lane project. Respondents listed few limitations
associated with roadway geometry and provided insights on the solutions to those limitations.
Vehicle dynamics around curves on the narrow lane were one such limitation, as sensors can also
have line of sight issues around curves. This is particularly problematic if there is a queue of
vehicles on the other end of the curve, which might require the AV to brake suddenly. Respondents
suggested solutions like standardizing the geometries and speed limits, allowing only regular-
weight vehicles, and widening the lanes around curves. In addition, special restrictions for heavy
AVs on narrow lanes were also suggested by the experts due to issues related to the bulkiness of
heavy AVs, proximity to non-AVs, turning radius, and GPS accuracy. Some of the supporting
infrastructure that many respondents strongly agreed on incorporating were highly reflective,
clearly visible and distinct lane markings, concrete barrier sensors, and the inclusion of roadside
5units that update restrictions in real-time. However, most respondents were of the opinion that the
exclusive AV lane would still be impacted by infrastructure non-idealities like potholes and non-
uniform lane markings.
The next few questions explored the regulatory efforts related to AV autonomy and market
penetration. When asked about what minimum level of autonomy would be sufficient for AVs to
be safely allowed in the exclusive lane, there was no clear consensus among the respondents;
however, the responses leaned toward the notion that the higher the level of autonomy (level 3 and
up), the better. Most respondents were not aware of any ongoing regulatory efforts to existing
vehicle standards or transportation design manuals but some of them suggested the need for
credible bodies like the National Highway Traffic Safety and Administration (NHTSA) and
NCUTCD to approve AV safety, provide guidelines about AV lane infrastructure, and provide
code to prevent non-AVs from entering the AV lane. Most respondents believed a 10% to 30%
market penetration rate (MPR) would be sufficient to make an AV lane viable, and that an MPR
over 50% could warrant decommissioning of AV lanes.
A few specific questions were targeted at academic and transportation officials pertaining to safety
concerns associated with implementing narrow 9-foot lanes, the effect of an AV exclusive lane on
the efficiency of traffic flow characteristics and capacity of existing general purpose lanes (GPLs),
and, finally, efforts to spread awareness.
Addressing the question related to safety concerns associated with implementing narrow 9-foot
lanes, several respondents cited concerns about how and when AVs would enter and exit the AV
exclusive lanes. Some thought AVs exiting the exclusive lanes at high speeds and entering into
GPLs may pose safety concerns. In addition, a major concern expressed by the respondents was
that high-speed AVs next to potentially slow conventional vehicles could encourage those vehicles
to violate rules and enter AV exclusive lane, especially in congested GPLs conditions. Another
key safety concern identified by several experts was the nature of the narrow lanes; 9-foot lanes
compared to the traditional 12-foot lanes will have diminished maneuver space in the event of
unforeseen obstacles or unsafe maneuvers by other drivers.
Addressing the questions related to the effects of the narrow 9-foot AV lane on the efficiency of
traffic flow characteristics and capacity of existing GPLs, most respondents asserted that there
would be an improvement in overall traffic flow with AVs in their own lanes with tighter
headways, but there would be disruptions in the traffic flow due to AVs merging in and out of the
9-foot lane. While some believed that 9-foot AV lanes with connected and automated vehicles
could greatly improve efficiency, others believed that such an arrangement could create
uncertainty among human drivers adjacent to AV lanes.
For the effect of an AV lane on the capacity of existing GPLs, while many respondents thought
that capacity might improve due to platooning, some again pointed out the disruptions that could
be created due to merging and weaving may cause a negative impact on the GPL capacity. While
6some experts expressed concerns about reduced lane capacity due to slow-down of conventional
vehicles as a result of their close proximity of AVs, others believed that capacity would remain
unchanged.
The survey also explored the education and training of new AV lane users. Many surveyed
emphasized the importance of early education and training at the driver’s license level. Most
believed that extensive public outreach via internet, social media, and other campaigns would also
be necessary to explain how the lanes should be used or not used by non-AV drivers.
The final set of questions, related to AV technology and its effectiveness, were targeted at
manufacturers/technologists and few key insights were gained. For safe travel of AVs during
nighttime, experts advised precaution with respect to wet pavement surface reflectivity and
expressed concerns about vision-based systems, which are vulnerable to low light conditions.
Regarding a speed limit for AVs, experts were of the opinion that no specific speed limit could be
set at present, as limits will depend on other factors, such as vehicle connectivity and weather
conditions. When questioned if modified white lane markings enhanced with black stripes could
aid AVs in lateral control function, there were no strong conclusions drawn, though concerns were
expressed about uniformity in striping and being region specific. As to the impact of environmental
stressors, such as lane splitting and aggressive human drivers, on an AV’s response, experts
assumed that under such situations AVs would not veer but would come to a stop as an immediate
response.
When asked about the need for remedial component redundancies to be available in AVs to prevent
catastrophic incidents due to failure in the lateral control-related AV system, experts answered that
most probably no remedial component redundancies are currently available. They also added that
though there are automotive safety integrity level requirements for AVs, currently there are no
requirements for redundant control systems. For questions regarding sensor thresholds for safe AV
operation, minimum AV lane width requirement, and codification and measurement of lane keep
system accuracy, no responses were received.
Overall, most of the respondents saw the merit of AV-exclusive lanes. Many voiced their concerns
about the safety aspects of the proposed configuration, and brought insight into some unforeseen
challenges of the concept.
Consumers’ Opinions on AVs’ Lateral Control
Systems
AV-exclusive lane design would greatly benefit from a firm understanding of the limitations of
current AV technology. Consumer complaint data could serve as a relatively reliable representative
of AV limitations, as complaints reflect real-world experiences with the technology. This study
utilized information from NHTSA’s Vehicle Owner Questionnaires database (13) to evaluate
7safety issues that consumers have encountered related to lateral vehicle control technology in AVs.
The complaints from the consumer database were extracted based on specific keywords as well as
the vehicle’s make, model, and year. The keywords used in the search were lane, center, centering,
keep, keeping, ping pong, position, positioning, ALC (automated lane centering), LKAS (lane
keep assist systems), width, marking, steer, line, shaking, camera, vibrating, and assist. Out of
these initial keywords, 10 were selected as the final set of keywords: lane, keep, steer, position,
center, line, shaking, camera, vibrating, and LKAs. The remaining terms did not return any results.
The data were considered for all AVs manufactured between 2014 to 2019, as these vehicles were
potentially equipped with the automated lateral vehicle control technology. The extracted data
were then repurposed in Excel spreadsheets for detailed analysis.
Figure 1. Flowchart of NHTSA Complaint Database analysis.
Figure 1 shows the flowchart for the complaint analysis process. A total of 1,374 complaints were
found. These were then filtered into relevant—associated with the AV lateral movement—(count:
186) and irrelevant (count: 1188) complaints. The irrelevant complaints were discarded from
further analysis. Of all complaints, 31% stated that the AV related issues occurred when the car
was on a highway, 10% of the complaints stated they occurred on a road type other than the
highway, and the remaining 59% did not state the road type. In Figure 2a, the number of times
8each keyword was associated with the complaints is illustrated in percentage. In some cases, more
than one keyword was associated with a relevant complaint. The keywords “lane” and “steer”
constituted the majority of the keywords, appearing 124 times (33%) and 111 times (30%),
respectively.
Of all the complaints, 43% (count: 80) directly mentioned the AV feature, while 57% (count: 106)
did not. In the latter group of complaints, 24.5% (count: 26) were more likely to have the AV
feature (based on the vehicle make, model, and year).
The complaints were read thoroughly and further categorized into four different lateral movement
related issues: “hard to steer,” “steering wheel shaking,” “swerve to other lane,” and “feature not
working properly.” It was also found that more than half (57%) of the complaints were recurring
while 35% of the complaints occurred only once. Finally, four categorized lateral movement
related issues were scrutinized to find out if the issues were resolved from the owner’s point of
view, and it was found that 1% of the complaints were resolved, 24% of the complaints remained
unresolved, and the remaining complaints (75%) did not state whether the issue was resolved or
not.
Figure 2. a) Frequency of keywords in complaints, b) complaint category.
Figure 2b is a pie chart of complaint category (type of lateral movement issue), which shows that
the majority of the complaints indicated “swerve to other lane” (37%) as the issue. Swerving can
lead to severe crashes with vehicles in adjacent lanes. Exclusive AV lanes with physical barriers
on both sides could prevent crashes with vehicles in adjacent lanes. However, a collision with the
barrier itself might occur, resulting in interruption of AV-exclusive lane traffic flow, especially if
only one AV lane exists with physical barriers on both sides. “Feature not working properly” (33%)
was the second major issue reported by the consumers, which could result in flow interruption and
even crashes in the AV-exclusive lane. High reflective, clearly visible, and distinct markings and
signage could support proper AV sensors and features operation. It is highly imperative to design
an AV system (including both vehicle and infrastructure) that is robust in all conditions to ensure
a high level of safety and mobility in the exclusive AV lane.
9Investigation of I-15 Express Lanes Crash History
Crash data provide important information, such as type, severity, and potential cause of crash, and
could illuminate potential shortcomings of operating AVs on the I-15. Historical crash data on the
I-15 ELs were examined. The primary source of data for conventional accident information was
the California Highway Patrol’s Statewide Integrated Traffic Records System database. Data were
selected based on location, jurisdiction, and year. Ten years (2009–2018) of data were collected
for the I-15 corridor, which included three CSV files: collision data, party data, and victim data.
The three files were combined based on the same incident number in each of these files. Each
incident number was sometimes observed to have multiple vehicles or injuries/fatalities associated
with it. In this study, all the vehicles involved in a particular incident were considered in the
analysis. Roadway shapefiles from Caltrans were used to filter only those data points (i.e., crash
locations) that were in the designated area of interest (I-15 ELs from SR 52 to SR 78). The filtered
data points with their associated attributes were exported and used for further analysis. A total of
717 incidents were observed from 2009–2018 at the study site. When considering all vehicles
involved in each incident, 1,473 crashes were analyzed. Some of the attributes considered in this
study include primary collision factor, type of collision, and collision severity.
Primary Collision Factor, Type of Collision, and Collision Severity
Primary collision factor (PCF) consists of a number of different violation categories that were
determined to be the main reason for a crash, as shown in Figure 3a for I-15 ELs crash data. To
further understand the specifics of a crash, type of collision and collision severity were analyzed
in conjunction with the PCF (Figure 3a, b, and c). In the PCF graph, more than half of all crashes
were due to unsafe speed (55%, count: 814 crashes), 19% (count: 279 crashes) were due to
improper turning and 13% (count: 196 crashes) were due to unsafe lane change. From the type of
collision graph, it was observed that rear-end collision dominated the list, accounting for 55% (814
crashes) of all crashes recorded, followed by side-swipe (22% each, 317 crashes) and hit-object
(16%, 234 crashes). In the collision severity graph, although there were very few cases of fatality
(0.5%, 8 fatalities), many human injuries were reported, ranging from complaint of pain to severe
injury (36%). Property damages accounted for 36% of the crash consequences and 27% were no
injury cases. It should be noted that in this study, every vehicle involved in the incident was
mapped to the highest degree of collision severity experienced by any of the passengers.
The research team also investigated the three crash attributes for non-ideal environmental
conditions, such as adverse weather conditions (see Appendix E). The results showed the same set
of PCFs, collision types, and severities were dominant in causing a majority of the crashes.
Interaction of Top Three Primary Collision Factors With Type of Collision and
Collision Severity
The three main PCFs were further analyzed in combination with Type of Collision and Collision
Severity to sketch the crash cause, effect, and consequence relationship (see Figure 4).
10Unsafe speed is the most important PCF, contributing to around 55% of the total crashes. As Figure
4 shows, most crashes involved rear end collisions and accounted for 87.1% of total unsafe speed
crashes (count: 709 crashes). Among these crashes, human injuries, ranging from complaint of
pain to severe injury, and property damage were estimated to be 33% and 34% respectively.
However, no fatalities were observed. The second and third highest categories were hit object
(6.1% of total unsafe speed crashes, count: 50 crashes) and sideswipe (4.2% of total unsafe speed
crashes, count: 34 crashes) collisions. Of the total three fatalities, hit object, broadside, and
sideswipe collisions accounted for one fatality each.
Crashes caused due to unsafe speed can potentially be reduced with the use of AVs. AVs follow
speed protocols with less variability and maintain close to accurate bumper to bumper spacing,
provided the performance of environmental sensors are accurate and reliable. Even if one or more
sensors fail, there should be sufficient redundancies in the system to mitigate performance
degradation significantly. Previous research has also shown the safety benefits of AVs in reducing
this type of collision. For example, Najm et al. (14) reported that automotive collision avoidance
systems (e.g., forward collision warning and adaptive cruise control) can potentially prevent 6–
15% of crashes.
11Figure 3. a) Primary collision factor (PCF), b) collision type, c) collision severity.
The next PCF analyzed was improper turning, which contributed to around 19% of total crashes
on I-15 ELs. Hit object collisions (41.9% of total improper turning crashes, count: 117 crashes) in
this category mostly resulted in property damage and human injuries ranging from complaint of
pain to severe injury. There was also one fatality in this category. The second highest collision
type was side-swipe (38.3% of total improper turning crashes, count: 107 crashes) with collision
severity ranging from complaint of pain to severe human injuries and property damage. Besides
hit-object and sideswipe, a small number of rear-end (8% of total improper turning crashes, count:
22 crashes), over-turned (4% of total improper turning crashes, count: 10 crashes), and broadside
collisions (6% of total improper turning crashes, count:16 crashes) were observed.
AV attributes such as LKA systems have the capability to prevent the vehicle from drifting from
its desired path, thus avoiding improper turning. Additionally, lane infrastructure needs to be
12designed carefully, such that the barrier/median is detected and interpreted by the AV sensors
correctly with little room for error. Well-designed and functioning environmental sensors,
signboards, and markings are required for safe travel of AVs in an AV-exclusive lane. However,
AVs are susceptible to turning errors when the weather conditions are adverse or if the appropriate
sensors fail, and caution should therefore be exercised when designing the AV and the AV-
exclusive lane to promote proper turning at all times.
The next important PCF observed on I-15 EL was unsafe lane changes, which accounted for 13%
of total crashes on I-15 ELs. Crashes due to unsafe lane changes resulted mainly in side swipe
collisions (72% of total unsafe lane change crashes, count: 142 crashes) causing property damage
and human injuries ranging from complaint of pain to visible injury. A few unsafe lane change
incidents resulted in rear-end and broadside collisions (10% and 5% of total unsafe lane change
crashes, count: 20 and 10 crashes, respectively), which caused property damage and human
injuries ranging from complaint of pain to visible injury. Hit object and overturned collisions
caused property damage and human injuries ranging from complaint of pain to severe injury. No
fatality incidents were observed during unsafe lane change incidents.
AV attributes such as lane departure warning systems (LDW), LKA systems and lane centering
can help to reduce unsafe lane departures, leading to safer travels on ELs. As mentioned, caution
should be exercised when designing AVs and AV-exclusive lane to avoid unsafe lane changes due
to adverse weather conditions and/or sensor failure. Restricted access to AV-exclusive lanes from
GPLs can also prevent unsafe lane changes. The points of access from/to the AV-exclusive lane
to/from a GPL need to be carefully designed and monitored. Considering proper infrastructure
design at these access points will prevent crashes due to unsafe lane departures as well as improper
turning.
Figure 4. Types of collisions for different collision severities attributed to three main PCFs.
13Impacts Analysis Using Microsimulation
Technical Approach
Microsimulation was used to evaluate the impact of implementing the proposed AV-exclusive lane
on the I-15 ELs. To best understand the project’s effect on transportation, a sensitivity analysis
was conducted for three scenarios as noted below. The microsimulation model was developed with
the Caliper TransModeler SE version 5.0 software package. The following sections will discuss in
more detail the microsimulation input assumptions and output metrics used for the evaluation.
Scenario 1 – EX: Baseline/calibration scenario with existing volumes/network
Scenario 2 – AV: Existing volumes/network with AV adoption
Scenario 3 – AVL: Existing volumes with proposed AV exclusive lane and adoption
Corridor Network
The microsimulation evaluated a section of the I-15 ELs corridor, approximately 7 miles in length,
between Ted Williams Freeway (State Route 56) to State Route 163. The ELs were modeled in
the simulation environment, including all physical features such as merging and diverging points,
acceleration/deceleration lanes, Direct Access Ramps, and lane/shoulder configurations and width.
Figure 5a and Figure 5b illustrate the extent and configuration of the network. The network was
divided into 12 segments as numbered on the figure. The microsimulation outputs were collected
in the middle of each segment on an individual lane basis.
Figure 5c illustrates the lane configuration under scenario 3 for the SB direction during the a.m.
peak hour. The morning peak hour scenario was selected since it is the most conservative period
given a more critical traffic condition occurs during the morning in comparison to the evening
peak hour.
Input Assumptions
In addition to physical features of the network, microsimulation parameters were modified to
reflect the field conditions. Heavy vehicles were not modeled, with the assumption that they are
not permitted on the ELs. Non-AVs were evaluated with the Modified General Motors Car-
Following Model which is the default setting of the software. Per the software developer’s
guidance, AVs were evaluated with the Constant Time Gap Car-Following Model.
Under scenarios 2 and 3, AVs were modeled with automation level 3 - conditional automation.
Levels 1 and 2 automation were not considered, given they represent driver support rather than
true vehicle automation. Under scenarios 1 and 2, AVs were assumed to have the same deviation
from the speed limit as non-AVs. This assumes approximately 30% of drivers were traveling
within the speed limit. Under scenario 3, level-3 AVs were not affected by non-AVs as they were
traveling in the AV-exclusive lane. Therefore, the AVs were assumed to travel at the speed limit.
14The AV MPR for the baseline scenario was assumed to be zero since level 3 AVs are not currently
available. Scenarios 2 and 3 assumed varying level 3 MPRs of 15%, 30%, and 45%. This approach
provided sensitivity to the analysis given that it is difficult to predict MPR with certainty.
Each microsimulation was run for 60 minutes using the peak hour volumes. A maximum warmup
period of 10 minutes was also assumed to preload the network.
Baseline Volumes
Baseline volumes and speeds were received from Caltrans. The extracted data represents morning
peak hour (7 a.m.–8 a.m.) volumes and speeds on HOV lanes from Tuesday October 15, 2019 to
Thursday October 17, 2019.
Figure 5. a) Network extents, b) network features, c) a sample of the road in scenario 3.
Calibration
Existing field volumes were inputted into the software to verify that the microsimulation accurately
represented field conditions. Volumes, in veh/hr, and speeds, in mph, yielded from the model were
then compared to available field data. In addition, the Geoffery E. Havers (GEH) value was used
for the calibration process and to assess how the microsimulation outputs matched the field
conditions. A Low GEH, under five, indicates a well calibrated model. An average GEH of 0.40
and 0.77 was achieved for the NB and SB directions, respectively (see Table 1).
a) b) c)
15Table 1. Simulation calibration
Field Simulation
Field Simulation Δ
Data: Output: Δ
# Location Dir Data: Output: Average GEH
Average Average Volume
Volume* Volume Speed
Speed Speed
Rancho NB 800 71.3 775 71.7 -3% 1% 0.89
1 Penasquitos Blvd
SB 3500 75.9 3499 72.5 0% -4% 0.02
/ Poway Rd
Mercy Rd/ NB 700 66.2 689 70.7 -2% 7% 0.41
2 Scripps Poway
SB 2500 75.5 2474 70.5 -1% -7% 0.52
Pkwy
NB 800 69.0 792 73.0 -1% 6% 0.29
3 Mira Mesa Blvd
SB 3400 71.9 3340 70.3 -2% -2% 1.04
Miramar Rd / NB 800 73.6 800 76.5 0% 4% 0.00
4
Pomerado Rd SB 3000 73.7 2917 70.2 -3% -5% 1.52
Average NB -1.4% 4.3%
Average SB -1.4% -4.6%
* Field volumes are rounded to nearest hundred
Results
The microsimulation results were reviewed under four selected metrics: traffic flow, average
density, average speed, and speed differential.
Traffic Flow
Traffic flow data, in veh/hr, for all lanes were collected on each segment of the network. Appendix
F shows, in more detail, the percent change in the flow of traffic on each segment compared to
scenario 1 (baseline scenario). Under scenario 2, the introduction of level 3 AVs into the existing
network did not show any measurable change in traffic flow. Under scenario 3, however, the
introduction of level 3 AVs on an AV-exclusive lane resulted in up to a 14% increase in traffic
flow depending on the corridor location and AV MPR.
Average Density
Average density was calculated for the length of the segment in vehicles per mile per lane. Figure
6 demonstrates average density along the corridor. Similar to traffic flow, changes in average
density were insignificant in scenario 2. The average density of most segments was found to
increase by up to 24% under scenario 3.
It should also be noted that in the 45% MPR scenario, a significant increase in density was
observed on segment 10. It is suspected that this is related to the compound effect of an existing
curve, high ramp volumes, and higher AV-exclusive lane saturation.
Average Speed
The average speed of each segment was also evaluated. Consistent with the traffic flow and
density, under scenario 2, no measurable difference was observed on average speeds. Under
16scenario 3, the average speed declined by 2–8 mph depending on the location and AV MPR. The
drop in speed was expected given the AVs were assumed to travel at the speed limit in the model.
As indicated in the “input assumptions” section, this compares to only 30% of non-AVs and the
AVs in scenario 2, which were assumed to travel at the speed limit.
Speed Differential
The speed differential between lanes 1 (adjacent to the left shoulder) and 2 were determined on
each segment. It is important to note that under Scenario 2, lanes 1 and 2 had similar characteristics
(i.e., ELs). Scenario 3 introduced a distinction between lane 1 (i.e., AV exclusive lane) and lane 2
(i.e., EL). Table 2 shows the speed differential range between the two scenarios. Appendix F
includes additional graphs to show the speed differential between all three lanes.
Under scenario 2, speeds varied by 0.2 to 2.2 mph (absolute values). Under scenario 3, speeds
varied by 1.9 to 14.3 mph (absolute values). A range of speed variations (e.g., 0.2 to 2.2 mph in
scenario 2) was due to the differences between segments and MPRs. Lowest speeds on dedicated
AV lanes were observed at segment 10, where the highest density, low traffic flow and low average
speeds were recorded as well.
Previous studies have suggested that a high speed differential, for example, between HOV lanes
and GPLs may warrant the installation of barriers between the two lanes (15) (16). The studies
suggest that non-AV drivers may feel more comfortable driving with a maximum speed differential
of no more than 15 mph between lanes. They also suggest that speed differentials between 10 to
15 mph, while not warranting physical separation, may benefit from a buffer, such as double line
markings, separating the lanes.
Figure 6. Average density and average speeds.
Table 2. Speed Differential Range (mph)
Scenario 1 Scenario 2 Scenario 2 Scenario 3 Scenario 3 Scenario 3
Range Scenario 2
EX AV 30% AV 45% AVL 15% AVL 30% AVL 45%
AV 15%
Lower range -0.7 -1.9 -2.2 -1.4 -6.0 -9.4 -14.3
Upper range 1.4 0.2 0.4 0.9 -1.9 -4.8 -6.6
17You can also read