Smart motorways stocktake - First year progress report 2021
←
→
Page content transcription
If your browser does not render page correctly, please read the page content below
Smart motorways stocktake
First year progress report 2021
First year progress report                                                  First year progress report

                             Contents
                             Foreword                                                             2

                             Executive summary                                                    4

                             Giving clarity to drivers                                          10

                             Finding a safe place to stop                                       15

                             Being safer in moving traffic                                      19

                             Updated safety evidence                                            27

                             Conclusion                                                         38

                             Annex A – Length and traffic data 2010-2019                        41

                             Annex B – Strategic road network casualty data 2015-2019           42

                             Annex C – Casualty statistics 2010-2019                            44

                             Annex D – Glossary of terms                                        50

                                                                                                         1
First year progress report First year progress report
Foreword We had already trialled radar technology to detect stationary vehicles on the M25.
Over the past 12 months we’ve introduced it on stretches of the M3 and M20 and are
now installing it on the M1. Going forward, we will ensure every new section of smart
Every road death is a tragedy, and we are determined motorway has this technology in place when it opens, and we will fit it across all existing
all lane running motorways too. We had already committed to ensuring the system was
to reduce the number of fatal incidents, and injuries, fitted on all lane running smart motorways by March 2023. Today we commit to complete
on our roads. That includes on smart motorways. that work six months early, by the end of September 2022.
All road journeys involve risk, but the chance of death on smart motorways is less than on The Transport Secretary has asked the Office of Rail and Road (ORR) to undertake an
any other major road. It is less than on conventional motorways, and it is far less than on independent review of the available safety evidence to ensure the conclusions are robust.
any strategic road network A-road. We welcome this and will support the ORR in their work.
But that does not mean that we do not need to do more. I believe that our actions are having an effect and will continue to make a positive
difference to people’s journeys. The risk of an accident on a motorway compared to
We accept drivers want to know more about what driving on motorways without a hard other roads remains low, but we want to make this figure as close to zero as possible.
shoulder means for their safety. They deserve to understand what we are doing to help Highways England will learn from and continue implementing the findings of the 2020
keep them safe and what new technologies can be deployed to assist if things go wrong. Stocktake, and work with drivers to make increasingly busy motorways safer for drivers
who use them.
I want the organisation I lead to continue to be one that listens, puts the needs of drivers
first and helps drivers feel safe and be safer.
Nick Harris
In March 2020, the Transport Secretary published a Smart motorway evidence stocktake Acting Chief Executive
and action plan which set out 18 steps to improve public confidence in smart motorways. March 2021
This report sets out what we have already done to deliver those promises, and our plans
to accelerate it. While we have made good progress, we cannot be complacent. So we
are going faster.
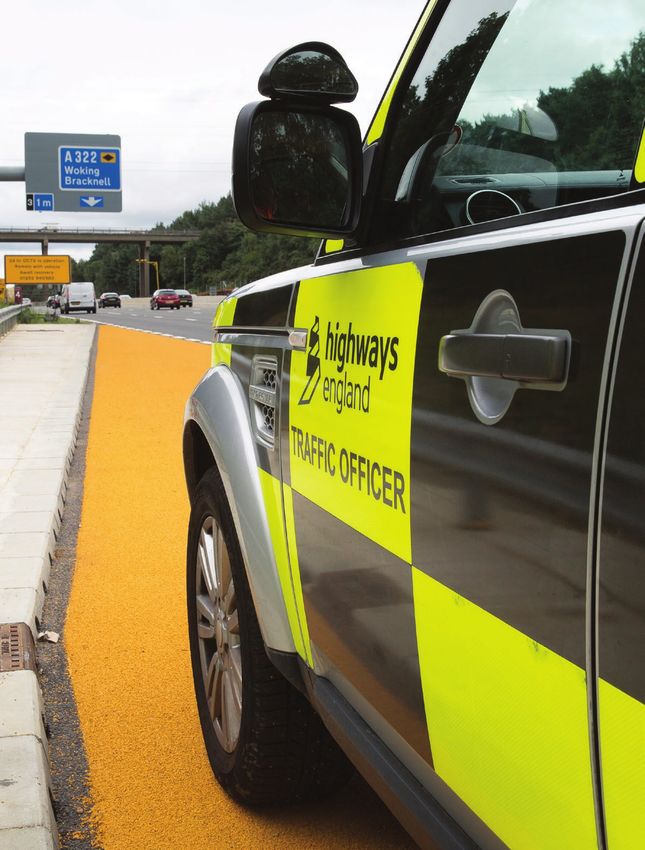
We recognise drivers value emergency areas. We have made them more visible to
drivers by turning them orange, so they can be seen more easily, and we’ve improved
the frequency of signage to them. We will accelerate our work to provide more signage
showing the distance to the next emergency area.
We have launched a national public information campaign about what to do in a
breakdown situation on a high-speed road and we’ve brought forward our work to
update The Highway Code. We’re now committing to complete that this year. And we
will continue to give drivers good, clear information, with campaigns and advice to help
their journeys.
2 3
First year progress report                                                                                                                                          First year progress report

      Executive summary                                                                           This Progress Report shows that in terms of fatality rates, smart motorways are the
                                                                                                  safest roads in the country. Per mile travelled, fatal casualty rates are a third higher on
                                                                                                  conventional motorways (0.16 per hundred million vehicle miles, hmvm) than on ALR
                                                                                                  motorways (0.12 per hmvm). Per mile travelled, fatal casualty rates on strategic road
      Last year’s Smart motorway evidence stocktake and                                           network A-roads (0.44 per hmvm) are more than three and a half times the rate on
      action plan1, the 2020 Stocktake and Action Plan,                                           ALR motorways.
      sought to gather the facts on smart motorway safety                                         This is in line with the findings of the 2020 Stocktake that “overall, what the evidence
                                                                                                  shows is that in most ways, smart motorways are as safe as, or safer than, the
      and set out an action plan to ensure smart motorways
                                                                                                  conventional ones. But not in every way”.
      are as safe as possible.
                                                                                                  These figures have been compiled on a five-year basis (2015-19 inclusive), because
                                                                                                  single-year figures are too low and variable to draw consistent conclusions from. For the
      One year on from the 2020 Action Plan, this Progress Report sets out our progress in
                                                                                                  year 2019, the total number of deaths on all motorways was 85, of which 15 were on ALR
      delivering the 2020 Action Plan, the latest evidence on the safety of smart motorways,
                                                                                                  and Dynamic Hard Shoulder Running (DHS) motorways. This was a rise of four since
      and commitments we are making to accelerate measures to further help drivers feel safe
                                                                                                  2018, reflecting in part the increase in traffic on the motorway network generally and on
      and be safer on smart motorways.
                                                                                                  these roads in particular. We will continue to monitor and evaluate safety on our network.
      All road journeys involve risk and the UK has some of the safest roads in the world.        The 2020 Stocktake found collisions between a moving vehicle and a stopped vehicle
      Across Europe, only Sweden, Norway and Switzerland have lower road fatality rates than      are more likely on ALR and DHS motorways. But collisions between two or more moving
      the UK. Our motorways are the safest type of road in the country - of the 7,515 deaths      vehicles – which is how more people die – are less likely. Technology introduced on smart
      on England’s roads between 2015-2019, 431 were on motorways, and of those 24 on All         motorways regulates speeds more safely.
      Lane Running (ALR) motorways (that is, smart motorways without a hard shoulder).
                                                                                                  Technology, in the form of stopped vehicle detection, can also reduce the risk of collision
                                                                                                  between a moving vehicle and a stopped vehicle. So we are continuing to roll out this
      But we recognise that concerns have continued to be raised about smart motorways
                                                                                                  technology, too – and faster than we previously planned.
      and, in particular, the impact that removing the hard shoulder has on driver safety.
                                                                                                  We are determined to do all we can to help drivers feel safer and be safer on our roads
      When a motorway is converted to smart motorway, the hard shoulder is removed.               – all our roads. While some have suggested changes, for example converting a smart
      The hard shoulder is not an entirely safe place; one in 12 motorway fatalities occur on a   motorway live traffic lane back to a hard shoulder, this would reduce their capacity by
      hard shoulder. On smart motorways a system of safety measures is introduced instead.        a quarter. The resulting congestion on the motorways would cause significant numbers
      These include technology, signs and signals which close lanes to other traffic when         of drivers to divert to far less safe roads, increasing the numbers of people killed and
      a stopped vehicle is identified, emergency areas that are set back from the road for        seriously injured on our nation’s roads overall. It would almost certainly increase overall
      drivers to pull into, and signs and signals which can alert drivers to hazards and change   danger, not reduce it.
      the speed limit if necessary. And to further enhance safety we are continuing to roll out
      stopped vehicle detection.                                                                  However, we will accelerate our efforts to enhance the current position. As part of this
                                                                                                  Progress Report we are, therefore, committing to further raise the bar on safety, to
      The 2020 Stocktake found that for the first nine ALR schemes, the overall casualty rate     address public concern around and improve public confidence in smart motorways.
      improved significantly, following the conversion to ALR, by 18% compared to what might      This builds on the £500m the Transport Secretary has already committed to smart
      have been expected without the conversion.                                                  motorway safety improvements.

      1   https://www.gov.uk/government/publications/smart-motorway-evidence-stocktake-and
4         action-plan                                                                                                                                                                                5
First year progress report First year progress report
On existing smart motorways:
By the end of September 2022, six months earlier than previously committed:
On existing ALR motorways we will have completed the installation of radar
technology which detects stopped vehicles (radar SVD technology)
We will have installed around 1,000 additional signs to better inform drivers of the
distance to the next place to stop in an emergency
By the end of September 2022, 10 months earlier than previously committed:
We will have upgraded cameras that automatically detect vehicles passing
illegally under a Red X or entering the lane beyond a Red X, so the police can
take enforcement action. We are doing this for the safety of those in the closed
lanes and because it’s illegal to enter the lane beyond a Red X, until such time
that you pass a sign and signal cancelling the restriction
We will continue to consider a national programme of retrofitting additional
emergency areas on existing smart motorways where places to stop in an
emergency are more than one mile apart. This review will be complete by
April 2022.
On smart motorways under construction:
We will ensure that every new smart motorway will have radar SVD technology in
place when it opens.
For smart motorways in the design phase:
SVD technology will be in place before any scheme opens
Going forward, and as previously announced, drivers will reach places to stop in an
emergency2 every three-quarters of a mile where feasible, with a maximum spacing
of one mile3.
In addition, we will also work collaboratively with the Office of Rail and Road (ORR) as
they progress the Transport Secretary’s requirement for them to independently review the
latest safety data to provide further analytical assurance and ensure that the conclusions
arrived at are robust.
2 places to stop in an emergency include motorway services, emergency areas and
remaining sections of hard shoulder, such as on slip roads
3 with some exceptions where not feasible to construct additional emergency areas,
such as where junctions intersect or on bridges
6 7
First year progress report First year progress report
These measures build on the 2020 Action Plan, which we have made significant progress Smart motorways have greatly increased the capacity of the country’s most important
in delivering over the past year: roads, and therefore provide more space for drivers who would otherwise be on roads
which are less safe. They reduce congestion, make journeys smoother and support the
We have launched our biggest ever road safety campaign to give drivers economy; doing so in a way that has a reduced impact on the environment. But we want
clear advice about what to do in the event of breaking down on any kind all drivers to both be safe and feel safe when driving on them. Through the commitments
of high-speed road. The ‘Go left’ campaign appears on television, radio, we are making to accelerate measures we are determined to further reduce the number
in print and digital advertising of casualties on our high-speed road network, improve public confidence in our smart
motorways, and to continue to build and operate one of the safest and best performing
We have completed work to turn emergency areas orange so they are more visible
road networks in the world.
to drivers and we’ve improved the signage letting drivers know how far they are
from the next place to stop in an emergency. We have also installed 10 more
emergency areas on the M25
We have held a public consultation on proposed changes to The Highway Code
that will provide more information about motorway driving
We have worked with the Home Office to improve compliance of Red X signs by
upgrading our cameras so they can automatically detect Red X offences
We have introduced radar SVD technology on stretches of the M3 between London
and Farnborough and the M20 in Kent, with work under way on the M1 in Yorkshire.
We had already trialled the technology on the M25 around London
We have signed an agreement with the vehicle recovery industry on a set of safe
operating procedures for providing roadside assistance
On the M6 (Bromford) and sections of the M1, where there have been clusters of
road incidents we have completed feasibility work and are developing a programme
of extra measures
We have completed a large-scale trial on the M4 junctions 19-20 of new technology
that analyses CCTV images to identify stopped vehicles, enabling us to respond
quicker. Trial results were positive, and we will now investigate further whether the
system would be suitable for future use on the network.
8 9
First year progress report First year progress report
Giving clarity to drivers These commitments will help drivers know what a smart motorway is and what to do if
they need to seek refuge and get help on their journey. By providing better information
to drivers, we will reduce confusion, increase driver confidence and make everyone’s
We know from feedback that many drivers do not know journey safer.
exactly what a smart motorway is and are not aware of Action What we have delivered since What will happen next
whether they are on one or not. We also know drivers March 2020
Communicating Having worked closely with drivers We will listen to public
are not always clear what to do if they need to seek with drivers: and motoring organisations, in March concerns and tailor
refuge and get help. And we know from feedback that additional £5 2021 we launched our latest national our public information
million for national public information campaign, campaigns to focus
Dynamic Hard Shoulder Running motorways have and targeted ‘Go left’, to give drivers clear on specific elements
the potential to cause confusion for drivers because communications information about what to do in of motorway driving,
campaigns a breakdown. We worked with to continue to raise
the hard shoulder is sometimes in use for traffic, and campaigners, recovery operators, awareness and provide
sometimes not. the freight industry and others to clarity to drivers.
ensure the messages address their
A number of commitments were made in the 2020 Action Plan to give clarity to drivers. concerns. The campaign includes
high profile television, radio, print
These were: and digital advertising.
Communicating with drivers: an additional £5 million for national and targeted
Ahead of this campaign we ran public
communications campaigns to further increase awareness and understanding of
information campaigns focusing on
smart motorways, how they work and how to use them confidently
specific elements of motorway driving.
Reducing confusion: ending the use of DHS as they have potential to cause In 2020 these included activity urging
confusion for drivers because the hard shoulder is sometimes in use for traffic and drivers not to drive in lanes closed by
sometimes not. The 2020 Action Plan committed to end the use of DHS and to Red X signs and to adhere to variable
convert all existing DHS smart motorways into ALR by the end of March 2025 so speed limits (February/March). We
there is only one type without a permanent hard shoulder. This will provide a more are planning a summer campaign
consistent experience for drivers encouraging drivers going on holiday
or day trips to check their vehicles
Improving guidance: improving The Highway Code so drivers can more easily
before setting out, to reduce the risk
find information on how to drive on high-speed roads, including smart motorways.
of breakdowns (July/August); and, a
Having listened to feedback we plan to publish The Highway Code update in
campaign discouraging tailgating, a
Autumn 2021, which is ahead of the original commitment of March 2022
factor in around one in eight casualties
Working with partners: working more closely with the recovery industry to on England’s motorways and major
strengthen our relationship, which means we have a common and agreed set of A-roads (September/October).
safe operating procedures across the industry to help drivers who get into difficulty
on smart motorways
Increasing visibility: reviewing the use of red flashing lamps for recovery vehicles,
in response to calls from the recovery industry.
10 11
First year progress report                                                                                                                                           First year progress report

       Action                What we have delivered since                   What will happen next        Action              What we have delivered since            What will happen next
                             March 2020                                                                                      March 2020
       Reducing              We are currently progressing five              All DHS motorways will       Improving           The updates to The Highway Code         Following public
       Confusion:            locations through the preliminary              be converted to ALR          guidance:           will provide more guidance for          consultation, we will
       ending the use        design and survey stages, with all due         motorways by March 2025.     an update of The    motorists driving on high-speed         present a final package
       of Dynamic            to complete this stage by June 2021.                                        Highway Code        roads, including smart motorways.       of updates to The
       Hard Shoulders                                                       We have a complex                                We shared our proposals with 37         Highway Code and seek
                             These locations are:                           programme of work to                             stakeholder organisations in a          Parliamentary approval.
                             M42 Junctions 4 to 7,                          make this happen, which is                       pre-consultation exercise.
                             M1 Junctions 10 to 13,                         on track.                                                                                Subject to this we plan to
                             M4 Junctions 19 to 20/M5 Junctions 15 to 17,                                                    Working collaboratively with the        publish The Highway Code
                             M6 Junctions 4 to 10a; and                                                                      Department for Transport and Driver     update in Autumn 2021,
                             M62 Junctions 25 to 30.                                                                         and Vehicle Standards Agency we         which is ahead of the
                                                                                                                             have been able to secure a timeline     original commitment of
                                                                                                                             which will ensure the updates to The    March 2022.
                             These will meet the new design
                                                                                                                             Highway Code are published later
                             standard; ‘GD302 – Smart
                                                                                                                             this year.
                             Motorways: Upgrading hard shoulder
                             running to all lane running operation’                                                          The four-week public consultation on
                             published in October 2020. It means                                                             our proposed changes closed on 29
                             that sections of smart motorway                                                                 March 2021.
                             designed from that point will have                                          Working with        We signed a strategic partnership       We will continue to work
                             concrete central reservation barriers,                                      partners: closer    agreement with the independent          collaboratively with the
                             SVD technology, improved emergency                                          working with the    recovery industry in March 2020         recovery industry and drive
                             signage, full CCTV coverage and                                             recovery industry   to strengthen our relationship. This    forward the commitments
                             places to stop in an emergency                                                                  provides a structured approach to       made in the strategic
                             three-quarters of a mile apart, where                                                           regular engagement with industry        partnership agreement.
                             feasible, with a maximum of one mile4.                                                          leads, a means to develop best
                                                                                                                             practice training and to enhance safe
                                                                                                                             operating procedures across the
                                                                                                                             industry. The agreement encourages
                                                                                                                             recovery operators to work safely on
                                                                                                                             our network in a standardised way.

       4   with some exceptions where not feasible to construct additional emergency areas, such as
           where junctions intersect or on bridges
12                                                                                                                                                                                                     13
First year progress report First year progress report
Action What we have delivered since
March 2020
What will happen next
Finding a safe place to stop
Increasing The Department for Transport has The trials will be led by the
visibility: completed its review of existing Department for Transport. We know that drivers are concerned about not being
review use of red evidence relating to the use of able to find a safe place to stop in an emergency.
flashing lights red flashing lamps. Ministers have
agreed to implement off-road trials The hard shoulder is perceived to be a place of safety
to understand the likely impact of but, in reality, it does not provide a completely safe
allowing the use of red flashing lamps
for road recovery operators, and to
place to stop; one in 12 motorway fatalities happen
work with the recovery industry to there. On smart motorways, as well as the introduction
promote best working practices and
develop specific industry guidance on
of technology (such as signs and signals that we
vehicle lighting. can vary to display variable speed limits, Red X and
driver information messages and the rollout of radar
SVD technology), the hard shoulder is replaced by
emergency areas which are wider than a hard shoulder
and set back from live traffic lanes. The 2020 Action
Plan committed to providing more emergency areas in
new schemes, making them easier for drivers to see
and adding better signage.
Actions were set out to make it easier for drivers to find a safe place to stop.
These included:
Frequent places to stop: a new design standard which means emergency areas
will be more closely spaced
More places to stop: installing 10 additional emergency areas on the M25
so there are more places to stop in an emergency and considering a national
programme to install more emergency areas on existing smart motorways where
places to stop in an emergency are more than one mile apart
Easier to see: upgrading all existing emergency areas so they are clearer and
more visible to drivers
Better signage: installing clearer, easier to understand and more frequent
approach signs showing the distance to an emergency area
Easier to find: showing places to stop in an emergency on sat navs.
14 15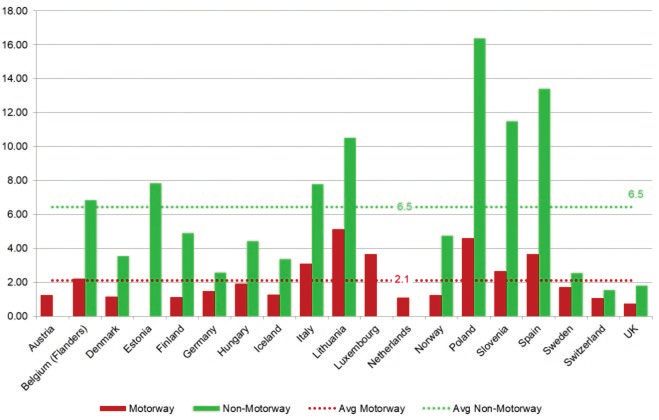
First year progress report First year progress report
Having listened to drivers and motoring organisations, we want to build on the 2020 Action What we have delivered since What will happen next
Action Plan and go further to improve the safety of smart motorways and improve March 2020
public confidence, so we are accelerating two commitments from the 2020 Action Plan: More places We have installed 10 additional Now that the 10 emergency
Better signage: by September 2022, six months earlier than planned, we will have to stop: emergency areas on the M25 areas are open for traffic, we
installed around 1,000 additional approach signs which were committed to in the delivering 10 and all were open to traffic by are monitoring their impact to
2020 Action Plan. These signs are blue featuring an orange SOS telephone symbol additional early December 2020. This understand if they have reduced
and show how far it is to the next place to stop in an emergency, to help drivers emergency means that an additional 14 miles the level of live lane stops. The
reach one and avoid stopping in a live traffic lane areas on of ALR now have emergency monitoring period began on
the M25 areas at a maximum of one mile 1 January 2021.
More places to stop: we committed to complete the monitoring of the impact of apart – nine additional miles
additional emergency areas on the M25. We are accelerating this commitment to between Junctions 23 and 27, In the 2020 Action Plan we
complete the monitoring and present a report to the Department for Transport by and five additional miles between committed to complete the
end of August 2021, four months earlier than planned. Junctions 5 and 7. monitoring period by 31
The original actions from the 2020 Action Plan and our commitment to install extra December 2021. We are
signage sooner will increase the likelihood that a driver will be able to find refuge in an accelerating this commitment
emergency and get help. to complete the monitoring
and present a report to the
Action What we have delivered since What will happen next Department for Transport by
March 2020 the end of August 2021.
Frequent We have published a new The new standard will be More places The 2020 Action Plan said We have listened to the
places standard for smart motorways adopted to schemes entering to stop: we should consider a national concerns raised by the public
to stop: which means there will be more the design phase. considering programme to install more places about spacing of places to take
committing to places to stop in an emergency. a national to stop in an emergency on refuge in an emergency, so we
a new standard GD 301 – Smart Motorways programme existing smart motorways, where will report our findings to the
for spacing was published ahead of target to install more places to stop in an emergency Department for Transport by
of places to in October 2020. This standard emergency are more than one mile apart. August 2021. We will continue our
stop in an requires places to stop in an areas on This review is to be completed work to consider a national rollout
emergency emergency to be three-quarter existing smart by April 2022. programme by April 2022.
miles apart where feasible, with motorways
a maximum of one mile5. We will consider a variety of
impacts including disruption
during construction and damage
to the environment. We will also
look at opportunities to reduce
the impact of construction,
such as coordinating the work
with other planned activity. We
will also take account of the
experience gained constructing
the new emergency areas on
5 with some exceptions where not feasible to construct additional emergency areas, such as the M25.
where junctions intersect or on bridges
16 17First year progress report First year progress report
Action What we have delivered since
March 2020
What will happen next
Being safer in moving traffic
Easier to We completed the work to make In addition to the work already
see: making over 300 emergency areas more completed to make emergency Needing to stop, or being forced to stop, in an
emergency visible in May 2020. All existing areas more visible on existing emergency on a live traffic lane is very rare. It can
areas emergency areas now have smart motorways, these
more visible clearly visible orange surfacing emergency area enhancements of course happen on any road but on high-speed
and marked stopping areas with are now standard on all new roads it is more frightening, and help needs to be
clearer, easier to understand and smart motorways designed
more frequent signage. and constructed. at hand quickly.
Better We have completed initial surveys We will accelerate the
The 2020 Stocktake identified that because all lanes on motorways without hard
signage: and we will be installing around completion of our sign
shoulders are ‘live’ traffic lanes, the chance of vehicles stopping in a live traffic lane would
more traffic 1,000 new approach signs installation programme so that
increase. But it also identified that overall the risks a driver would face would be less than
signs giving showing the distance to the next by September 2022 we will have
on a conventional motorway. This is because of the additional technology installed when
the distance to place to stop in an emergency. installed around 1,000 additional
the hard shoulder is removed, including variable speed limits enforced by cameras, more
the next place These additional signs mean you signs in between places to stop in
signs and signals, and electronic message signs giving information to drivers.
to stop in an should almost always be able to an emergency. This is six months
emergency see a sign wherever you are on earlier than planned.
the motorway. The 2020 Action Plan committed to implementing a range of measures to help drivers be
safer in moving traffic. This included commitments to speed up the rollout of radar SVD
Easier to find: We have made location Over the next year we will work
technology to identify stopped drivers, improve the use of electronic overhead signs and
showing places information for all smart motorway with the Department for Transport
signals to warn oncoming drivers and reduce the time it takes for help to arrive. It also
to stop in an emergency areas available to sat to review whether the data is
included a commitment to investigate the safety performance of specific sections of the
emergency on nav providers. being shared with drivers.
M6 and M1 smart motorways where clusters of incidents have occurred previously.
sat navs
Places to We have completed an We are now working on
Radar SVD technology identifies a stopped vehicle, typically within 20 seconds, and
stop: reviewing independent review of the widths completing safety risk
provides an alert to our control room. At the same time, it can also automatically display
existing of 249 emergency areas. The assessments to help guide our
a ‘report of obstruction’ message to drivers to warn oncoming drivers of a stopped
emergency review found 13 are less than next steps for widening any
vehicle ahead. Our operators then set a Red X sign to close one or more lanes, adjust
areas where 4.4 metres wide, but that all 13 narrow emergency areas.
speed limits and deploy traffic officers. This technology was trialled on the M25, where it
the width is less are considerably wider than the
remains in place, is being commissioned on stretches of the M3 and M20 and is currently
than the current standard 3.3 metre width of a
being installed on the M1.
standard conventional hard shoulder.
We are making additional commitments to accelerate delivery of the 2020 Action Plan
and have identified new actions too.
Identifying stopped drivers quicker: radar SVD technology will be in place
on all existing ALR schemes by September 2022 and no new schemes will open
without it
Improving compliance: upgrade enforcement cameras by September 2022 to
support improved compliance with Red X signs
18 19First year progress report First year progress report
Working with fleet operators: using the ‘Driving for Better Business’6 Action What we have delivered since What will happen next
programme to communicate with fleet operators the need for compliance with March 2020
current legislation and guidance in relation to Advanced Driver Assistance Systems. Identifying As a result of the 2020 Stocktake, Results of the trial showed
This includes the use of Automatic Emergency Braking systems. And we will work stopped we committed to launch a large- positive results that, subject to
with the Department for Transport to explore making it illegal to switch off Automatic drivers scale trial of other technologies further work, could lead to future
Emergency Braking. quicker: for detecting stopped vehicles. use elsewhere on the network.
These commitments will allow us to get help quicker to drivers stopped in a live traffic large-scale This action allowed us to look
lane to help drivers be safer in moving traffic and to reduce the likelihood of a collision. trial of CCTV into making greater use of the We remain committed to installing
analytics full CCTV coverage on smart radar SVD technology as our
Action What we have delivered since What will happen next motorways, providing another primary approach for stopped
March 2020 option alongside current vehicle detection on existing
radar technology. ALR schemes by end of
Identifying The 2020 Action Plan set a Based on our experience of
stopped challenging target for us to install installing the technology September 2022.
drivers radar SVD technology on 21 we will be accelerating the We have now completed this
quicker: faster schemes by March 2023. Radar completion of this programme. work, on the M4 near Bristol, to Current DHS motorway sections
rollout of radar SVD technology is currently We will install radar SVD trial an alternative system that will have SVD technology installed
stopped vehicle being commissioned on the technology on every existing analyses CCTV images to identify as part of being converted to ALR
detection M3 Junctions 2 to 4a and M20 ALR scheme by end of stopped vehicles. by March 2025.
technology Junctions 3 to 5. Work on the September 2022.
M1 Junctions 32 to 35a started Video analytics, using 32 of our
in February 2021. We have Current DHS motorway sections CCTV cameras, was used to
completed the design stages on will have SVD technology installed detect stopped vehicles, with
three further schemes. as part of being converted to ALR alerts being relayed to operators.
by March 2025.
We are also making a new
commitment that all new
schemes will have radar SVD
technology installed before they
open, including the six schemes
currently in construction:
M4 Junction 3 to 12,
M1 Junction 13 to 16,
M27 Junction 4 to 11,
M6 Junction 13 to 15,
M56 Junction 6 to 8 and
M6 Junction 21a to 26.
6 www.drivingforbetterbusiness.com
20 21First year progress report First year progress report
Action What we have delivered since What will happen next Action What we have delivered since What will happen next
March 2020 March 2020
Warning The stopped vehicle detection We are on target, by March 2023, Getting help We are on target to deliver the We will continue our work to
oncoming system sends an alert to our to deliver automated display of to drivers roll-out of changes to our traffic support the aim, that by July
drivers: control rooms which they respond ‘report of obstruction’ messages faster: faster officer patrols on certain smart 2021, we will reduce the average
displaying to. At the same time, it can also on signs and signals when radar attendance by motorway sections. We are time it takes traffic officers to
‘report of automatically display a message SVD technology identifies a more Highways doing this to support the aim, attend incidents from
obstruction’ on an electronic overhead sign on potential incident. England traffic that by July 2021, we will reduce 17 to 10 minutes.
messages the motorway. This automatically officer patrols the average time it takes traffic
displays a ‘report of obstruction’ officers to attend incidents from
message to drivers to warn 17 to 10 minutes. This average
oncoming drivers of a stopped response time compares
vehicle ahead. We do this instead favourably with the 15-minute
of automatically setting a Red target for police response time.
X to reflect that the ‘report of
obstruction’ is ‘unverified’, i.e. To do this we have adjusted
we’ve been told there is potentially patrol route strategies across
an obstruction somewhere in regions, giving greater focus to
the carriageway, but we need to those sections of smart motorway
investigate to confirm. This means where the average distance
we can warn oncoming drivers of between places to stop in an
a potential stopped vehicle ahead, emergency is more than one
and then in parallel, our control mile, and so where drivers may
room will investigate and validate if need extra help from our patrols,
it is a stopped vehicle, and when and introducing park up points
confirmed, they will set a Red X to either within, or closer, to
close the appropriate lane. those sections.
Getting help Increasing numbers of newer We are working with stakeholders
‘Report of obstruction’ to drivers cars come with an eCall or ‘SOS’ to agree the key messages for
messages were enabled on faster: making button which can be used to call a public information campaign
the M3 Junctions 2 to 4a in it easier to call for help. which will run later in 2021.
December 2020. for help if you
are forced We have completed work with the For those whose cars do
to stop Society of Motor Manufacturers not have this feature, there is
and Traders (SMMT) to jointly guidance on our website7 on
understand the range of eCall and what to do if your vehicle has a
bCall functions in newer cars, and problem or you get into trouble on
to communicate the benefits a motorway.
to drivers.
7 https://highwaysengland.co.uk/road-safety/breakdowns
22 23First year progress report First year progress report
Action What we have delivered since What will happen next Action What we have delivered since What will happen next
March 2020 March 2020
Improving Following the change in the We will accelerate the Working This measure is a new We will use the Driving for Better
compliance: law, we are on target to deliver completion of our upgrade with fleet commitment we have made Business programme to raise
we have upgrades to enforcement programme so that by operators: since the 2020 Action Plan. awareness of the benefits of
changed the cameras across the whole smart September 2022 we will have use ‘Driving for using Advanced Driver Assistance
law to enable motorway network to enable upgraded all cameras to provide Better Business’ Systems, together with the
automatic automatic detection of Red X automated detection. This is 10 programme to management of driver distraction,
detection violations which can then be months earlier than planned. urge businesses fatigue, and close following. This
of Red X enforced by the police. To date to not switch will help improve compliance with
violations and we have upgraded 33 of the We will work with police forces to off Automatic current legislation and guidance.
enforcement 85 cameras. raise awareness of Red X signs Emergency We will particularly focus on
(three points, and enforcement measures, so Braking Automatic Emergency Braking
£100 fine) We are doing this for the safety that drivers know they must not as these systems reduce the
using cameras of those in the closed lanes and drive in lanes closed by a Red X. likelihood of rear end collisions
because it is illegal to enter the involving heavy goods vehicles.
lane beyond a Red X, until such
time that you pass a sign and It’s already mandatory for
signal cancelling the restriction. Automatic Emergency Braking
systems to be fitted to certain
The vast majority of drivers vehicles, but it’s not currently
comply with Red X signs and, for illegal for it to be switched off.
the very small minority who do
not, the police have the powers We will work with the Department
to prosecute. The penalty can be for Transport to explore making
three points on the driver’s licence it illegal to switch off Automatic
plus a £100 fine. Emergency Braking.
24 25First year progress report First year progress report
Action What we have delivered since
March 2020
What will happen next
Updated safety evidence
Investigating The 2020 Action Plan committed We are finalising the details of the
safety to look further at clusters of measures we will take forward This section of our report supplements the data in
performance: incidents on sections of the to enhance the safety of these the 2020 Stocktake with the latest available road
investigate M6 and M1 smart sections of motorway.
M6 Bromford motorway, specifically: safety statistics and a detailed consideration of live
viaduct and We intend to publish the lane casualties.
sections of M6 Junctions 5 to 6 (Bromford viaduct), findings of our safety reviews
the M1 M1 Junctions 10 to 13, in June 2021.
M1 Junctions 30 to 35, and Safety on the strategic road network
M1 Junctions 39 to 42 Before comparing the safety performance of different motorway types, it is useful to
first understand the latest overall safety of the United Kingdom’s (UK) roads, and in
We have completed extensive particular its motorways.
independent investigations of
these sections of smart motorway. Across all road classifications, the UK has some of the safest roads in the world.
Taking into account the varying levels of car use across different countries, the European
Following the investigations, we Transport Safety Council’s Performance Index (PIN)8 programme enables comparisons of
have also undertaken feasibility road safety progress between European countries to be made. The latest PIN report was
work for the M6 Bromford and published by the European Transport Safety Council in June 2020.
M1 and are developing delivery
programmes for extra measures.
8 The ETSC Road Safety Performance Index (PIN) is a policy tool to help EU Member
States improve road safety
26 27First year progress report First year progress report
Figure 1 below shows that the number of road deaths per million inhabitants is lower In its latest report published in October 2020, the Conference of European Directors of
in the UK than the majority of countries within Europe, at 29 road deaths per million Roads found that the UK’s roads have fatal accident rates well below the average across
inhabitants. Only Norway, Sweden and Switzerland perform better (Ireland9 performs Europe (see Figure 2 below). The UK has a lower average annual fatal accident rate on
the same as the UK). motorways than any other participating country, and is second only to Switzerland for
Figure 1 non-motorway strategic roads.
Number of road deaths per million inhabitants in 201910
120
There is always scope for further improvement. We take road safety very seriously
and have a strategic ambition that nobody should be harmed when using or working
on our roads11.
100
Figure 2
Average Annual Fatal Casualty Rate per billion vehicle kilometres by country 201912
80
60
40
20
0
NO SE CH IE* UK MT DK IL LU ES* DE* FI* NL EE SK AT SI FR IT* BE* CZ CY HU PT* EL* LT LV HR RS* PL BG* RO
Source: Visualisation from Highways England. Data based on ETSC.
Country Code Country Code
Austria AT Lithuania LT
Belgium BE Luxembourg LU
Bulgaria BG Malta MT
Croatia HR The Netherlands NL
Cyprus CY Poland PL
The Czech Republic CZ Portugal PT
Denmark DK Romania RO Source: Visualisation and data based on CEDR Report 2020.
Estonia EE Slovakia SK
Finland FI Slovenia SI Compared to other roads in Great Britain, motorways are comparatively the safest roads
France FR Spain ES to travel on. Figure 3 also shows that in 2019, the majority of fatalities (57%) occurred on
Germany DE Sweden SE
Greece EL United Kingdom UK
rural roads, whereas the majority of casualties (63%) occurred on urban roads. Although
Hungary HU Israel IL motorways carry around 20% of traffic, they only account for 6% of fatalities. Any move
Ireland IE Norway NO towards increasing capacity on our most safe roads, provides safer overall capacity for
Italy IT Serbia RS
Latvia LV Switzerland CH
drivers on the road. That is because the extra capacity draws traffic from less safe roads
where there are tragically more deaths and injuries.
9 the European Transport Safety Council’s Performance Index defines Ireland as 11 we have a stretching target to reduce the number of people killed or seriously injured on our
Republic of Ireland roads by 50% by 2025
10 Countries with an asterisk (*) indicate provisional fatality figures. 12 Average Annual Fatal Accident Rate per billion vehicle kilometres
https://etsc.eu/14th-annual-road-safety-performance-index-pin-report/ https://www.cedr.eu/download/Publications/2020/CEDR-Technical-Report-2020-01-TEN-T
28 29
2019-Performance-Report.pdfFirst year progress report First year progress report
Figure 3 – Casualties by severity and road type in Great Britain 201913 Our motorways are the safest type of road in the country - of the 7,515 deaths on England’s
roads between 2015-2019, 431 were on motorways, and of those 24 on ALR motorways.
Fatalities 37% 57% 6%
Safety update on smart motorways15
The 2020 Stocktake provided a comprehensive summary of the safety of smart
All casualties 63% 32% 4% motorways, considering all available data sources. The 2020 Stocktake found that for
the first nine ALR schemes, the overall casualty rate improved significantly, following the
Traffic 37% 43% 20% conversion to ALR, by 18% compared to what might have been expected without the
conversion. The report concluded that, overall, smart motorways are in most ways as
0% 10% 20% 30% 40% 50% 60% 70% 80% 90% 100%
safe as, or safer than, the conventional ones. But not in every way. It set out an action
Urban Rural Motorway
plan to further improve safety on the smart motorway network.
Source: Visualisation from Highways England. Data based on STATS19.
Now, 12 months after the publication of the 2020 Stocktake, we are building on the
In England there were 1,489 fatal casualties in 2019 with 1,279 (86%) of them taking place evidence base it provides using the latest safety evidence. This evidence includes 2019
outside of the strategic road network. Out of the 210 (14%) fatalities on the strategic road safety data and measures, such as casualty rates (i.e. casualties per hundred million
network, 125 (8%) took place on A-roads and 85 (6%) on motorways. vehicle miles - hmvm), fatal and weighted injury rates (i.e. FWI per hmvm) and casualty
trends. By considering these safety measures, there is a consistent comparison across
Out of the total fatalities in England in 2019, 15 (1%) took place on motorways without a schemes with different traffic levels. All measures and underpinning calculations have
permanent hard shoulder (ALR and DHS), in comparison to 70 (5%) on motorways with followed the methodology adopted for the 2020 Stocktake.
a permanent hard shoulder (conventional and controlled). Figure 4 also shows that within
England, before accounting for road length or traffic flows, the strategic road network and Since the 2020 Stocktake there has been understandable interest in incidents where
motorways are comparatively the safest roads to travel on. vehicles have stopped in a live-lane, so we have considered additional data on live-lane
fatalities (both moving and stopped).
Figure 4 – Fatalities by country and road type in England 201914
This report aims to confirm whether, after considering the 2019 safety data, the safety
conclusions outlined in the 2020 Stocktake remain valid16. It does not aim to fully replicate
the 2020 Stocktake17 or report on the effectiveness of the interventions outlined in the
2020 Stocktake. These interventions are currently being delivered and will be monitored
and evaluated at appropriate intervals.
15 The 2020 Stocktake considered smart motorways to include ALR, DHS and
controlled motorways.
16 The 2020 Stocktake considered smart motorways to include ALR, DHS and
Source: Visualisation from Highways England. Data based on STATS19. controlled motorways.
17 The 2020 Stocktake also considered other measures which are replaced by current or
future analytical activities. For example, hazard assessments and evidence from the ‘Smart
13 Please note this excludes Northern Ireland. Motorway All Lane Running Overarching Safety Report’ were referenced in the 2020
https://assets.publishing.service.gov.uk/government/uploads/system/uploads/ Stocktake to demonstrate that the ALR concept was delivering its safety objective (to
attachment_data/file/922717/reported-road-casualties-annual-report-2019.pdf maintain or improve safety by the FWI measure). As their intended objective for the ALR
14 The data has been derived and visualised by Highways England based on the 2019 concept was met, this will not be updated further. Instead, Post Opening Project Evaluation
STATS19 data (https://www.gov.uk/government/collections/road-accidents-and- (POPE) reports will aim to compare the safety impact before and after an intervention
30 safety-statistics) or a project is delivered. At the time of drafting this report, no new POPE reports have been 31
published. Scheme-specific POPE reports will follow later in 2021.First year progress report First year progress report
Data on road traffic casualties on the roads in Great Britain are collected via the STATS19 Figure 5 highlights that ALR has a slightly higher fatal casualty rate in comparison to DHS.
process18. These statistics are collected by police forces, either through officers attending DHS is an existing type of smart motorway where the hard shoulder is used as a live
the scene of incidents, from members of the public reporting the incident in police traffic lane to increase capacity temporarily only when it is needed most. The 2020 Action
stations after the incident, or more recently online and then validated and published Plan highlighted that this type of smart motorway has the potential to cause confusion
annually by the Department for Transport. The analysis presented here is developed by for drivers because the hard shoulder is sometimes in use for traffic, and sometimes not.
Highways England using STATS19 data (unless stated otherwise). Also, as time goes on and the motorway becomes busier, the hard shoulder is in use as
a live traffic lane for longer periods of time and the motorway essentially acts as ALR. We
Like other transport authorities across the UK the key measure we use to assess the acknowledge that there is a risk of confusion of operating a relatively intermittent hard
safety of roads, is Fatal and Weighted Injuries (FWI). This gives a fatality 10 times the shoulder on a DHS motorway and therefore, and as set out in the 2020 Stocktake and
weight of a serious casualty, and a serious casualty 10 times the weight of a slight earlier in this report, DHS motorways are being converted to ALR to reduce confusion.
casualty. In effect, it takes all the non-fatal injuries and adds them up using a weighting
factor to give a total number of ‘fatality equivalents’. This FWI figure is used to compare
one year with another. The actual fatalities are also listed as it is possible for the FWI to Figure 5
go down even if the actual number of fatalities has gone up, due to a reduction in the Annual average fatal casualties per hundred million vehicle miles travelled,
number of less- severe accidents. by SRN road type (2015-19 weighted average)
Casualty data can change significantly from year to year, depending on circumstances
in any given year, and casualty rates can be sensitive to small changes in the absolute
number of casualties. Volatility is an issue as it can obscure more meaningful conclusions
that can be drawn from the data. When considering casualty statistics, looking at the
average over a recent set of years reduces the impact of volatility and helps identify
trends. This report uses the last five years of available data (2015-2019).
Fatal casualty data between 2015 and 2019 for A-roads on the strategic road network
and all types of motorway are set out in Annex B and traffic statistics for the same roads
are set out in Annex A. Using these two sets of data, the rate of fatalities can
be calculated.
Overall, the data shows that fatality rates i.e. the rate of fatalities per hundred million
vehicle miles (hmvm) travelled, averaged across all years between 2015 and 2019 are
lower on smart motorways at 0.09 per hmvm versus conventional motorways at 0.16 per
hmvm. Furthermore, each type of smart motorway has a (slightly) lower rate of fatalities
than conventional motorways: controlled is 0.07 per hmvm, DHS is 0.09 per hmvm and
ALR is 0.12 per hmvm. This is illustrated in Figure 5.
Source: Data from Highways England based on STATS19.
18 The STATS19 database is a collection of all road traffic accidents that resulted in a personal
injury and were reported to the police within 30 days of the accident. More information can
be found at: https://data.gov.uk/dataset/cb7ae6f0-4be6-4935-9277-47e5ce24a11f/road
safety-data
32 33First year progress report First year progress report
A similar analysis using the FWI measure, over the same 2015 to 2019 period shows Fatalities on motorways without a permanent hard shoulder
that smart motorways have a FWI rate of 0.33 per hmvm, slightly lower than conventional The risk of a live lane collision between a moving vehicle and a stopped vehicle is greater
motorways at 0.37 per hmvm. The FWI for smart motorways are 0.32, 0.34 and 0.35 on ALR and DHS motorways. But the risk of a collision between two or more moving
per hmvm for controlled, DHS and ALR respectively. vehicles is lower. This is because ALR and DHS motorways have variable mandatory
speed limits to smooth traffic flow, and electronic signs and signals to warn drivers of
While the rate of fatalities and the FWI measure demonstrate that all types of smart incidents ahead. This means less speeding, tailgating and fewer rapid changes of speed,
motorways are safer than conventional motorways, it remains that case that they are not which gives drivers more time to react if something happens.
safer in every way.
In 2019, 50,995 live lane breakdowns (LLB) incidents were reported on the strategic road
In more detail: network. Half of these took place on conventional motorways, whereas approximately a
quarter took place on motorways without a permanent hard shoulder (ALR and DHS).
Casualty rates on all motorway types are lower than A-Roads on the strategic road
While these figures indicate the total number of breakdown incidents, most LLBs do not
network, for each type of severity and the Fatal and Weighted Injuries measure
lead to fatal or serious casualties.
Fatal casualty rates on controlled (0.07 per hmvm), DHS (0.09 per hmvm) are lower
than on conventional motorways (0.16 per hmvm), while ALR are slightly lower (0.12 Since the publication of the 2020 Stocktake there has been significant interest in the
per hmvm) number of LLBs on motorways without a permanent hard shoulder (i.e. ALR and DHS
motorways). Breaking down in a live lane is the main concern drivers have about smart
Fatal and Weighted Injury rates on controlled (0.32 per hmvm), DHS (0.34 per
motorways. Here we look at how many fatal casualties have occurred in a live lane. By
hmvm) and ALR (0.35 per hmvm) schemes are slightly lower than on conventional
using STATS19 data, we have focused on all live-lane fatalities for the period 2015- 2019.
motorways (0.37 per hmvm)
Serious casualty rates on controlled (1.14 per hmvm) and ALR (1.24 per hmvm)
schemes are slightly higher to conventional motorways (1.12 per hmvm), while DHS Table 1
are slightly lower (1.10 per hmvm) Live Lane Fatalities
Total
(moving and stopped 2015 2016 2017 2018 2019
Slight casualty rates are higher on controlled (13.59 per hmvm) and DHS (13.83 per (2015-19)
vehicles)
hmvm) compared to conventional motorways (9.63 per hmvm), while ALR roads are
Fatalities on live lanes of
slightly higher (9.73 per hmvm). 76 65 78 62 60 341
conventional motorways
This means that based on the updated casualty data alone, the latest safety analysis Fatalities on live lanes of
5 1 3 8 5 22
is consistent with the conclusions of the Government 2020 Stocktake (see Annex C). controlled motorways
Overall, what the evidence shows us is that in most ways, smart motorways are as safe Fatalities on live lanes of
2 2 1 1 6 12
as, or safer than, the conventional ones, but not in every way. DHS motorways
Fatalities on live lanes of
0 1 4 10 9 24
Through the actions we have already taken, and those accelerated commitments made ALR motorways
in this report, we are determined to do all we can to make drivers both feel safe and
be safer on our roads. Through monitoring and evaluation activities, we will continue to Source: STATS19, Highways England Statistics on live lane casualties in England,
assess the overall safety of smart motorways and the effectiveness of the interventions and DfT Road Traffic Statistics on the strategic road network in England from 2015-19
outlined in the 2020 Stocktake. Additionally, Post Opening Project Evaluation (POPE)
reports for specific schemes will be published to compare the safety impact before and
after a project is delivered.
34 35First year progress report First year progress report
Table 2
Live Lane Fatality Rates
Total
(moving and stopped 2015 2016 2017 2018 2019
(2015-19)
vehicles)
Fatality rates (per hundred
million vehicle miles) on
0.16 0.14 0.17 0.14 0.13 0.15
live lanes of conventional
motorways
Fatality rates (per hundred
million vehicle miles) on
0.08 0.02 0.05 0.11 0.07 0.06
live lanes of controlled
motorways
Fatality rates (per hundred
million vehicle miles) on live 0.07 0.06 0.03 0.03 0.18 0.08
lanes of DHS motorways
Fatality rates (per hundred
million vehicle miles) on live 0.00 0.04 0.10 0.19 0.14 0.12
lanes of ALR motorways
Source: STATS19, Highways England Statistics on live lane casualties in England,
and DfT Road Traffic Statistics on the strategic road network in England from 2015-19
Taking traffic flow into account from tables 1 and 2 above, ALR motorways are overall
slightly safer than conventional motorways. Over the period 2015-2019, conventional
motorways had an average of 0.15 live lane fatalities per hundred million vehicle miles
compared to 0.12 for ALR motorways.
Based on data and measures between 2015- 2019, this evidence shows fatality
rates in live lanes are slightly lower on ALR motorways compared to those on
conventional motorways.
36 37First year progress report First year progress report
Conclusion The 2020 Stocktake found, collisions between a moving vehicle and a stopped vehicle
are more likely on ALR and DHS motorways. But collisions between two or more moving
vehicles – which is how more people die – are less likely. Technology introduced on smart
Working in partnership with the Department for motorways regulates speeds more safely.
Transport and other stakeholders, we have made Technology, in the form of stopped vehicle detection, can also reduce the risk of collision
significant progress and remain on track to deliver the between a moving vehicle and a stopped vehicle. So we are continuing to roll out this
technology, too – and faster than we previously planned.
2020 Action Plan. Drivers are better informed about the
extra features of smart motorways and we are tackling We are determined to do all we can to help drivers feel safer and be safer on our roads – all
our roads. While some have suggested changes, for example converting a smart motorway
perceptions and public confidence in their safety. live traffic lane back to a hard shoulder, this would reduce their capacity by a quarter. The
resulting congestion on the motorways would cause significant numbers of drivers to divert
But we recognise that concerns have continued to be raised about smart motorways and, to roads which are less safe, increasing the numbers of people killed and seriously injured
in particular, the impact that removing the hard shoulder has on driver safety. on our nation’s roads overall. It would almost certainly increase overall danger, not reduce it.
All road journeys involve risk and the UK has some of the safest roads in the world. However, we will accelerate our efforts to enhance the current position. As part of this
Progress Report we are, therefore, committing to further raise the bar on safety, to address
This Progress Report shows that in terms of fatality rates, smart motorways are the safest public concern around and improve public confidence in smart motorways. This builds
roads in the country. on the £500m the Transport Secretary has already committed to smart motorway
In more detail, it also shows that approximately per mile travelled: safety improvements.
fatal casualty rates are a third higher on conventional motorways (0.16 per hundred On existing smart motorways:
million vehicle miles (hmvm)) compared to ALR (0.12 per hmvm). Fatal casualty rates By the end of September 2022, six months earlier than previously committed:
on strategic road network A-roads (0.44 per hmvm) are three and a half times the rate
on ALR On existing ALR smart motorways we will have completed the installation of radar
technology which detects stopped vehicles
serious casualty rates are a tenth lower on conventional motorways (1.12 per hmvm)
compared to ALR (1.24 per hmvm). Serious casualty rates on strategic road network We will have installed around 1,000 additional signs to better inform drivers of the
A-roads (3.04 per hmvm) are two and a half times the rate on ALR distance to the next place to stop in an emergency
By the end of September 2022, 10 months earlier than previously committed:
slight casualty rates on conventional motorways (9.63 per hmvm) are similar to ALR
(9.73 per hmvm) and are double on strategic road network A-roads (19.27 per hmvm) We will have upgraded cameras that automatically detect vehicles passing illegally
compared to ALR. under a ‘Red X’ or entering the lane beyond a Red X, so the police can take
enforcement action. We are doing this for the safety of those in the closed lanes
This is in line with the findings of the 2020 Stocktake that “overall, what the evidence shows
and because it’s illegal to enter the lane beyond a Red X, until such time that you
is that in most ways, smart motorways are as safe as, or safer than, the conventional ones.
pass a sign and signal cancelling the restriction
But not in every way”.
We will continue to consider a national programme of retrofitting additional emergency
These figures have been compiled on a five-year basis (2015-19 inclusive), because single- areas on existing smart motorways where places to stop in an emergency are more
year figures are too low and variable to draw consistent conclusions from. For the year than one mile apart. This review will be complete by April 2022.
2019, the total number of deaths on all motorways was 85, of which 15 were on ALR and
Dynamic Hard Shoulder Running (DHS) motorways. This was a rise of four since 2018,
reflecting in part the increase in traffic on the motorway network generally and on these
roads in particular. We will continue to monitor and evaluate safety on our network.
38 39You can also read