Smartphone Coupled with a Paper-Based Colorimetric Device for Sensitive and Portable Mercury Ion Sensing - MDPI
←
→
Page content transcription
If your browser does not render page correctly, please read the page content below
chemosensors

Article
Smartphone Coupled with a Paper-Based
Colorimetric Device for Sensitive and Portable
Mercury Ion Sensing
M. Lutfi Firdaus 1, * , Angga Aprian 1 , Nessi Meileza 1 , Marti Hitsmi 1 , Rina Elvia 1 ,
Lena Rahmidar 2 and Renat Khaydarov 3
 1   Graduate School of Science Education, University of Bengkulu, Bengkulu 38371, Indonesia;
     anggaaprian13@gmail.com (A.A.); nessimeileza23@gmail.com (N.M.); martihitsmi31@gmail.com (M.H.);
     relvia@unib.ac.id (R.E.)
 2   Material Science Research Group, Universitas BSI, Bandung 40291, Indonesia; lenarahmidar@gmail.com
 3   Institute of Nuclear Physics, Uzbek Academy of Sciences, Tashkent 100214, Uzbekistan; renat2@gmail.com
 *   Correspondence: lutfi@unib.ac.id; Tel.: +62-822-1721-6770

 Received: 8 April 2019; Accepted: 13 May 2019; Published: 17 May 2019

 Abstract: The rapid development of information and communication technology provides an
 opportunity for scientists to develop a quantitative analytical method that is built on a mobile gadget
 as a detector. In this paper, we report a low-cost, simple and portable analytical method for mercury
 ion quantification based on digital image colorimetry coupled with a smartphone application. A small
 amount of silver nanoparticles (AgNPs) was used as a colorimetric agent that is selective only to
 mercury ions. The yellowish brown color of AgNPs instantly changed to colorless after the addition
 of mercury ions due to a redox reaction. To increase the portability, we attached the AgNPs onto
 a medium to create a paper-based analytical device. The final data processing of the colorimetric
 analysis was conducted using an android application available on the Google Play Store, called
 “Mercury Detector”. The proposed method has good sensitivity, with a detection limit of 0.86 ppb,
 which is comparable to those of bulk and more expensive instruments. This allows for the detection
 of mercury ions as low as 2 ppb (10 nM), which is also the maximum contaminant level permitted in
 drinking water by the US Environmental Protection Agency. The proposed method was applied to
 real samples that provide satisfactory results on accuracy (2.4%) and precision (2.5%).

 Keywords: mercury; toxic metal; silver nanoparticles; colorimetry; spectrophotometry; digital image;
 smartphone application; paper-based analytical device

1. Introduction
      Modern industrial developments often pay minimal attention to environmental sustainability.
Mercury has been used extensively in various industries such as gold and coal mining as well as in
electrical equipment, batteries, semiconductors and medical appliances [1–5]. Mercury compounds are
also naturally emitted into the atmosphere from volcanoes, forest fires, the weathering of rocks and
soils [6]. Although it benefits various industries, mercury and its derivatives are harmful to ecosystems
and to humans. Elemental and organic mercury is toxic to the peripheral and central nervous systems.
The exposure of mercury vapor can produce adverse effects on the neural, digestive and immune
systems [3]. Methylmercury is the most toxic derivate amongst the mercury compounds that develop
from inorganic mercury through the activity of microorganisms living in aquatic systems including
rivers, lakes, wetlands, sediments, soils and the ocean. The higher toxicity of methylmercury compared
with inorganic mercury is the result of its lipophilic nature. It tends to bioaccumulate within the living
cell and subsequently undergoes bioaccumulation throughout the food chain [7]. Therefore, mercury

Chemosensors 2019, 7, 25; doi:10.3390/chemosensors7020025                 www.mdpi.com/journal/chemosensors
Chemosensors 2019, 7, 25                                                                               2 of 9

in the natural environment is an important chemical that needs to be monitored continuously due to
its extremely toxic nature.
      Recently, digital image-based colorimetry is receiving more attention as an alternative to the
conventional methods, owing to its green, low-cost, portable and simple analytical procedure to
analyze chemical compounds including metals [8–11], anions [12,13], organics [14,15], biochemical
compounds [16,17] and medical applications [18–20]. The dynamic range of the digital image
represented by red-green-blue or RGB color space (i.e., from 0 to 255), is much broader than conventional
colorimetry or spectrophotometry methods (i.e., from 0 to 2.0 absorbance) providing the opportunity
to improve the sensitivity of detection [8,18]. The main requirement of quantitative analysis using
the colorimetry method is that the target analyte must be colored. Generally, the analyst uses organic
ligands to make the colorless metal of interest colorful. However, organic ligands are toxic and less
selective to specific metal targets. Recently, many researchers have developed noble metal nanoparticles
as color probes to detect mercury ions [21–24]. Gold and silver nanoparticles have several advantages
over organic ligands to make colorless metals colorful, such as better sensitivity, greater selectivity to a
specific metal’s target and lower toxicity. Therefore, this new kind of colorimetry using digital imaging
coupled with noble metal nanoparticles is becoming popular in the detection of mercury ions. However,
the limit of detection (LOD) is at the sub-ppm range [25,26], comparable to those of conventional
colorimetry and spectrophotometry methods, and is still too high to detect mercury contamination in
drinking water. Therefore, it is crucial to improve the LOD of the previously proposed colorimetry
methods. Here, we report the first quantitative method for the detection of mercury ions at the ppb
level using silver nanoparticles as a probe, coupled with image-based colorimetric sensing. In addition,
we built a paper-based analytical device (PAD) and a smartphone application for better portability.

2. Materials and Methods

2.1. Chemicals and Instruments
      All chemicals used were of analytical grade or of the highest purity available. Silver nitrate,
ascorbic acid, trisodium citrate, salts of cations for selectivity tests and other chemicals were supplied
by Merck Ltd. (Darmstadt, Germany). All glassware was washed with detergent (5%), 4 M HCl
and deionized water before use. River water samples were filtered through a 2.5 µm Whatman
filter paper (GE Healthcare, UK). Absorption spectra of the synthesized silver nanoparticles (AgNPs)
were measured using a UV-visible Spectrophotometer (B-One, Messgerate). As a reference method,
mercury ion analysis was conducted using ICP-OES (Varian 725-ES Agilent Inc., Palo Alto, CA, USA).
A smartphone camera (Redmi Note 3 Pro, Xiaomi, Beijing, China) with a 16 MP sensor, f/2.0 aperture,
phase detection focusing and dual-LED (Light Emitting Diode) flash was used to record pictures as
digital images.

2.2. Silver Nanoparticles (AgNPs) Preparation
      AgNPs were synthesized from silver nitrate (AgNO3 ) with ascorbic acid as a reductant. Trisodium
citrate was used as a stabilizing agent to prevent aggregation of the formed AgNPs. Typically, 80 µL of
0.1 M aqueous AgNO3 was added into 8 mL of aqueous solution containing ascorbic acid (6 × 10⁻⁴ M)
and trisodium citrate (3 × 10⁻³ M) under constant stirring at 30 ◦ C on a hotplate. The procedure was
conducted at pH 7.0, modified from Qin et al. [27]. The colloid of AgNPs was formed after 15 min
and is characterized by the appearance of a yellowish brown color from the initial colorless solution.
Further characterization of the AgNPs was conducted using the spectrophotometer.

2.3. Image Acquisition and Paper-Based Analytical Device (PAD) Preparation
     Digital images of the sample in cuvettes were taken by a smartphone in a custom-made mini
photo studio, while those of the PAD were taken in a custom-made photo box. The PAD was printed
on a Whatman filter paper (GE Healthcare, Little Chalfont, UK), using a modified inkjet ip2770 printer
Chemosensors 2019, 7, 25                                                                               3 of 9

(Canon, Tokyo, Japan) with hydrophobic ink and permanent-ink markers. The post-processing of
the digital image was initially done using a personal computer with software such as Photoshop
(Adobe Inc., San Jose, CA, USA) for cropping and adjustment, MATLAB (MathWorks) for RGB
color value extraction and Android Studio (Google Inc., Mountain View, CA, USA) for building the
smartphone application. More detailed procedures have been published elsewhere [8,26,28–30].

2.4. Quantification of the Digital Image
     To validate the code of the smartphone application, we used manual image processing procedures
described as follows [8]. In brief, the digital image from the smartphone camera was transferred to
the computer and processed with Adobe Photoshop software. In this case, a digital image from the
smartphone camera serves as a spectrophotometer analyzing the light passing through the colloid of
the AgNPs. The average RGB color values were extracted from the image using MATLAB software.
The raw plot of the RGB color values against the concentration of the standards, produces a hyperbolic
trend. To obtain a linear plot for further usage, the initial RGB color values were converted to
logarithmic scale following the Lambert–Beer law derivation formula as follows [8]:

                                              R0           G0         B0
                                   IR = log      ; IG = log ; IB = log .
                                              Rs           Gs         Bs

     IR , IG and IB are the (color) intensity or absorbance for red, green and blue, respectively. The terms
(RGB)0 and (RGB)s are the RGB color values of the blank and the sample, respectively. It should
be pointed out that here, the term ‘intensity’ refers to the number of R, G and B color values of the
digital image, and thus is different from that used in UV-visible spectrophotometry. The logarithmic
conversion of RGB color values is directly proportional to the mercury ion concentration, so it can be
used for the quantification of mercury ions in the samples.

2.5. Construction of the Smartphone Application
     Android Studio software was used to build the app for in situ digital image cropping, adjustment,
color value extraction and data processing. Directly after pouring the samples solution into the colloid
of the AgNPs or the PAD, the digital image was captured as a photograph and processed by the android
application. Thus, the concentration of mercury ions in the photographed sample can be identified
instantly by the smartphone. To minimize any error from the camera and external sources, the samples
were always photographed together with the standards in one file. Thus, errors from external sources
were minimized. We also used an additional application (Camera FV-5), to manually control the
camera setting with ISO 200, aperture f/2.0, focus, white balance and exposure. The examples of the
smartphone application interface and android studio coding are shown in the Supplementary Materials
(Figure S1). The application was published and can be downloaded from the Google Play Store under
the name “Mercury Detector.”

3. Results and Discussion

3.1. Silver Nanoparticles as a Colorimetric Agent
      The synthesized AgNPs have a yellowish brown color with the highest absorbance obtained at
420 nm wavelength (λmax ). This result was in accordance with previous reports [26–28]. The AgNPs
were stable for 30 days as shown by the color and the uniform peak absorbance (Figure S2). However,
after 45 days, the aggregation of nanoparticles started to occur, and the peak absorbance also decreased.
The aggregation of the AgNPs that occurs after a longer period of storage (more than 30 days) is probably
due to electromagnetic interactions among the silver nanoparticles which induce the agglomeration of
AgNPs to a larger size. This phenomenon eventually changes the yellowish brown color of AgNPs to
dark brown and then it becomes colorless, followed by the formation of the suspended particles at the
bottom of the container. The mechanism for mercury colorimetric detection using silver nanoparticles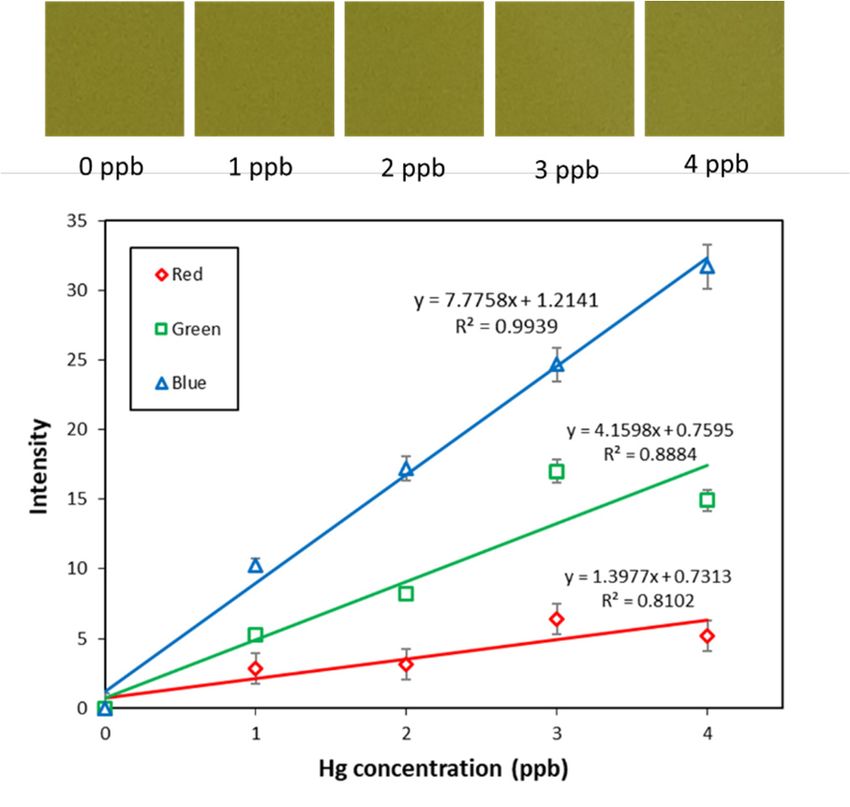
after a longer period of storage (more than 30 days) is probably due to electromagnetic
interactions among the silver nanoparticles which induce the agglomeration of AgNPs to a
larger size. This phenomenon eventually changes the yellowish brown color of AgNPs to
dark brown and then it becomes colorless, followed by the formation of the suspended
particles at the bottom of the container. The mechanism for mercury colorimetric detection
Chemosensors 2019, 7, 25 4 of 9
using silver nanoparticles as a probe is reduction–oxidation. The oxidation of Ag(0) to Ag(I)
by Hg(II) changes the color of the AgNPs to colorless. This redox reaction generates the
as a probe
changeisinreduction–oxidation.
the nanoparticles’ size The oxidation
known as theofMie
Ag(0) to shift
blue Ag(I)ofby
theHg(II)
AgNPs’changes the color
absorption bandof the
AgNPs[26].to colorless. This redox reaction generates the change in the nanoparticles’ size known as the
Mie blue By shift of the
using theAgNPs’ absorption
fresh AgNPs, band [26]. experiment was conducted on various cations
the selectivity
By using
that couldthe fresh AgNPs,
interfere with thethe selectivity
accuracy and experiment
precision ofwasthe conducted on various
proposed method. cations
There is nothat
couldcolor change of AgNPs after adding 60 ppm of aluminum, calcium, chromium, cobalt, of
interfere with the accuracy and precision of the proposed method. There is no color change
AgNPs after iron,
copper, adding 60 ppm
lead, of aluminum,
magnesium, calcium,
manganese, chromium,
nickel, cobalt,
potassium, copper,and
sodium iron, lead,
zinc. magnesium,
However,
manganese,
when Hg nickel, potassium,
was added sodium
to AgNPs, theand
peakzinc. However,
absorbance at when
420 nm Hg was added and
disappeared to AgNPs, the peak
the mixture
absorbance
becameatcolorless
420 nm disappeared and the
within seconds. mixture
This proved became colorless
that the withinmethod
proposed seconds.is This proved
selective tothat
the proposed
mercury ionsmethodonlyis(Figure
selective
1).to mercury ions only (Figure 1).
Figure 1. Change in absorbance of the silver nanoparticles’ (AgNPs) colloid in the presence of 60 ppm
Figure
Hg(II) 1. Change
and other metal in absorbance of the silver nanoparticles’ (AgNPs) colloid in the presence
ions.
of 60 ppm Hg(II) and other metal ions.
3.2. Improving the Sensitivity and Portability of Digital Image-Based Colorimetry
3.2.
MostImproving the Sensitivity
of the colorimetry and Portability
methods of Digital
for mercury Image-Based
quantification Colorimetry
can only achieve a detection limit
(LOD) comparable
Most of thetocolorimetry
that of a visible spectrophotometer,
methods which is in the
for mercury quantification can sub-ppm range,
only achieve with visible
a detection
colorlimit
changes starting from 20 ppm or above [26,28–30]. However, the threshold
(LOD) comparable to that of a visible spectrophotometer, which is in the sub-ppm of mercury in drinking
waterrange,
allowed
withbyvisible
the UScolor
Environmental Protection
changes starting Agency
from 20 ppm (EPA) is 2 ppb
or above [31,32], which
[26,28–30]. is twothe
However, orders
of magnitude
threshold lower than in
of mercury thedrinking
detection limitallowed
water achievedby by
themost colorimetry and
US Environmental spectrophotometry
Protection Agency
methods.
(EPA)To is overcome this shortcoming,
2 ppb [31,32], which is twoin this report
orders we improved
of magnitude lowerthe detection
than limit bylimit
the detection using a
custom-made
achieved mini photo studio
by most to control
colorimetry andthespectrophotometry
light as shown in Figure 2.
methods. To overcome this
Aside from using
shortcoming, thereport
in this custom-made
we improvedphoto studio, cuvettes
the detection replaced
limit vialabottles
by using that weremini
custom-made used in
previous
photomethods
studio to ascontrol
cuvettes thehave
lighta as
flatshown
surface. The flat2.form of the container’s surface is crucial in
in Figure
achieving accurate and precise results with digital image-based colorimetry. By using flat-surfaced
cuvettes as sample containers, coupled with white LED lamps from photo studio lighting, we could
easily distinguish mercury concentration at the ppb level as shown in Figure 2 and Table 1. The results
of ppm-level plots are shown in Figure S3. The intensity of the blue color increases linearly along with
the increasing mercury concentration from 1 to 4 ppb (Table 1 and Figure 3). Blue is the complementary
color of the yellowish brown color of AgNPs. Therefore, blue will have the best linearity and highest
slope. As a consequence, since red and green are not the complementary colors of AgNPs, they will
have poor linearity and slope. Thus, we only used blue intensity for further calculation for our research.
Using the optimized method, we were able to achieve a lower detection limit—0.86 ppb—calculated
from three times the standard deviation (σ) of 10 replicates of blank measurements, divided by the
slope of the calibration curve at the ppb level (3σ of the blank/slope).Chemosensors 2019, 7, 25 5 of 9
Chemosensors 2019, 7, x FOR PEER REVIEW 5 of 10
Figure 2. (a) Custom photo studio with 12 Volt LED lamps for appropriate lighting; (b) the result of the
Figure
digital image2. (a) Custom photo
at ppb-level studio
mercury with 12from
standards Volt0LED lamps
to 4 ppb; (c)for
theappropriate
color changelighting; (b) the
at the ppm level of
resultion
mercury of concentration
the digital image
fromat ppb-level
0 to 150 ppm.mercury standards
The volume of the from 0 to
sample in 4each
ppb; (c) thewas
cuvette color
1 mL.
change at the ppm level of mercury ion concentration from 0 to 150 ppm. The volume of the
Tablein
sample RGBcuvette
1.each color value
was and
1 mL.intensity of the mercury calibration curve at the ppb level.
Color Value Color Intensity
AsideHg(II) Concentration
from using the custom-made photo studio, cuvettes replaced vial bottles that
(ppb) methods as cuvettes
were used in previous R G a flat B
have R flat form
surface. The G of the container’s
B
surface is crucial0 in achieving 132 accurate 127 38.1 results
and precise 0 with digital
0 0
image-based
1 133 129 38.9 2.87 5.24 10.3
colorimetry. By using flat-surfaced cuvettes as sample containers, coupled with white LED
2 133 130 39.6 3.15 8.23 17.2
lamps from photo studio lighting, we could easily distinguish mercury concentration at the
3 134 132 40.3 6.39 17.0 24.7
ppb level as2019,
Chemosensors shown
7, 4 in PEER
x FOR Figure 2 and
134 Table132
REVIEW 1. The results
40.9 of 5.23
ppm-level14.9
plots are shown
31.7 6 of in
10
Figure S3. The intensity of the blue color increases linearly along with the increasing mercury
concentration from 1 to 4 ppb (Table 1 and Figure 3). Blue is the complementary color of the
yellowish brown color of AgNPs. Therefore, blue will have the best linearity and highest
slope. As a consequence, since red and green are not the complementary colors of AgNPs,
they will have poor linearity and slope. Thus, we only used blue intensity for further
calculation for our research. Using the optimized method, we were able to achieve a lower
detection limit—0.86 ppb—calculated from three times the standard deviation (σ) of 10
replicates of blank measurements, divided by the slope of the calibration curve at the ppb
level (3σ of the blank/slope).
Table 1. RGB color value and intensity of the mercury calibration curve at the ppb level.
Hg(II) Color Value Color Intensity
Concentration
R G B R G B
(ppb)
0 132 127 38.1 0 0 0
1 133 129 38.9 2.87 5.24 10.3
2 133 130 39.6 3.15 8.23 17.2
3 134 132 40.3 6.39 17.0 24.7
4
Figure 3. The cropped digital image of134 132
standard 40.9containing
solutions 5.231 to 4 14.9 31.7 ions, and the
ppb mercury
corresponding calibration
Figure 3. The croppedcurve with
digital blueof
image color as the solutions
standard complementary color1of
containing tothe yellowish
4 ppb mercurybrown
colorions,
of AgNPs that
and the gives the highest
corresponding slope. curve
calibration Error bars
withwere calculated
blue color as thefrom three replicates.
complementary color of
the yellowish brown color of AgNPs that gives the highest slope. Error bars were calculated
from three replicates.
As a means of increasing portability, we applied the method to the paper-based
analytical device (PAD) [33,34]. The PAD was built on a Whatman filter paper that has aFigure 3. The cropped digital image of standard solutions containing 1 to 4 ppb mercury
ions, and the corresponding calibration curve with blue color as the complementary color of
the yellowish brown color of AgNPs that gives the highest slope. Error bars were calculated
Chemosensors 2019,
from 7, 25replicates.
three 6 of 9
As a means of increasing portability, we applied the method to the paper-based
As a means of increasing portability, we applied the method to the paper-based analytical device
analytical device (PAD) [33,34]. The PAD was built on a Whatman filter paper that has a
(PAD) [33,34]. The PAD was built on a Whatman filter paper that has a good porosity for the movement
good porosity for the movement of the sample solution. Hydrophobic ink was used to fortify
of the sample solution. Hydrophobic ink was used to fortify the fluid and keep it in the reaction channel.
the fluid and keep it in the reaction channel. A permanent-ink marker was also used to make
A permanent-ink marker was also used to make the channel constraint line of the PAD better. After
the channel constraint line of the PAD better. After filter paper for the PAD was heated at
filter paper for the PAD was heated at 150 ◦ C for 5 min in an oven, the ink swelled and penetrated the
150 °C for 5 min in an oven, the ink swelled and penetrated the bottom of the paper, which
bottom of the paper, which aids in preventing the solution from leaking from the backside. The digital
aids in preventing the solution from leaking from the backside. The digital image file was
image file was then taken in a custom photo box using a smartphone. The actual photograph of the
then taken in a custom photo box using a smartphone. The actual photograph of the PAD,
PAD, with a diameter of 3 cm, is shown in Figure 4. The results of the PAD digital image processing
with a diameter of 3 cm, is shown in Figure 4. The results of the PAD digital image processing
were in accordance with those of cuvette digital image processing.
were in accordance with those of cuvette digital image processing.
Figure 4. Schematic of the paper-based analytical device (PAD) preparation and digital image acquisition
Figure 4.
for mercury ionSchematic of the As
determination. paper-based analytical sensor,
with the colorimetric device silver
(PAD)nanoparticles
preparation and
weredigital
embedded
image
on the PADacquisition for addition.
before sample mercury Each
ion determination. As with
piece of PAD paper the colorimetric
contains sensor,
standards and silver
a sample.
nanoparticles were embedded on the PAD before sample addition. Each piece of PAD paper
3.3. Recovery Experiments
contains standards and a sample.
To validate the proposed method, we conducted recovery experiments from real samples, which
have their own sample’s matrix, using the standard addition method and spiking the sample. River
water close to the effluent point of artisanal and small-scale gold mining in Bengkulu province was
chosen as the target sample. For the digital image-based colorimetry method, the mercury concentration
was determined from Blue color intensity by using the Lambert–Beer equation (Figure S4), following
the method in our previously published paper [8]. The results are shown in Table 2, using both the
liquid approach and the PAD, with ICP-OES as a reference method for the accuracy test. The accuracy,
calculated as the percent error of the proposed digital image-based colorimetry method, was less than
2.4%. The precision of the proposed method, calculated as the percent relative standard deviation
(RSD) from three replicate analyses, was better than 2.5%. Therefore, the accuracy and precision
were satisfactory.
Table 2. Recovery experiments of spiked river water samples (n = 3).
Digital Image-Based Colorimetry ICP-OES
Added Hg(II) (ppb) (ppb)
Found (ppb) Recovery (%)
0 81.7 ± 2.5 - 83.2
40 123 ± 3 101 126
80 160 ± 4 98.9 161
The high content of mercury ions in river water at the gold mining area (i.e., 81.7 ppb) shows that
the use of mercury for gold extraction contaminated the water body. The release of mercury into riverChemosensors 2019, 7, 25 7 of 9
water will pollute freshwater biota that in turn will endanger humans themselves, as a result of mercury
bioaccumulation in fish. A more detailed discussion on this matter will be published elsewhere.
4. Conclusions
In the current digital era, one of the most affordable and straightforward quantitative methods is to
monitor the color change of an analyte of interest using a ubiquitous smartphone. Modern smartphones
mostly have a good quality camera with high resolution. In our research, we used a built-in smartphone
camera and a smartphone application for processing the primary color input, as red-green-blue (RGB)
channels, in order to analyze mercury ion concentration. Decent ambiance lighting is crucial to obtain
accurate, precise and sensitive results. In addition, the flat surface of cuvettes used as the sample
containers gave better results compared to the round-surfaced sample containers (e.g., vial bottles).
By combining the digital image-based colorimetry with paper-based analytical devices and using
a smartphone as a detector, we achieved better portability and sensitivity with good accuracy and
precision. The proposed method assures a simple, low-cost, green and portable analytical method for
mercury ion quantification that can be used in a remote area with limited resources.
Supplementary Materials: The following are available online at http://www.mdpi.com/2227-9040/7/2/25/s1,
Figure S1: Examples of application appearance in Google Play Store and its corresponding android studio coding,
Figure S2: Color stability of the synthesized AgNPs through time. The synthesized AgNPs were stable for 30 days
and started to aggregated at days 45 and on, as shown from the decrease of peak absorbance, Figure S3: The plot
of absorbance from spectrophotometer (upper) and its corresponding Blue intensity from digital image (below) of
ppm-level mercury addition into AgNPs. Decreasing and gradual broadening on the absorbance of the surface
plasmon resonance band, known as Mie blue shift, were noticed during successive addition of mercury ions into
silver nanoparticles along with a blue shift from 420 nm for initial AgNPs to 360 nm upon addition of mercury
ions. At high concentrations (ppm-level), analysis can be carried out both by spectrophotometry and by the
digital image colorimetry as shown on the calibration curve below. At low concentration (ppb-level); however,
analysis of mercury ions using spectrophotometry is impossible due to the visually similar color of the samples
that produce very poor calibration curve on absorbance. Therefore, mercury at ppb-level was detected using
digital image-based colorimetry, Figure S4: The actual photograph of PAD-based colorimetry together with its
RGB value and Lambert-Beer logarithmic converted RGB intensity. The RGB color value was extracted from
the digital image containing ppb-level standards (1–4 ppb). The other two chambers were used for samples.
Coresponding calibration curve for this ppb-level mercury standards is also shown.
Author Contributions: This paper was prepared through the contributions of all authors. M.L.F. designed and
performed the experiment, wrote the initial manuscript and secured the research funding. A.A., N.M. and M.H.
performed the experiment. R.E., L.R. and R.K. contributed to the final manuscript preparation.
Funding: This research was funded by the Indonesian Ministry of Research, Technology and Higher Education,
grant numbers 053/SP2H/LT/DRPM/IV/2019 and PKM-PIMNAS 2018.
Acknowledgments: The authors acknowledge Dita Retnowati for developing the first version of the smartphone
application and Hendry Nordan for the river water sampling and treatment.
Conflicts of Interest: The authors declare no conflict of interest. The funders had no role in the design of the
study; in the collection, analyses, or interpretation of data; in the writing of the manuscript, or in the decision to
publish the results.
References
1. Castilhos, Z.C.; Rodrigues-Filho, S.; Rodrigues, A.P.C.; Villas-Bôas, R.C.; Siegel, S.; Veiga, M.M.; Beinhoff, C.
Mercury contamination in fish from gold mining areas in Indonesia and human health risk assessment.
Sci. Total Environ. 2006, 368, 320–325. [CrossRef] [PubMed]
2. Tomiyasu, T.; Kono, Y.; Kodamatani, H.; Hidayati, N.; Rahajoe, J.S. The distribution of mercury around the
small-scale gold mining area along the Cikaniki river, Bogor, Indonesia. Environ. Res. 2013, 125, 12–19.
[CrossRef] [PubMed]
3. Jarup, L. Hazards of heavy metal contamination. Br. Med. Bull. 2003, 68, 167–182. [CrossRef]
4. Clarkson, T.W.; Magos, L.; Myers, G.J. The Toxicology of Mercury—Current Exposures and Clinical
Manifestations. N. Engl. J. Med. 2003, 349, 1731–1737. [CrossRef] [PubMed]Chemosensors 2019, 7, 25 8 of 9
5. Khaydarov, R.R.; Khaydarov, R.A.; Gapurova, O.; Garipov, I.; Firdaus, M.L. Silver Nanoparticles as a Biocide
for Water Treatment Applications. In Advanced Research in Nanosciences for Water Technology; Springer: Berlin,
Germany, 2019; pp. 407–419.
6. El-Safty, S.A.; Shenashen, M.A.; El-Safty, S.A. Mercury-ion optical sensors. TrAC—Trends Anal. Chem. 2012,
38, 98–115. [CrossRef]
7. Hong, Y.; Kim, Y.; Lee, K. Methylmercury Exposure and Health Effects. J. Prev. Med. Public Health 2012, 45,
353–363. [CrossRef]
8. Firdaus, M.L.; Alwi, W.; Trinoveldi, F.; Rahayu, I.; Rahmidar, L.; Warsito, K. Determination of Chromium
and Iron Using Digital Image-based Colorimetry. Procedia Environ. Sci. 2014, 20, 298–304. [CrossRef]
9. Masawat, P.; Harfield, A.; Srihirun, N.; Namwong, A. Green Determination of Total Iron in Water by Digital
Image Colorimetry. Anal. Lett. 2017, 50, 173–185. [CrossRef]
10. Puchum, S.; Meelapsom, R.; Muniandy, S.S. Use of unmodified silver nanoparticles (AgNPs) as colorimetric
Hg (II) sensor: A new approach to sensitive and high sample throughput determination of Hg (II) under
high influence of ionic suppression. Int. J. Environ. Anal. Chem. 2019, 99, 1–18. [CrossRef]
11. Salcedo, A.R.M.; Sevilla, F.B. Colorimetric determination of mercury vapor using smartphone camera-based
imaging. Instrum. Sci. Technol. 2018, 46, 450–462. [CrossRef]
12. Choodum, A.; Boonsamran, P.; Nicdaeid, N.; Wongniramaikul, W. On-site semi-quantitative analysis for
ammonium nitrate detection using digital image colourimetry. Sci. Justice 2015, 55, 437–445. [CrossRef]
[PubMed]
13. David, T.; Grandivoriana, N.A.; Fidelis, N. Digital-Based Image Detection System in Simple Silver
Nanoparticles-based Cyanide Assays. Res. J. Chem. Environ. 2018, 22, 10–14.
14. Choodum, A.; Parabun, K.; Klawach, N.; Daeid, N.N.; Kanatharana, P.; Wongniramaikul, W. Real time
quantitative colourimetric test for methamphetamine detection using digital and mobile phone technology.
Forensic Sci. Int. 2014, 235, 8–13. [CrossRef] [PubMed]
15. Wongniramaikul, W.; Limsakul, W.; Choodum, A. A biodegradable colorimetric film for rapid low-cost field
determination of formaldehyde contamination by digital image colorimetry. Food Chem. 2018, 249, 154–161.
[CrossRef]
16. Tambaru, D.; Rupilu, R.H.; Nitti, F.; Gauru, I.; Suwari. Development of Paper-Based Sensor Coupled with
Smartphone Detector for Simple Creatinine Determination. In AIP Conference Proceedings; AIP Publishing:
College Park, MD, USA, 2017; p. 0200951.
17. Priye, A.; Ball, C.S.; Meagher, R.J. Colorimetric-Luminance Readout for Quantitative Analysis of Fluorescence
Signals with a Smartphone CMOS Sensor. Anal. Chem. 2018, 90, 12385–12389. [CrossRef]
18. Fatoni, A.; Numnuam, A.; Kanatharana, P.; Limbut, W.; Thammakhet, C.; Thavarungkul, P. A highly stable
oxygen-independent glucose biosensor based on a chitosan-albumin cryogel incorporated with carbon
nanotubes and ferrocene. Sens. Actuators B Chem. 2013, 185, 725–734. [CrossRef]
19. Shen, L.; Hagen, J.A.; Papautsky, I. Point-of-care colorimetric detection with a smartphone. Lab Chi 2012, 12,
4240–4243. [CrossRef]
20. Priye, A.; Bird, S.W.; Light, Y.K.; Ball, C.S.; Negrete, O.A.; Meagher, R.J. A smartphone-based diagnostic
platform for rapid detection of Zika, chikungunya, and dengue viruses. Sci. Rep. 2017, 7, 44778. [CrossRef]
[PubMed]
21. Firdaus, M.L.; Puspita, M.; Alwi, W.; Ghufira; Nurhamidah; Elvia, R. Dyes Removal Using Activated Carbon
from Palm Oil Waste with Digital Image Colorimetry Quantification. In AIP Conference Proceedings; AIP
Publishing: College Park, MD, USA, 2017; p. 0200661.
22. Chansuvarn, W.; Tuntulani, T.; Imyim, A. Colorimetric detection of mercury(II) based on gold nanoparticles,
fluorescent gold nanoclusters and other gold-based nanomaterials. TrAC—Trends Anal. Chem. 2015, 65,
83–96. [CrossRef]
23. Firdaus, M.; Andriana, S.; Alwi, W.; Swistoro, E.; Ruyani, A.; Sundaryono, A. Green synthesis of silver
nanoparticles using Carica Papaya fruit extract under sunlight irradiation and their colorimetric detection of
mercury ions. J. Phys. Conf. Ser. 2017, 817, 012029. [CrossRef]
24. Xu, H.; Wang, Y.; Huang, X.; Li, Y.; Zhang, H.; Zhong, X. Hg2+ -mediated aggregation of gold nanoparticles
for colorimetric screening of biothiols. Analyst 2012, 137, 924–931. [CrossRef]Chemosensors 2019, 7, 25 9 of 9
25. Maity, D.; Kumar, A.; Gunupuru, R.; Paul, P. Colloids and Surfaces A: Physicochemical and Engineering
Aspects Colorimetric detection of mercury (II) in aqueous media with high selectivity using calixarene
functionalized gold nanoparticles. Colloids Surf. A Physicochem. Eng. Asp. 2014, 455, 122–128. [CrossRef]
26. Firdaus, M.L.; Fitriani, I.; Wyantuti, S.; Hartati, Y.W.; Khaydarov, R.; McAlister, J.A.; Obata, H.; Gamo, T.
Colorimetric Detection of Mercury (II) Ion in Aqueous Solution Using Silver Nanoparticles. Anal. Sci. 2017,
33, 831–837. [CrossRef]
27. Qin, Y.; Ji, X.; Jing, J.; Liu, H.; Wu, H.; Yang, W. Size control over spherical silver nanoparticles by ascorbic
acid reduction. Colloids Surf. A Physicochem. Eng. Asp. 2010, 372, 172–176. [CrossRef]
28. Firdaus, M.L.; Krisnanto, N.; Alwi, W.; Muhammad, R.; Allan, M. Adsorption of Textile Dye by Activated
Carbon Made from Rice Straw and Oil Palm Midrib. Aceh Int. J. Sci. Technol. 2017, 7, 1–7. [CrossRef]
29. Firdaus, M.L.; Susanti, E.; Ghufira; Alwi, W.; Swistoro, E. Isotherm, kinetics and thermodynamics of synthetic
dyes adsorption onto activated charcoal made from oil palm midrib. Rasayan J. Chem. 2018, 11, 1532–1536.
[CrossRef]
30. Firdaus, M.L.; Juwita, M.; Ibrahim, P.R.; Rakhmawaty, E.D.; Iman, R. Biosynthesis of Silver Nanoparticles
using Jicama Extract and Its Application for Colorimetric Sensing of Mercury Ions. Res. J. Chem. Environ.
2018, 22, 1–3.
31. Gray, J.E.; Theodorakos, P.M.; Fey, D.L.; Krabbenhoft, D.P. Mercury concentrations and distribution in soil,
water, mine waste leachates, and air in and around mercury mines in the Big Bend region, Texas, USA.
Environ. Geochem. Health 2014, 37, 35–48. [CrossRef] [PubMed]
32. Du, J.; Jiang, L.; Shao, Q.; Liu, X.; Marks, R.S.; Ma, J.; Chen, X. Colorimetric detection of mercury ions based
on plasmonic nanoparticles. Small 2013, 9, 1467–1481. [CrossRef] [PubMed]
33. Wang, X.; Zhang, Q.; Nam, C.; Hickner, M.; Mahoney, M.; Meyerhoff, M.E. Ionophore-based anion-selective
optode printed on cellulose paper. Angew. Chem. Int. Ed. 2017, 56, 11826–11830. [CrossRef] [PubMed]
34. Tenda, K.; van Gerven, B.; Arts, R.; Hiruta, Y.; Merkx, M.; Citterio, D. Paper-Based Antibody Detection
Devices Using Bioluminescent BRET-Switching Sensor Proteins. Angew. Chem. 2018, 130, 15595–15599.
[CrossRef]
© 2019 by the authors. Licensee MDPI, Basel, Switzerland. This article is an open access
article distributed under the terms and conditions of the Creative Commons Attribution
(CC BY) license (http://creativecommons.org/licenses/by/4.0/).You can also read