Social and Behavioral Theories and Physician's Prescription Behavior - MDPI
←
→
Page content transcription
If your browser does not render page correctly, please read the page content below
sustainability

Article
Social and Behavioral Theories and Physician’s
Prescription Behavior
Rizwan Raheem Ahmed 1, * , Dalia Streimikiene 2, * , Josef Abrhám 3 , Justas Streimikis 4,5 and
Jolita Vveinhardt 6
 1    Faculty of Management Sciences, Indus University, Gulshan-17, Karachi 75300, Pakistan
 2    Institute for sport science and innovation, Lithuanian Sports University, Sporto g. 6, 44221 Kaunas, Lithuania
 3    Department of Trade and Finance, Faculty of Economics and Management, Czech University of Life Sciences
      Prague, Praha-Suchdol, 16500 Prague, Czech Republic; abrhamj@pef.czu.cz
 4    Lithuanian Institute of Agrarian Economics, A. Vivulskio g. 4A-13, 03220 Vilnius, Lithuania;
      justas.streimikis@gmail.com
 5    Faculty of Management and Finance, University of Economics and Human Science in Warsaw, Okopowa 59,
      01-043 Warsaw, Poland
 6    Faculty of Economics and Management, Vytautas Magnus University, K. Donelaičio str. 58,
      44248 Kaunas, Lithuania; Jolita.Vveinhardt@gmail.com
 *    Correspondence: rizwanraheemahmed@gmail.com (R.R.A.); dalia.streimikiene@lei.lt or
      dalia.streimikiene@lsu.lt (D.S.)

 Received: 27 February 2020; Accepted: 14 April 2020; Published: 21 April 2020

 Abstract: The efficacy, safety, and cost of medication are the major concerns for a patient; thus, this
 research addresses factors that influence the physician’s prescription behavior. The objective of the
 undertaken study is the empirical testing of a novel conceptual model that was newly developed
 by the previous literature, which is based on behavioral and social theories. The considered model
 explains the association between marketing efforts, pharmacist factors, patient characteristics, and
 the physician’s decision to prescribe a drug. This unique model also includes the influence of cost
 and benefit ratio, drug characteristics, physician’s persistence, and trustworthiness as moderating
 variables. This model is useful for analyzing the prospects of marketing. We have collected 984
 physicians’ responses from the urban centers of Pakistan through a structured questionnaire. We
 have used Structural equation modelling (SEM) based multivariate techniques such as exploratory
 and confirmatory factor analysis, and conditional process modelling to explore the direct and indirect
 relationship amongst the exogenous, moderating, and endogenous variables. The findings of the study
 demonstrated that marketing efforts, patient’s characteristics, and pharmacist factors have a positive
 and significant influence on the physician’s decision to prescribe medicines. The moderation analysis
 exhibited the significant effect of drug characteristics, cost–benefit ratio, physician’s persistence, and
 trustworthiness in a relationship between exogenous and endogenous variables. The results of the
 undertaken study are helpful for the marketers of the pharmaceutical industry to save wasteful
 marketing expenditures for the product portfolios, and measured variables may help to make
 meaningful marketing strategies for the physician’s prescription that provide optimum Returns on
 Investment (ROI) of their investments.

 Keywords: social and behavioral theories; physician’s prescription behavior; marketing efforts;
 patient and drug characteristics; SEM-based multivariate approach; physician’s persistence;
 pharmaceutical industry

Sustainability 2020, 12, 3379; doi:10.3390/su12083379                           www.mdpi.com/journal/sustainability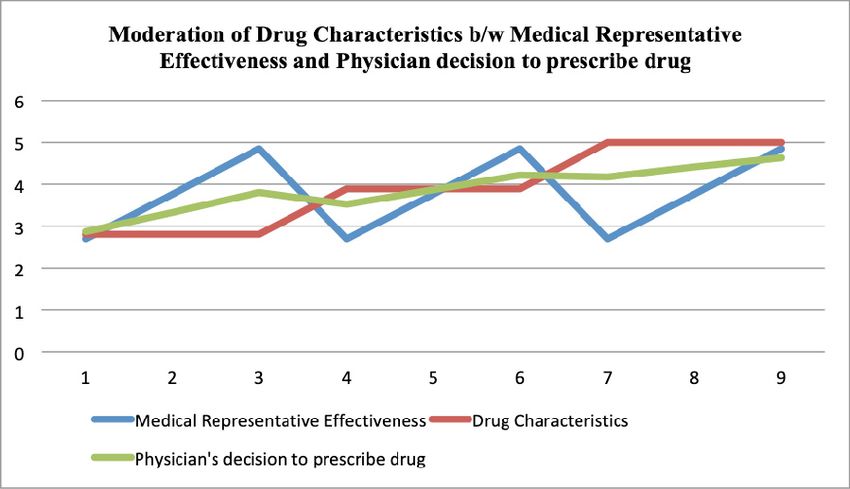
Sustainability 2020, 12, 3379                                                                         2 of 25

1. Introduction
      Pharmaceutical marketing has the same objectives as other industries to enhance the profitability
and market share of the organization by fulfilling the needs and demands of the customers taking into
account the preferable consideration of products. Other than the pharmaceutical industry, it is very easy
to disseminate the marketing message to the end-users through above the line (ATL) and below the line
(BTL) media communication strategies. However, in the pharmaceutical industry, the consumers are
not the customer of the pharmaceutical industry; rather, the doctor community is the prime customer for
the pharmaceutical companies [1,2]. Since the pharmaceutical industry is highly regulated, companies
cannot advertise their drugs through electronic and print media channels. Pharmaceutical marketing
is quite different as compared to the other industries where the consumer (patient) is not the direct
customer of the pharmaceutical industry, however a doctor is the customer of the pharmaceutical
industry and the patient is a customer of a doctor. Therefore, pharmaceutical companies target the
physicians, and physicians decide to prescribe a certain medicine; thus, in pharmaceutical marketing,
strategies are devised for the doctors, not for the patient. According to Campbell et al. [3], Moynihan [4],
and Ahmed et al. [5], the relationship between pharmaceutical companies and doctors has gained
considerable attention that originates from a conflict between the doctor’s financial self-interest and
the ethical professional interest. The pharmaceutical companies market their drugs through diverse
marketing and promotional activities such as free sampling to the doctors, expensive and inexpensive
gifts to the doctors, sponsored lecture/symposia for individual doctors and hospitals, sponsoring
physicians in national and international conferences, medical detailing, and sponsorship of continuing
medical educations (CMEs) for individual doctors. Thus, these marketing activities exert a significant
impact on the prescription behavior of physicians, and doctors prescribe their medicine without a
due cost and benefit analysis (side effects vs. cure effects) [6,7]. However, few studies demonstrated
that the marketing activities of the pharmaceutical industry do not influence the majority of doctors;
instead, doctors prescribe medicines on the merit of the drug [7–9]. However, a substantial amount
of literature has confirmed the influential effect of pharmaceutical marketing activities, which has a
positive and significant on physician’s prescription behavior [9,10]. Besides the increasing trend of
pharmaceutical marketing expenditure, another important concern is the inappropriate, expensive,
irrational, and harmful drugs’ prescription. According to Hogerzeil [10] and Carthy et al. [11], this
matter is two exhibitions; on the one hand, unnecessary and ineligible medicine are being prescribed
to the patient, and on other hand, there are ample shreds of evidence of the prescribed drug being
useless or misuse of medicines. The outcome of this misuse of drugs may result in the loss of health,
loss of quality of life of the patient, and enhances the medical and healthcare expenditure, thus it is
important to follow the prescription guidelines for prescription medicines [5,12].
      Thus, in this context, there is a strong need to evaluate factors that alter or change the physician’s
prescription decisions. Numerous medical pieces of literature concern the influential factor of
physician’s prescription decisions, which demonstrates that few factors are fixed and cannot be
changed or modified; however, several factors have a significant role to influence the physician’s
prescription decisions [13,14]. Most of the literature considers the empirical analysis only. To date,
literature regarding the physician’s decision-making process lacks the sound theoretical foundations [15],
as most studies have been based on an exploratory approach, and did not address the theoretical
approach for the decision-making process of physicians regarding the selection and prescription
of a drug [7,16,17]. However, few research studies have incorporated different theoretical model
to understand decision-making processes such as attitude–behavior models including the planned
behavior theory (TPB) and the reasoned action theory [18–24]. The main intention is to understand
the rationale in the decision making of an individual through these theories; thus, the cognitive
method can elucidate the individuals’ behavior. According to Raisch [22], the cognitive models may
address the physician’s decision-making process, however Godin et al. [19] and Lee and Yun [25] have
demonstrated that the theory of planned behavior (TPB) has several drawbacks, and the TPB does
not take into account the emotional approach of an individual. In the same vein, Conner et al. [26]
Sustainability 2020, 12, 3379                                                                          3 of 25

have recommended including the emotional variables to modify the behavioral theories. The impact
of social media on emotions was studied in terms of technology acceptance [27].
      According to Theodorou et al. [15] and Prosser et al. [28], the decision of the physician’s prescription
is a multifaceted procedure, which encompasses several variables. Raisch [22] and Schommer and
Hansen [29] have demonstrated that physicians take into account several factors while deciding to
prescribe a drug and numerous sorts of precarious heuristics in performing their responsibilities
of patient treatment. According to Reyna and Rivers [30], there are several factors that have been
narrated regarding the physician’s decision-making process in previous literature, but according to the
literature, any single theory cannot explain the factors about the physician’s prescription behavior.
Thus, the multifaceted model of theories is employed to comprehend the influencing variables for the
decision-making process of physicians [19]. The current studies demonstrated a lack of agreement
amongst the researchers regarding the use of theories to examine the physician’s prescription behavior
and its determinants for the decision-making process [31–33]. According to the existing literature, the
important factors include patient characteristics (expectations and requests), and marketing efforts of
pharmaceutical companies. The pharmacist factor (pharmacist expert power and pharmacist–physician
collaboration) has also been recognized as a cogent element for physician’s decision-making process for
the responsible prescription behavior [34–37]. However, there is a need to understand these factors and
approaches in a conclusive conceptual framework for the decision-making process of the physician’s
decision to prescribe a drug [19,38].
      The development of the theoretical model is important to address the comprehensiveness of the
decision-making process of physicians, regarding any prescription pattern across the globe [20,39,40].
For the development of a theoretical model, some research studies have been carried out such as those
by Howie [14], Raisch [22], Hemminki [23], and Knapp and Oeltjen [41], but most of them are outdated.
Therefore, there is a need to address more theoretical research studies to comprehend the physician’s
decision-making process. Thus, Murshid and Mohaidin [42] have carried out important research to
develop a conceptual framework to understand the physician’s decision-making process regarding
responsible prescription behavior towards medicines. However, there is no empirical evidence for
the effectiveness of that theoretical framework. Thus, the undertaken study is an attempt to confirm
the complex conceptual framework, which was developed by the Murshid and Mohaidin [42]. The
previous literature assessed the behavioral and social theories such as a theory of planned behavior
(TPB), agency theory, the theory of social power, theory of stimulus–response behavior, and persuasion
theory to ascertain the influence of marketing efforts, pharmacist factors, and patient characteristics on
the physician’s prescription behavior. Hence, these social and behavioral theories and models were
studied to comprehend the significant factors, which determine and develop the innovative conceptual
paradigm to influence the physician’s prescription behavior [22,42].
      This research is a shred of conclusive evidence for practical implications of that complex theoretical
framework. Hence, this research fills the gap to employ an integrated theoretical model and to examine
the practicality of this multi-dimensional theoretical model to assess the factors that contribute to
reshaping the physician’s decision-making process regarding prescription behavior. This model used
the theory of planned behavior (TPB) and agency theories that elucidate the twofold function of the
doctor as an intermediary and customer. The TPB model is very much linked to the physician as an
intermediary in a clinical environment [19,43]. The stimulus–response theory and persuasion theory
have been demonstrated the role of pharmaceutical marketing efforts in reshaping the behavior of the
physician to prescribe the drug [42]. However, in this model, the social power theory is used in the
context of the influential effects of pharmacist factors [42].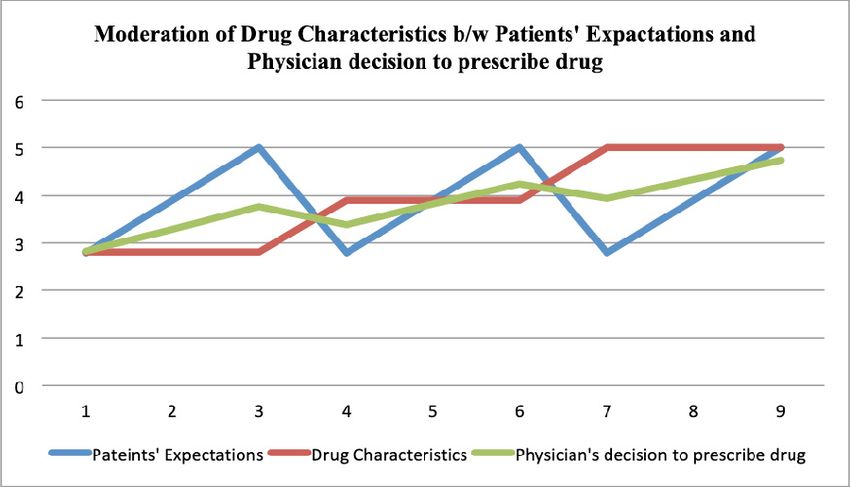
Sustainability 2020, 12, 3379                                                                         4 of 25

      The rest of the paper is comprised of several sections, such as: (1) Section 2 deals with previous
literature and conceptual framework; (2) Section 3 contains the material and methods: (3) Section 4
demonstrates the results and findings; (4) Section 5 is comprised of the discussion; and (5) Section 6
contains the conclusions, followed by the practical implications, limitations, and future areas of
research studies.

2. Previous Literature and Conceptual Framework
     According to previous literature, multiple factors influence the physician’s prescription behavior
towards the drugs. Murshid and Mohaidin [42] and Hartzema et al. [44] have demonstrated that
non-medical factors are significant predictors to influence the physician’s prescription behavior.
However, Armstrong et al. [45] have revealed that senior doctors’ prescription patterns can influence
the behavior of general practitioners’ prescription habits. According to Kareem et al. [46], tangible
rewards used by the pharmaceutical companies as promotion tactics and frequent visits to medical
representatives significantly increase the prescription loyalty of physicians. Though Rahmner et al. [47]
have identified new dimensions for influencing physician’s prescription behavior such as the
physician–patient relationship, Taneja [48] has exhibited that private doctors are more attracted towards
the personalized activities and promotional tools, whereas the hospital’s associated physicians are
attracted towards the scientific activities. According to Tan et al. [49], family physicians give more weight
to the promotional activities than the detailing and CMEs programs; however, Theodorou et al. [15] have
demonstrated that clinical effectiveness of the drugs is the major criteria for the physician’s prescription
behavior. According to Kotwani et al. [36], sales calls of Medical Representatives (MRs) exert a cogent
influence on the physician’s prescription behavior; however, Karayanni [50] has concluded that the
personal obligation is a major factor to influence physician’s prescription behavior. Several research
studies have investigated that trust and quality of the drug, effective marketing communication, MRs
effectiveness, cost of the drug, and corporate image of pharmaceutical companies are the significant
factors to influence the physician’s prescription behavior [5,47,51,52]. According to Wazana [53],
Prosser and Walley [54], and Caudil et al. [55], the interaction between doctors and pharmaceutical
companies starts at the beginning of their careers, thus customer relationship employs a significant part
in reshaping the responsible prescription behavior of physicians. However, Lieb and Brandtönies [56],
Chimonas et al. [57], Saito et al. [58], and Watkins et al. [59] examine the pharmaceutical sales
representatives’ (PSRs) association with the doctors, and effectiveness of PSRs, and concluded the
major factors to influence the physician’s prescription behavior. Numerous studies have examined
the impact of marketing tools and established a positive correlation with the prescription behavior of
physicians [9,60,61].

2.1. Theories Relevant to Factors Influencing the Prescribing Decision
     Besides the marketing and medical tools, previous literature also studied the link of these
factors with different theories and models to influence the physician’s prescription behavior towards
medicines, thus the literature has provided the theoretical and conceptual foundation to the elements
that influence the responsible prescription behavior. Therefore, the previous literature assessed the
behavioral and social theories such as a theory of planned behavior (TPB), agency theory, the theory of
social power, theory of stimulus–response behavior, and persuasion theory to ascertain the influence
of marketing efforts, pharmacist factors, and patient characteristics on the physician’s prescription
behavior. Hence, these social and behavioral theories and models were studied to comprehend the
significant factors, which determine and develop the innovative conceptual paradigm to influence the
physician’s prescription behavior [22,42,62].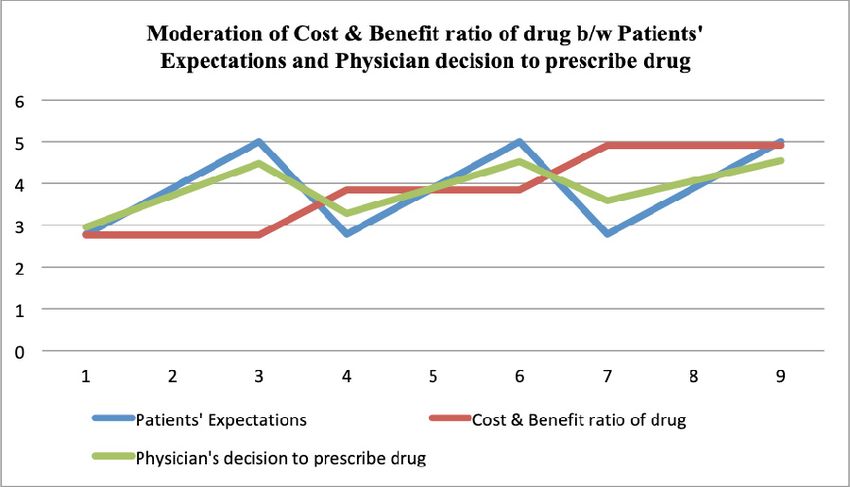
Sustainability 2020, 12, 3379                                                                       5 of 25

2.1.1. Agency Theory
      Jansen and Meckling [63] have introduced the concept of agency theory, and Shapiro [62] has
introduced the different objectives of this theory. However, Eisenhardt [64] has reviewed the context,
concept, and different principles of agency theory, and he established that this theory offers a framework
for examining the relationship between impartial to analyze the problem, which exists between two
parties and instrument to resolve it. According to Eisenhardt [64] and Mott et al. [65], in agency
theory, the association happens when the patient (first party) believes physician (second party) to
accomplish certain activities on behalf of the client (the pharmaceutical company). Thus, based on
this approach, the pharmaceutical company is motivated to sell its drugs by using different marketing
and branding efforts and provide necessary prescribing information to the physician to prescribe
the drugs. During the pharmaceutical and physician relationship, various environmental elements
may have little control over the cost and benefit (side effects vs. cure effects) ratio of a drug, and
persistence of physicians [43]. Though in the physician and patient’s relationship, the patient entirely
relies on the expert power of physician for diagnosis and prescription [29]. However, Epstein and
Ketcham [66] exhibited that the patient is interested in cost-effective and appropriate treatment in terms
of a physician’s prescription. According to Groves [43], the physician’s decision to prescribe a certain
drug is based on several influencing factors that the patient has little control over such as physician’s
persistence, drug characteristics, and cost/benefit (side effects vs. cure effects) of the medicine. The
physician–patient relationship is further strengthened when the doctor fulfils the patients’ requests
and expectations for a certain drug [37,66].

2.1.2. Theory of Persuasion
     Persuasion is a successful attempt to influence the decision-making process of an individual;
persuasion is an art of changing the principles, philosophies, and behavior through effective
communication [29,67]. Persuasion is comprised of cognition and emotional responses, and the
interaction of emotion and cognition can change the physician’s behavior regarding a certain drug
prescriptions. The process of persuasion consists of four elements, for instance, (1) sender information
(medical representatives of pharmaceutical firm), (2) the physician (a receiver), (3) the interchange
between receiver and sender (medical Representative and physician), and (4) the alteration in behavior
(the physician’s prescription behavior). According to Bettinghaus [68], the persuasion instructs an
individuals’ behavior (doctors’ prescription behavior) voluntarily in reaction to a specific stimulus,
which alters the mind. According to Storey [69], the change of mind is associated with the particular
desires of an individual (physician), for instance, prescriptions required for his/her patient, such
changes might be accomplished immediately (prescription decision) or sometimes it requires several
months or years. The previous literature demonstrated that the persuasion theory is used to enhance
the physician’s prescribing behavior through effective pharmaceutical marketing and activities [22,29].
According to O’keefe [67] and Petty and Cacioppo [70], the elaboration likelihood model (ELM), which
is widely employed in the model in persuasion theory’s perspective, suggests that the individual (the
physician) uses both emotional and cognitive abilities and reactions to deduce data for decision-making.
The influencing factors for physician’s prescription behavior include a personal relationship with the
pharmacist and medical representatives, environmental stimuli (patient and pharmacist), marketing
stimuli (brand name of a drug such as famous brands of multinational companies, for example Amoxil,
Lipitor, Zocor, Augmentin, etc., in comparisons of local companies brands), sales promotion, drug
information such as prescribing information of medicine such as dosage, indications, side effects, etc.,
drug characteristics, and physician’s characteristics (habit persistence) towards the medicines.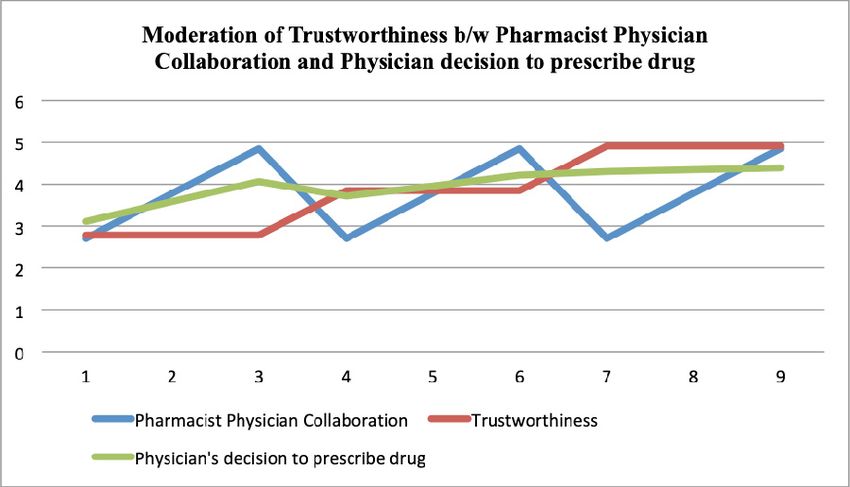
Sustainability 2020, 12, 3379                                                                          6 of 25

2.1.3. The Buyer Behaviour—Stimulus–Response (SR) Theory
     Both buying behavior models such as the stimulus–response (SR) model and elaboration likelihood
model (ELM) are similar because both consider emotions and cognizance to influence the individual.
Xing and Othman [71] conclude that the SR model is linked to the black box model in which emphasis
is not on the process, instead it deals with the relationship between the stimuli and the consequential
reaction. However, original communication inferred from this model is the procedure of physician’s
awareness from the outward stimuli for the prescription decision towards medicines. Similar to a
consumer, the physician is faced with numerous influences that may reshape his/her prescription
behavior; the SR model offers a combined stimulus with appropriate modification. The pharmaceutical
companies generate different stimuli through marketing mix factors, which influence the physician’s
intention to prescribe a drug; these stimuli trespass into the black box of a doctor and ultimately
translate into influences. According to Kotler [72], it comprises two elements; firstly, physician
characteristics influence the way in which stimuli are perceived, imagined, and translated through
the marketers, and such features of a physician can be accredited to secretive factors, for instance
psychological and social variables. However, secondly, the process of decision making of the physician
eventually defines the physician’s prescription behavior [73].

2.1.4. Theory of Planned Behavior (TPB)
     According to Eccles et al. [74], the theory of planned behavior (TPB) is one of the most applicable
and repeatedly employed behavioral theories to understand the responsible prescription behavior
of physicians. Ponnet et al. [18], Godin et al. [19], Perkins et al. [75], and Kramer et al. [76] have
successfully used TPB theory to comprehend the underlying factors for prescribing behavior of doctors
in different specialties. The literature is based on the TPB model of Ajzen [24] that explains and
examines the personal norms’ capability, attitude, and a device of perceived behavioral force that
changes the intentions and responsible prescription behavior of physicians. The degree that the
doctor is favorable or unfavorable depends on their attitude towards the marketing efforts and other
factors such as availability of drug information (prescribing information of medicine such as dosage,
indications, side effects, etc.), sales promotion, medical representatives’ effectiveness, and brand name
of a drug (famous brands of multinational companies such as Amoxil, Lipitor, Zocor, Augmentin, etc.
in comparison to local companies brands) [42]. The second element of the TPB theory concerning
subjective norms measures the influencing pressure of patients’ demand for a certain drug, expectations
of patients, pharmacists’ expert power, and pharmacist and physician collaboration for the prescription
of a certain drug. However, the third factor of the TPB theory deals with the perceived behavioral
control that is a function of behavior, which suggests experience or product knowledge that deals
with future problems. Thus, perceived behavioral control (PBC) directly influences the physician’s
responsible prescription behavior because of the first-hand experience of a physician [24]. However,
drug characteristics, physician’s persistence, cost/benefit ratio (side effects vs. cure effects) of the drug,
and trustworthiness of physicians on the expert power of pharmacist are contextual factors, which
influence the physician’s responsible prescription behavior [42].

2.1.5. Theory of Social Power (TSP)
      According to Basak et al. [77], in the healthcare context, there will always be cooperation and
communication amongst team members, which will usually have an effect due to the social power of
team members. For understanding the crucial role of the pharmacist, the social power theory is the best
application; the power is expressed as the ability to influence. However, the social power is the ability
to influence the behavior of someone else through persuasion, which in the healthcare context concerns
the role of an individual to have a significant influence on team members to alter their behavior [77–79].
However, expert power refers to the knowledge, work experience, and skills of an individual that are
mostly based on intensive education and work experience, and credentials of an individual. Thus, in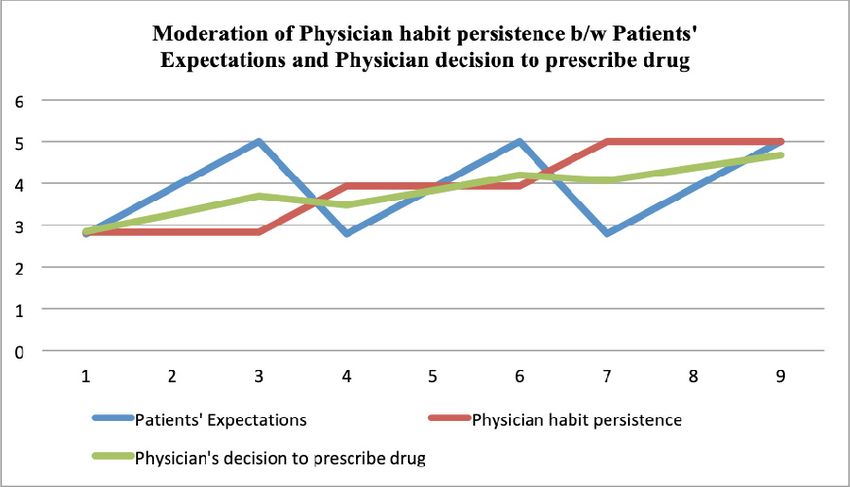
Sustainability 2020, 12, 3379                                                                       7 of 25

the context of healthcare, pharmacists’ expert power influences the physician’s prescription intentions
due to their intensive education and working experience, and physicians rely on the recommendations
of a pharmacist [78,80]. The power and influence are the two significant components of the theory of
social power, following the control relational theory, the pharmacist and physician collaboration, the
pharmacist education, and experience, which drive the responsible prescription behavior of physicians
by providing information, indications, advice, and safety profile regarding the drug. On the other
hand, the literature exhibited that trustworthiness is the moderating factor in a relationship between
pharmacist factors and physician’s prescription behavior [42,78].
      As shown in Figure 1, 13 causal factors are classified and merged; this novel model consists of
marketing efforts, patients’ characteristics, and pharmacist factors as direct influencers. However,
trustworthiness has been used as a moderating variable in a relationship between pharmacist factors
and physician’s decision to prescribe drugs [42,80]. Moreover, the suggested model assimilates several
features of seven recognized conceptual models; thus, the undertaken research is an empirical effort to
examine the physician’s decision to prescribe the drug based on different theories and models, which
were discussed earlier. This research also evaluates or empirically tests previously featured models and
theories that were demonstrated in several research studies [19,23,39,41,42]. The undertaken research
aims to empirically examine the theoretical framework in the context of the Pakistani healthcare sector;
thus, the results of this study provide new aspects that influence the physician’s prescription behavior.
Hence, this study will also be beneficial to the marketers of the pharmaceutical industry to develop
effective   and
Sustainability    efficient
               2020,         marketing
                     12, x FOR          strategies to get maximum ROI of their investments.
                               PEER REVIEW                                                         9 of 27

                                Figure 1. Theoretical and conceptual model of the study [42].

3. Material and Methods

3.1. Research Design and Measurement Scales
      The research design of this research is cross-sectional and quantitative; we employed a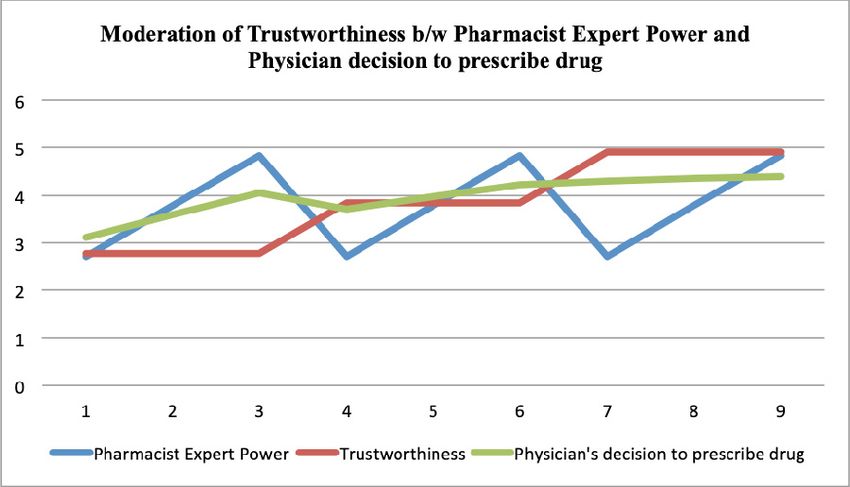
Sustainability 2020, 12, 3379                                                                               8 of 25

2.2. Hypotheses Formulation
    Thus, based on previous literature about the social and behavioral theories, the following
hypotheses have been developed:
    Hypotheses about the DIRECT relationship

Hypothesis 1 (H1). Drug information availability has a significant and positive effect on a physician’s decision
to prescribe a drug.

Hypothesis 2 (H2). Brands of the drug have a significant and positive influence on physician’s decision to
prescribe a drug.

Hypothesis 3 (H3). Sales promotion has a significant and positive effect on a physician’s decision to prescribe
a drug.

Hypothesis 4 (H4). Medical representatives’ effectiveness has a significant and positive effect on a physician’s
decision to prescribe a drug.

Hypothesis 5 (H5). Patient’s request for a drug has a significant and positive effect on a physician’s decision to
prescribe a drug.

Hypothesis 6 (H6). Patient’s expectation has a significant and positive effect on a physician’s decision to
prescribe a drug.

Hypothesis 7 (H7). Pharmacist expert power has a significant and positive effect on a physician’s decision to
prescribe a drug.

Hypothesis 8 (H8). Pharmacist–physician collaboration has a significant and positive effect on a physician’s
decision to prescribe a drug.

2.3. The Moderating Variables for the Recommended Model
     The suggested model proposes an association between the influences (moderation) of numerous
variables, which have been found in distinctive physician’s models for prescription intentions towards
the medicines. Thus, based on previous literature, the cost and benefit ratio of a drug has a
significant moderating effect between endogenous variables and physician’s decision to prescribe
a drug [29,37,43]. However, in the physician and patient relationship, the patient entirely relies on
the expert power of physician for diagnosis and prescription, hence physician’s habit persistence is
also a significant moderating variable [29,39,66]. According to Groves [43], the physician’s decision
to prescribe a certain drug is based on several influencing (moderating) factors that the patient
has a little control over such as physician’s persistence, drug characteristics, and cost/benefit of a
medicine [37,42,64,66]. Similarly, the literature exhibited that trustworthiness is a moderating factor in
the relationship between pharmacist factors and physician’s prescription behavior [42,78,80]. Hence,
the undertaken model, the cost and benefit ratio of drug (CBR), drugs’ characteristics (DCH), and
physician’s habit persistence (PHP) have been taken as moderating factors in an association between
medical representative effectiveness (MRE) and patient expectations (PEX), and physician’s decision to
prescribe drugs (PDP) [29,39,41,42,66]. The conceptual frame also included trustworthiness (TRU) as the
moderating factor in an association between pharmacists’ expert power (PEP) and pharmacist–physician
collaboration (PPC), and physician’s decision to prescribe drugs (PDP) [43,66,78,80].
Sustainability 2020, 12, 3379 9 of 25
2.4. Hypotheses about Moderating Effect
The moderating variables have a direct relationship with physician’s decision to prescribe a drug.
The direct relationship is defined as “If the value of moderating variable increases, then the value
of outcome variable also increases or vice versa”. However, the values of exogenous variables are
considered constant as explained in results section.
Hypothesis 9A (H9A). Drug characteristics have a significant and direct moderating effect between medical
representatives’ effectiveness and physician’s decision to prescribe a drug.
Hypothesis 9b (H9b). Drug characteristics have a significant and direct moderating effect between the patient’s
expectations and the physician’s decision to prescribe a drug.
Hypothesis 10A (H10A). Cost and benefit ratio of a drug has a significant and direct moderating effect between
medical representatives’ effectiveness and physician’s decision to prescribe a drug.
Hypothesis 10B (H10B). Cost and benefit ratio of a drug has a significant and direct moderating effect between
patient’s expectations and physician’s decision to prescribe a drug.
Hypothesis 11A (H11A). Physician’s habit persistence has a significant and direct moderating effect between
medical representatives’ effectiveness and physician’s decision to prescribe a drug.
Hypothesis 11B (H11B). Physician’s habit persistence has a significant and direct moderating effect between a
patient’s expectations and the physician’s decision to prescribe a drug.
Hypothesis 12A (H12A). Trustworthiness has a significant moderating effect between pharmacist expert power
and a physician’s decision to prescribe a drug.
Hypothesis 12B (H12B). Trustworthiness has a significant and direct moderating effect between
pharmacist–physician collaboration and physician’s decision to prescribe a drug.
2.5. Proposed Model of the Study
The previous review helps to understand and assimilate the important theories and frameworks to
build a concrete model to comprehend the multifaceted physician’s decision to prescribe the medicines.
The challenge of this model is to test and measure the conceptual framework because it is comprised
of different theories and models. This empirical study tests the theoretical framework of different
scholarly works such as French and Raven [79], Ajzen [24], Kotler [73], Petty and Cacioppo [70], Jansen
and Meckling [63], and Murshid and Mohaidin [42]. The undertaken study not only tests and validates
the existing findings, but also enhances the current knowledge base on the foundation of a newly
derived model of Figure 2. These relationships have been based on previous theories, which were
discussed earlier and mentioned in Figure 1 [42].
3. Material and Methods
3.1. Research Design and Measurement Scales
The research design of this research is cross-sectional and quantitative; we employed a modified
structured questionnaire for the collection of data. The scales of questionnaire were adapted from the
previous literature; the modified items for marketing efforts related factors such as drug information
and availability, the brand of a drug, the sales promotion, and MRs effectiveness were adapted from
Howie [14], Ponnet et al. [18], Godin et al. [19], Raisch [22], Hemminki [23], Knapp and Oeltjen [41],
Murshid and Mohaidin [42], Xing and Othman [71], Perkins et al. [75], and Kramer et al. [76]. Thedrug (PDP) changes with the different values of moderating variables (DCH, CBR, and PHP), with
constant values for independent variables (MRE and PEX) during this moderating process. Hayes
[91] pointed out that the graphical representation is an essential condition to show the moderation
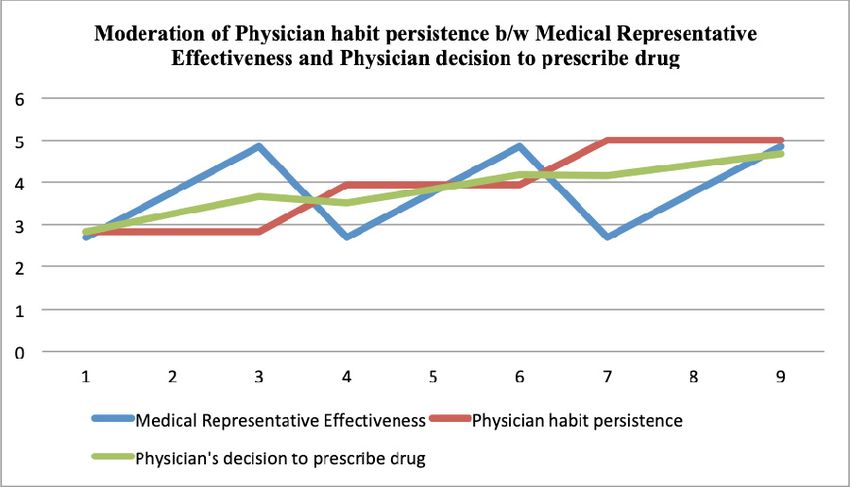
process because it demonstrates the impact of moderation. Figure 2 show blue for the independent
variables (MRE, PEX), red depicts the incorporated moderators (DCH, CBR, and PHP), and green
Sustainability 2020, 12, 3379 10 of 25
exhibits the influence of the physician’s decision to prescribe a drug (PDP). Hence, it is finally
concluded from Figure 2, the mediating variables (DCH, CBR, PHP) have a cogent influence
amongst
modified the association
items ofcharacteristics
for patients’ MRE and PEX,and andrelated
physician decision
factors such to
asprescribe
patients’ the drug (PDP)
requests in the
for a drug and
contextexpectations
patient’s of the healthcare
weresector of Pakistan.
considered The x-axisliterature
from previous demonstrates the continuums
[42,62–64]. The itemsof formoderating
pharmacists
(drugfactors
related characteristics, cost and benefit
such as pharmacists’ ratio
expert of drug,
power, and and physician
pharmacist andhabit persistence),
physician exogenous
collaborations were
(medical representative effectiveness and patients’ expectations), and endogenous
adapted from previous literature [42,77–80]. However, the items for contextually related factors such (physician’s
decision to prescribe a drug) variables’ values. However, the y-axis represents the total values of
as drug characteristics, cost and benefit (side effects vs. cure effects) ratio, physician’s persistence,
moderating, exogenous, and endogenous variables. Moreover, the x-axis further demonstrates the
and trustworthiness were taken from previous literature such as Godin et al. [19], Hemminki [23],
low, average, and high values of exogenous variables; similarly, the y-axis also showed the patterns
Knapp and Oeltjen [41], Murshid and Mohaidin [42], Xing and Othman [71], Perkins et al. [75],
of physician’s decision to prescribe a drug (endogenous variable) due to the interaction of
Kramer et al. [76], Basak et al. [77], Busch and Wilson [78], and Rigby [80].
moderating variables.
(a) (b)
Sustainability 2020, 12, x FOR PEER REVIEW 19 of 27
(c) (d)
(e) (f)
Figure
Figure 2. The
2. The visualizing
visualizing conditional
conditional effect
effect of of moderators
moderators (drugs’
(drugs’ characteristics
characteristics (DCH),the
(DCH), the cost
cost and
and benefit ratio of drug (CBR), and physician’s habit persistence
benefit ratio of drug (CBR), and physician’s habit persistence (PHP). (PHP).
Similarly,
3.2. Sampling theand
Frame visualized
Sample Sizeconditional effect can also be seen in Figure 3, in which the
moderating variable trustworthiness in an association of pharmacist–physician collaboration (PPC)
The sampling frame for the undertaken study was the family physicians from the metropolitan
and pharmacist expert power (PEP), was an endogenous variable such as physician’s decision to
cities of Pakistan
prescribe a drugsuch as Karachi,
(PDP). Lahore,
The results Islamabad,
of Figure Peshawar,
3 depict Multan,
that the effect of aand Hyderabad.
physician’s We used
decision to
non-probability
prescribe a drug (PDP) changes with the different values of the moderating variable (TRU),size;
sampling, for instance a purposive sampling strategy for selecting the sample withthe
self-administered
constant values survey techniquevariables
for independent was employed.
(PEP andThe
PPC)data werethis
during collected through
moderating skilledThus,
process. research
it
personnel directly from the family physician in person through an appointment. We used
is also concluded from Figure 3 that the moderating variable (TRU) has a significant influence a 5-point
amongst the association of PEP and PPC, and physician decision to prescribe the drug (PDP) in the
context of the healthcare sector of Pakistan. In Figure 3, blue represents the independent variables
such as pharmacist–physician collaboration (PPC) and pharmacist expert power (PEP), red depicts
the incorporated moderator trustworthiness (TRU), and green exhibits the influence of physician’s
decision to prescribe a drug (PDP). The x-axis demonstrates the continuums of moderatingSustainability 2020, 12, 3379 11 of 25
Likert scale structured questionnaire that was adapted from previous literature. Primarily, we collected
data from 1050 family physicians, but we received 984 questionnaires that were completed filled;
however, 66 questionnaires were found inadequately filled. Hence, the response rate was 93.71%.
3.3. Estimations Techniques for the DATA Analysis
We used the SEM-based multivariate approach for data analysis such as exploratory factor analysis
for the adequacy and retention of modified items and constructs. However, the confirmatory factor
analysis was used to check the previous items and constructs that were already used in previous
studies [9]. The CFA modeling provides the substantiality for adopted items and constructs and
whether they are fit for the undertaken study or not [9,27]. We employed descriptive analysis for
the characteristics of data samples such as mean, standard deviation, skewness, and kurtosis. In the
exploratory factor analysis, we used the rotated component matrix for the analysis of factor loading,
composite reliability, and average variance extracted. We also employed Kaiser Meyer Olkin (KMO)
and Bartlett’s techniques for the reduction and adequacy of constructs and items. For the reliability and
suitability of the data sample, we used the total variance explained and anti-image correlation matrix
techniques. For the conformity of the hypothesized structured model, we employed confirmatory
factor analysis. Finally, we used a conditional process modeling technique for measuring direct and
indirect (moderation) hypothesized relationships [27]. For the estimation purposes, we employed
SPSS21, AMOS21, Hayes Conditional Process, and EXCEL software
3.4. Respondents’ Profile
A total of 1050 questionnaires were distributed to the physicians of Pakistan, and we collected
984 responses, which were completed in every aspect, however 66 responses were incomplete or
inappropriate. Thus, in this way, the response rate was 93.71%, which is considered excellent as
the previous literature demonstrated [81,82]. As far as the demographic profile of respondents is
concerned, there were 552 (56.1%) males and 432 (43.9%) females. In terms of marital status, 564 (57.3%)
respondents were single, whereas, 387 (39.3%) respondents were married, and 33 (3.4%) were divorced.
In terms of age, 341 (34.7%) respondents were in the 20–30 years age bracket and 221 (22.5%) respondents
were in the 30–40 years age bracket. Moreover, 147 (14.9%) respondents were in the 40–50 years age
bracket, 154 (15.7%) respondents were in the 50–60 years age bracket, and 121 (12.3%) respondents
were in the age bracket of more than 60 years. As far as the qualification of respondents is concerned,
417 (42.4%) possessed a graduation degree and 314 (31.9%) respondents had local post-graduation
qualifications. However, 162 (16.5%) respondents had foreign post-graduation qualification, and 91
(9.2%) respondents had PhDs degrees. As far as the experience is concerned, 255 (25.9%) respondents
acquired (1–5) years of experience, 299 (30.4%) respondents had 5–10 years, 142 (14.4%) respondents
had 10–15 years, 134 (13.6%) respondents had 15–20 years, and 154 (15.7%) respondents possessed
more than 20 years of experience. Finally, in terms of income in Pakistani Rupee, there were 167
(17.0%) respondents that had 10K–30K earnings, 427 (43.4%) respondents had 30K–50K income, 211
(21.4%) respondents had 50K–70K earnings, 108 (11.0%) respondents had 70K–90K income, and 71
(7.2%) respondents had more than 90K income in Pakistani Rupee (PKR). Table 1 exhibits the details of
the results.Sustainability 2020, 12, 3379 12 of 25
Table 1. Respondents’ Profile.
Demographics Frequency Percent
Male 552 56.1%
Gender
Female 432 43.9%
Single 564 57.3%
Marital Status Married 387 39.3%
Divorced 33 3.4%
20–30 341 34.7%
30–40 221 22.5%
Age (In Years) 40–50 147 14.9%
50–60 154 15.7%
More than 60 121 12.3%
Graduation 417 42.4%
Post-Graduation (Local) 314 31.9%
Education
Post-Graduation (Foreign) 162 16.5%
Post-Graduation (Ph.D.) 91 9.2%
1–5 255 25.9%
5–10 299 30.4%
Experience (In Years) 10–15 142 14.4%
15–20 134 13.6%
More than 20 154 15.7%
10–30 167 17.0%
30–50 427 43.4%
Income (In PKR 000) 50–70 211 21.4%
70–90 108 11.0%
More than 90 71 7.2%
Total–N 984
4. Results
4.1. Descriptive Analysis
The normality of the sample data is a pre-requisite for using structural equation modeling [83];
thus, taken data have been transformed into z-scores, and descriptive analysis was employed. The
outcomes of Table 2 showed that all the cases remained between ±3 kurtosis. It is further exhibited
in Table 2 that the skewness and standard deviation lie between the ranges of ±1.5, therefore it is
concluded that the normality pattern is evident in the collected data [84,85].
Table 2. Descriptive statistics.
N Mean Std. Deviation Skewness Kurtosis
Statistic Statistic Std. Error Statistic Statistic Std. Error Statistic Std. Error
Physician decision to
984 3.7856 0.03433 1.07679 −0.898 0.078 0.314 0.156
prescribe a drug
Drug information
984 3.9268 0.03610 1.13249 −0.972 0.078 0.301 0.156
availability
Brands of the drug 984 3.5122 0.03347 1.05005 −0.558 0.078 −0.320 0.156
Sales promotion 984 3.8801 0.03250 1.01957 −0.959 0.078 0.914 0.156
Medical Representative
984 3.7713 0.03429 1.07574 −0.828 0.078 0.229 0.156
effectiveness
Patient request for drug 984 3.8425 0.03379 1.06004 −0.920 0.078 0.521 0.156
Patients’ expectations 984 3.9014 0.03539 1.11013 −0.909 0.078 0.232 0.156
Pharmacist expert power 984 3.7754 0.03408 1.06901 −0.830 0.078 0.355 0.156
Pharmacist Physician
984 3.7967 0.03374 1.05849 −0.934 0.078 0.588 0.156
Collaborations
Drugs’ characteristics 984 3.9045 0.03509 1.10074 −0.948 0.078 0.363 0.156
Cost and benefit ratio of a
984 3.8404 0.03409 1.06929 −0.900 0.078 0.429 0.156
drug
Physician’s habit
984 3.9400 0.03527 1.10647 −0.933 0.078 0.274 0.156
persistence
Trustworthiness 984 3.8415 0.03389 1.06324 −0.902 0.078 0.455 0.156
Valid N (listwise) 984Sustainability 2020, 12, 3379 13 of 25
4.2. Reliabilities and AVE Analyses
The outcome of Table 3 demonstrated that the values of composite reliabilities and Cronbach’s
alphas are over 0.85, which meets the minimum criterion of a threshold of 0.60 [84]. It is also evident
from Table 3 that the values of all the factor loadings are in the range of 0.50–0.95, which fulfilled the
criterion of discriminant validities [84,85]. The condition of convergent validities is satisfied because
the AVE is greater than 0.50 [86], which is also a pre-requisite for employing SEM-based structural
modelling such as exploratory and confirmatory factor analysis. The results of Table 3 demonstrated
the results of Factor Loading (FL), Composite Reliabilities (CR), Cronbach’s Alpha (CA), and Average
Variance Extracted (AVE).
Table 3. Reliabilities and average variance extracted.
Factors Items FL CA CR AVE
PDP1 0.935
Physician Decision to Prescribe a Drug PDP2 0.879 0.917 0.941 0.842
PDP3 0.938
DIA1 0.897
Drug Information Availability DIA2 0.894 0.898 0.927 0.807
DIA3 0.904
BOD1 0.904
Brands of the Drug BOD2 0.869 0.894 0.923 0.799
BOD3 0.908
SPR1 0.910
Sales Promotion SPR2 0.891 0.907 0.933 0.822
SPR3 0.919
MRE1 0.928
Medical Representative Effectiveness MRE2 0.900 0.925 0.947 0.857
MRE3 0.948
PRD1 0.897
Patient Request for Drug PRD2 0.868 0.895 0.924 0.802
PRD3 0.920
PEX1 0.921
Patients’ Expectations PEX2 0.893 0.907 0.933 0.823
PEX3 0.908
PEP1 0.897
Pharmacist Expert Power PEP2 0.870 0.892 0.921 0.796
PEP3 0.909
PPC1 0.907
Pharmacist Physician Collaborations PPC2 0.878 0.900 0.927 0.810
PPC3 0.914
DCH1 0.930
Drug Characteristics DCH2 0.902 0.923 0.945 0.852
DCH3 0.937
CBR1 0.929
Cost/Benefit Ratio of Drug CBR2 0.895 0.911 0.936 0.830
CBR3 0.909
PHP1 0.907
Physician Habit Persistence PHP2 0.883 0.904 0.931 0.818
PHP3 0.922
TRU1 0.895
Trustworthiness TRU2 0.894 0.901 0.929 0.813
TRU3 0.915
PDP = Physician decision to prescribe drug; PRD = Patient request for drug; BOD = Brands of the drug; SAL = Sales
promotion; DIA = Drugs’ information availability; MRE = Medical representative effectiveness; PEX = Patients’
expectations; PEP = Pharmacist expert power; PPC = Pharmacist Physician collaborations; CBR = Cost and benefit
ratio of drug; DCH = Drug characteristics; PHP = Physician’s habit persistence; TRU = Trustworthiness.Sustainability 2020, 12, 3379 14 of 25
4.3. Exploratory Factor Analysis—EFA
We employed the analysis of exploratory factors to ascertain the fitness and reduction of the
sample data; the EFA further categorizes the loaded items, which were enlisted on the comparable
factor or construct. Exploratory factor analysis has the proficiency to shrink a large amount of data
sample into a reduced form. According to Emory and Cooper [87], the EFA technique may assist the
researcher in scrutinizing the possessions of the variables. The outcomes of Table A1 (see Appendix A)
exhibited the results of the principal component rotated matrix, which authenticated the construct
validities of factors and items of the data sample. The undertaken study consists of 13 factors, and 39
items, in which physician decision to prescribe drug (PDP) is comprised of three items each with factor
loadings of 0.935, 0.879, and 0.938; drugs’ information availability (DIA) has three items each with factor
loadings of 0.897, 0.894, and 0.904; brands of a drug (BOD) is contained on three items each with factor
loadings of 0.904, 0.869, and 0.908; sales promotion (SPR) is comprised of three items each with factor
loadings of 0.910, 0.891, and 0.919; medical representatives’ effectiveness (MRE) is contained on three
items each with factor loadings of 0.928, 0.900, and 0.948; patients’ request for drug (PRD) is comprised
of three items each with factor loadings of 0.897, 0.868, and 0.920; patients’ expectations (PEX) has
three items each with factor loadings of 0.921, 0.893, and 0.908; pharmacists’ expert power (PEP) is
comprised of three items each with factor loadings of 0.897, 0.870, and 0.909; pharmacist–physician
collaborations (PPC) is contained on three items each with factor loadings of 0.907, 0.878, and 0.914;
drug characteristics (DCH) is comprised of three items each with factor loadings of 0.930, 0.902, and
0.937; cost and benefit ratio of a drug (CBR) is comprised of three items each with factor loadings of
0.929, 0.895, and 0.909; trustworthiness (TRU) is contained on three items each with factor loadings of
0.895, 0.894, and 0.915; and physician’s habit persistence (PHP) is comprised of three items each with
factor loadings of 0.907, 0.883, and 0.922. The outcomes of Table A1 (see Appendix A) exhibits that the
values of factor loading for each construct was over 0.50, which confirmed and validated all items and
factors, which we have loaded for the undertaken study [84,88,89].
4.4. Kaiser Meyer Olkin (KMO) and Bartlett’s Techniques
The KMO analysis and Bartlett’s Sphericity technique examine the suitability and fitness of the
data sample; the outcomes of Table 4 exhibit that the KMO value is 0.931, which is fairly excellent
because according to Kaiser [89], values ranging 0.70–0.79 are considered to be good, and ranging
0.80–0.99 are to be considered excellent. The results of Table 4 further demonstrate the values of
Bartlett’s Sphericity test, and it shows the probability is less than 0.50 i.e., 0.000, which indicated the
correlation between items is cogent and adequate at 0.05 level of significance.
Table 4. Bartlett’s and Kaiser Meyer Olkin (KMO) tests.
Kaiser-Meyer-Olkin Measure of Sampling Adequacy. 0.931
Approx. Chi-Square 16,682.036
Bartlett’s Test of Sphericity Df 78
Sig. 0.000
4.5. Total Variance Explained
The cumulative percentage of variance for 13 factors demonstrated the dispersion of the variance
of these potential factors; the total value of Eigen is greater than 1, which further established the
amount of variance amongst prospective factors as indicated by Table 5. The results also exhibited that
the cumulative variance is 81.06%, which is considered to be very good since the minimum threshold
value is 50%. Hence, based on total Eigenvalue and cumulative variance, it is concluded that our data
sample is to be considered reliable, and we can proceed for further analysis.Sustainability 2020, 12, 3379 15 of 25
Table 5. Total variance explained.
Initial Eigenvalues Extraction Sums of Squared Loadings Rotation Sums of Squared Loadings
Components
% of Cumulative % of Cumulative % of Cumulative
Total Total Total
Variance % Variance % Variance %
1 3.179 7.946 7.946 3.179 7.946 7.946 2.604 6.510 6.510
2 2.969 7.423 15.369 2.969 7.423 15.369 2.583 6.457 12.967
3 2.871 7.176 22.546 2.871 7.176 22.546 2.548 6.369 19.336
4 2.790 6.974 29.519 2.790 6.974 29.519 2.519 6.297 25.632
5 2.619 6.548 36.067 2.619 6.548 36.067 2.505 6.262 31.895
6 2.599 6.497 42.564 2.599 6.497 42.564 2.501 6.253 38.148
7 2.508 6.269 48.833 2.508 6.269 48.833 2.488 6.219 44.367
8 2.372 5.929 54.763 2.372 5.929 54.763 2.482 6.204 50.571
9 2.272 5.681 60.444 2.272 5.681 60.444 2.476 6.190 56.761
10 2.233 5.583 66.027 2.233 5.583 66.027 2.456 6.139 62.900
11 2.085 5.212 71.238 2.085 5.212 71.238 2.428 6.070 68.970
12 2.007 5.016 76.255 2.007 5.016 76.255 2.425 6.063 75.033
13 1.921 4.803 81.058 1.921 4.803 81.058 2.410 6.025 81.058
Extraction Method: Principal Component Analysis.
4.6. Confirmatory Factor Analysis—CFA
The CFA is an appropriate and direct approach to check the measurement model; moreover,
the CFA analysis examines whether our data fit a hypothesized measurement model [88]. In our
measurement model, we confirm the factors of physician’s decision to prescribe a drug (PDP) such
as drug information availability (DIA), brands of the drug (BOD), sales promotion (SPR), medical
representative effectiveness (MRE), and patients characteristics like patient request for drug (PRD),
patients’ expectations (PEX), and pharmacist factors, for instance, pharmacist expert power (PEP) and
pharmacist physician collaborations (PPC). Moreover, drug characteristics (DCH), cost/benefit ratios of
the drug (CBR), physician habit persistence (PHP), and trustworthiness (TRU) have been considered
as moderating variables. We incorporated 39 items of all these 13 factors into the confirmatory factor
analysis and fixed the data sample between observed and unobserved [84,86]. The results showed
that factor loading ranged 0.80–0.95, which demonstrated that the overall measurement model is
acceptable; moreover, it was also confirmed through the factor loading of all the items, which were
greater than 0.50, which also substantiated the construct and convergent validities of the hypothesized
measurement model. The outcomes of Table 6 demonstrate that the fit-indices (GFI: 0.96, IFI: 0.95, CFI:
0.96, TLI:0.97, NFI:0.92, RNI:0.98, PCFI:0.85, PNFI:0.87, RMSEA:0.004) for the measured model are
within the prescribed ranges, and it is finally concluded that considered the hypothesized measurement
model for the physician decision to prescribe the drug is suitable. Moreover, Hair et al. [88] and
Bentler [90] have concluded, if the values of GFI, CFI, IFI, TLI, and IFI are close to 0.95 or over then the
hypothesized model should be accepted.
Table 6. Fit-indices statistic.
Non-Centrality-Based Parsimonious
The Goodness of Fit Absolute Fit Indices Relative Fit Indices
Indices Fit Indices
Measures
χ2/df Probability GFI NFI IFI TLI CFI RMSEA RNI PCFI PNFI
Measurement Model 3.22 0.0042 0.96 0.92 0.95 0.97 0.96 0.004 0.98 0.85 0.87
Structural Model 3.34 0.0047 0.98 0.94 0.97 0.99 0.98 0.005 0.99 0.88 0.89
Criterion (Threshold values) < 5.0 0.95 >0.90 >0.95 >0.95 >0.95 0.95 >0.75 >0.75
Note. TLI = Tucker-Lewis Index; χ2/d = Relative Chi-square; GFI = Goodness of Fit Index; RMSEA = Root mean
squared error of approximation; CFI=Comparative fit index; NFI = Normed fixed index; IFI=Incremental fixed index;
RNI = Relative Non-centrality Index; PNFI = Parsimony-adjusted normed fit index; PCFI = Parsimonious-adjusted
fit index.Sustainability 2020, 12, 3379 16 of 25
4.7. Structural Equation Modelling—SEM
We employed structural equation modelling for the estimation of parameters for the physician
decision to prescribe the drug (PDP) from the perspective of the healthcare sector of Pakistan. In
our structural model, we used four factors of marketing efforts such as drug information availability
(DIA), brands of the drug (BOD), sales promotion (SPR), and medical representative effectiveness
(MRE); patients characteristics like patient request for drug (PRD) and patients’ expectations (PEX);
and pharmacist factors, for instance, pharmacist expert power (PEP) and pharmacist physician
collaborations (PPC). Moreover, drug characteristics (DCH), cost/benefit ratio of the drug (CBR),
physician habit persistence (PHP), and trustworthiness (TRU) were considered as moderating variables,
and physician decision to prescribe the drug (PDP) as a dependent variable. The results of Table 6
exhibit that based on our suggested research hypothesis, the results of the structural model indicate
that the entire model is acceptable under the threshold values of the fit-indices statistics. The outcomes
of Table 6 show that values of GFI:0.98, CFI:0.98, IFI:0.97, TLI:0.99, NFI:0.94, RNI:0.99, PCFI:0.88,
PNFI:0.89, and RMSEA:0.005 are within the prescribed limits of all the indices. Hence, the overall
results of the structural model exhibited adequate information to accept the model for the data sample.
Finally, it is concluded that our structural model is accepted as a useful instrument to examine the PDP.
4.8. Hypothesized Direct Relationship
We employed standardized regression weights to interpret the direct relationship between four
factors of marketing efforts such as drugs’ information availability (DIA), sales promotion (SPR), brands
of a drug (BOD), medical representatives’ effectiveness (MRE); characteristics of patients including
patients’ request for a drug (PRD) and patients’ expectations (PEX); and pharmacist factors, for instance,
pharmacist and physician collaboration (PPC), pharmacists’ expert power (PEP), and physician’s
decision to prescribe a drug (PDP) in the perspective of healthcare sector of Pakistan. The results
of Table 7 demonstrated that all eight null hypotheses (H1–H8) have been rejected because T-values
are greater than 2, and corresponding probabilities are less than 0.5 in all the hypotheses. Thus, it is
concluded that all the null hypotheses are supported, and DIA, BOD, SAL, MRE, PRD, PEX, PEP, and
PPC have a significant and positive influence on the PDP. The individual results signified that the
pharmacist physician collaborations (PPC), and patients’ expectations (PEX) have the highest impacts
of 0.522 and 0.515, respectively. However, patient request for a drug (PRD) and drug information
availability (DIA) followed with the impacts of 0.402 and 0.344, respectively, on the PDP.
Table 7. Hypothesized direct relationship.
Regression Standardized Regression
Hypotheses Variables SE T P Decision
Paths Weights (β)
Drug information
H1 DIA † → PDP 0.344 0.027 12.219 0.000 Supported
availability
H2 Brands of the drug BOD † → PDP 0.040 0.018 2.338 0.020 Supported
H3 Sales promotion SPR † → PDP 0.235 0.034 7.274 0.000 Supported
Medical
H4 Representative MRE † → PDP 0.333 0.035 9.489 0.000 Supported
effectiveness
Patient request for
H5 PRD † → PDP 0.402 0.026 15.515 0.000 Supported
drug
Patients’
H6 PEX † → PDP 0.515 0.025 19.877 0.000 Supported
expectations
Pharmacist expert
H7 PEP † → PDP 0.331 0.029 11.504 0.000 Supported
power
Pharmacist
H8 Physician PPC † → PDP 0.522 0.028 18.149 0.000 Supported
Collaborations
Note: † = Predictor; DV = PDP = Physician decision to prescribe drug; DIA = Drug information availability;
BOD = Brands of a drug; SPR=Sales promotion; MRE = Medical representatives’ effectiveness; PRD = Patients’ request
for a drug; PEX = Patients’ expectations; PEP = Pharmacist expert power; PPC = Pharmacist Physician collaborations.You can also read