Social and Economic Impact of COVID-19 - Background paper 13 by Eduardo Levy Yeyati & Federico Filippini - The Independent ...
←
→
Page content transcription
If your browser does not render page correctly, please read the page content below
Social and Economic Impact of COVID-19
                             Background paper 13
                                      by
                     Eduardo Levy Yeyati & Federico Filippini
 Commissioned by The Independent Panel for Pandemic Preparedness and Response | May 2021
May 2021

Table of Contents
1. Introduction ........................................................................................................................ 2
2. The costs of Covid in 3 stages .............................................................................................. 4
   2.1 Stage 1: The macroeconomic impact ................................................................................... 4
   2.2 Stage 2: The fiscal reaction ................................................................................................ 7
   2.3 Stage 3: The recovery ........................................................................................................ 9
3. Initial conditions ................................................................................................................10
   3.1 Fiscal space.....................................................................................................................10
   3.2 State capacity .................................................................................................................11
   3.3 The labor market channel.................................................................................................12
   3.4 Initial conditions and economic impact ..............................................................................14
4. Dealing with the pandemic ................................................................................................17
   4.1 Cross-country evidence on lockdowns and economic activity................................................18
   4.2 Fiscal response to the pandemic ........................................................................................21
5. The role of IFIs....................................................................................................................26
6. Estimating the economic costs of the pandemic .................................................................28
7. Final remarks .....................................................................................................................30
References .............................................................................................................................33

The views expressed are those of the authors and do not necessarily reflect the views of the
Independent Panel for Pandemic Preparedness and Response.

The Secretariat for the Independent Panel for Pandemic Preparedness and Response                                                        1
May 2021

1. Introduction
The impact of the pandemic on world GDP growth is massive. The Covid-19 global recession is the
deepest since the end of World War II (Figure 1). The global economy contracted by 3,5% in 2020
according to the Apr-2021 WEO-IMF, a 7% loss relative to the 3,4% growth forecast back in October
2019. While virtually every country covered by the IMF posted negative growth in 2020 (IMF 2020b), the
downturn was more pronounced in the poorest parts of the world (Noy et al. 2020) (Figure 2).

                                  Figure 1. Global GDP growth in a historical perspective
     8
     6
     4
     2
     0
         1871
         1875

         1891
         1895

         1911
         1915

         1931
         1935

         1951
         1955

         1967
         1971
         1975

         1987
         1991

         2007
         2011
         1879
         1883
         1887

         1899
         1903
         1907

         1919
         1923
         1927

         1939
         1943
         1947

         1959
         1963

         1979
         1983

         1995
         1999
         2003

         2015
         2019
    -2
    -4
    -6
    -8
   -10                                                                                      GDP growth
                                                                                            Per capita GDP growth
   -12
 Sources: Bolt et al. (2018), Kose, Sugawara, and Terrones (2019, 2020), and IMF-WEO Apr-2021. Shaded areas refer to global
                                                           recessions.

The impact of the shock is likely to be long-lasting. While the global economy is expected to recover
this year, the level of GDP at the end of 2021 in both advanced and emerging market and developing
economies (EMDE) is projected to remain below the pre-virus baseline (Figure 3Error! Reference source
not found.). As with the immediate impact, the magnitude of the medium-term cost also varies
significantly across countries, with EMDE suffering the largest loss. The IMF (2021) projects that in 2024
the World GDP will be 3% (6% for LICs) below the no-Covid scenario. Along the same lines, Djiofack et al.
(2020) estimate that African GDP would be permanently 1% to 4% lower than in the pre-COVID outlook,
depending on the duration of the crisis.

The Secretariat for the Independent Panel for Pandemic Preparedness and Response                                              2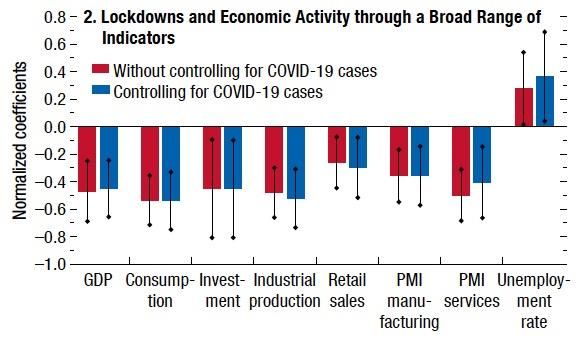
May 2021

                                                           Figure 2. Global GDP growth 2020
                   0

                  -1

                  -2

                  -3

                  -4

                  -5

                  -6

                  -7

                  -8

                  -9
                         Em. Asia      LAC             SSA             MECA        EMDE         World Em. Eur.                AE          China          United
                         ex. CHN                                                                                                                         States

      Source: IMF-WEO Apr-2021. Note: AE = Advance economies; Emerging Asia ex. CHN = emerging and developing Asia
   excluding China; EM. Eur = Emerging and developing Europe; LAC = Latin America and the Caribbean; MECA = Middle East
                                        and Central Asia; SSA = sub-Saharan Africa.

            Figure 3. Quarterly World GDP (GDP forecast in Jan-2020 vs. Jan-2021, 2019 Q1 = 100)
                   120
                   115
                   110
                   105
                   100
                       95
                       90
                       85
                       80
                                                 2020:Q2

                                                                         2020:Q4

                                                                                             2021:Q2

                                                                                                                 2021:Q4

                                                                                                                                     2022:Q2

                                                                                                                                                           2022:Q4
                             2019:Q4

                                       2020:Q1

                                                             2020:Q3

                                                                                   2021:Q1

                                                                                                       2021:Q3

                                                                                                                           2022:Q1

                                                                                                                                               2022:Q3

                                                                           China                 Aes             EMDE
      Source: IMF-WEO Jan-2021. Note: dashed lines indicated estimates from Jan-2020 World Economic Outlook Update.

The pandemic triggered a health and fiscal response unprecedented in terms of speed and magnitude.
At a global scale, the fiscal support reached nearly USD 16 trillion (around 15% of global GDP) in 2020.
However, the capacity of countries to implement such measures varied significantly. In this note, we
identify three important pre-existing conditions that amplified the impact of the shock:
    • The fiscal space: the capacity to support household and firms largely depends on access to
         international financial markets,

The Secretariat for the Independent Panel for Pandemic Preparedness and Response                                                                                           3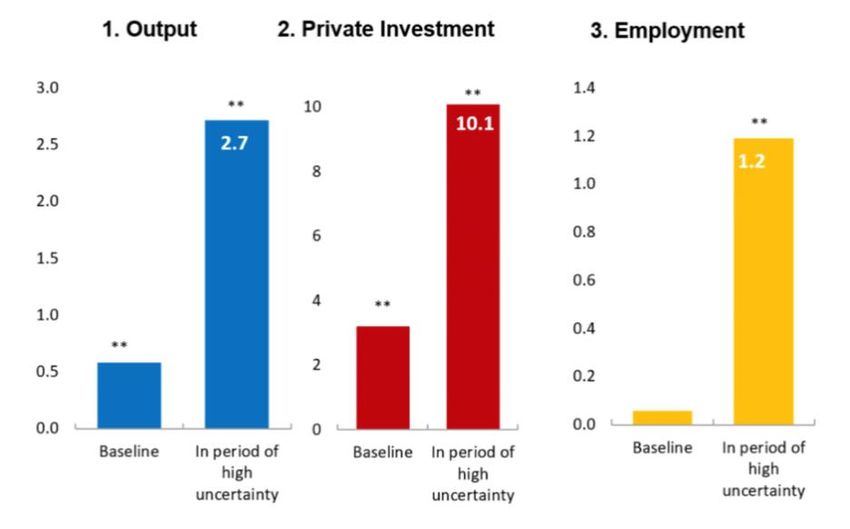
May 2021

     •     The state capacity: fast and efficient implementation of policies to support household and firms
           requires a substantial state capacity and well-developed tax and transfer infrastructure; and
     •     The labor market structure: a large share of informal workers facing significant frictions to adopt
           remote working, and high levels of poverty and inequality, deepen the deleterious impact of the
           crisis.

Additionally, the speed and the strength of the recovery will be crucially dependent on the capacity of
the governments to acquire and roll out the vaccines.
This paper presents a succinct summary of the existing economic literature on the economic and fiscal
impact of the pandemic, and a preliminary estimate of the associated economic cost. It documents the
incidence of initial conditions (with a particular focus on the role of the labour market channel) on the
transmission of the shock and the speed and extent of the expected recovery, summarizes how
countries attempted to attenuate the economic consequences and the international financial
institutions assisted countries, reports preliminary accounts of medium-term COVID-related losses, and
concludes with some forward-looking considerations based on the lessons learned in 2020.

2. The costs of Covid in 3 stages
The Covid-19 shock can be interpreted as a combination of supply and demand shocks (Baqaee and
Farhi, 2020; Caballero and Simsek, 2020; Guerrieri et al., 2020). The supply shock was mainly driven by
the restriction of activities due to lockdowns and distancing measures to contain the spread of the virus,
causing sectors to struggle to keep up with demand, while the demand shock reflected both the income
effect suffered by workers in restricted activities, as well as the diminished mobility and changes in
consumption patterns due to contagion concerns (IMF 2020b).

2.1 Stage 1: The macroeconomic impact
The COVID shock propagated quickly across countries causing a synchronized negative impact . More
than 90% of the global economy experienced a contraction in per capita GDP, the highest share of
countries simultaneously contracting since the Great Depression of 1930-32 (World Bank Global
Outlook, 2020). The shock propagated through three key channels: (i) a disruption of global value chains,
(ii)` restrictions to international mobility, which affected economies and activities differently, depending
on their exposure and preparedness; and (iii) a reduction in cross-country remittances.
Trade experienced a short-lived but deep dive (Figure 4). Goods trade fell rapidly, adding to the
economic decline in manufacturing countries, but recovered quickly, reflecting the substitution of
demand from contact-intensive services (impaired by COVID-related restriction) to goods, and the
considerable resilience of global value chains to transitory disruptions in the first semester (The World
Bank, 2021). Predictably, services trade remained below pre-crisis levels due to travel restrictions.

The Secretariat for the Independent Panel for Pandemic Preparedness and Response                             4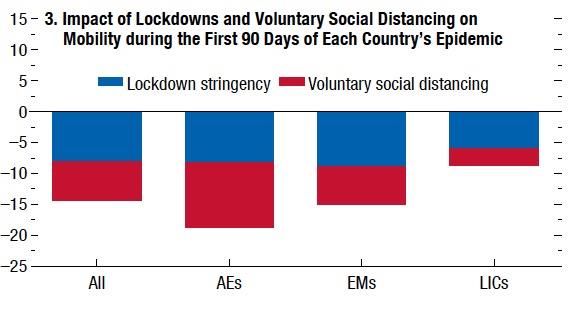
May 2021

                                  Figure 4. Trade in Goods and Services (Index, t-1 = 100)
       100

        95

        90

        85

        80                    Global financial crisis
                              COVID-19 pandemic
        75
                 t-1

                                                                                   t-1
                        t

                                                                                         t
                               t+1

                                      t+2

                                              t+3

                                                     t+4

                                                            t+5

                                                                   t+6

                                                                                             t+1

                                                                                                      t+2

                                                                                                            t+3

                                                                                                                    t+4

                                                                                                                          t+5

                                                                                                                                t+6
                                       Goods trade                                                 Services trade
    Source: The World Bank (2021). Note: Goods trade is in real terms from the CPB Netherlands Bureau for Economic Policy
   Analysis, whereas services trade is in values from the WTO. For global financial crisis, t = November 2008; for COVID -19, t =
                                                           March 2020.
There is a positive correlation between the magnitude of growth revisions and the death toll (Figure
5). The IMF-WEO growth projections have been revised down from pre-COVID levels by 9% on
(unweighted) average. To be sure, there are extremes countries, such as Peru or India, whose growth
was revised downwards by more than 15 percentage points. In the next sections, we discuss some of the
factors that allowed countries to fare better economically.
In addition, the death toll has been on average larger for high -income countries. This can be attributed
to several reasons, including demographics, the degree of international integration, and the fact that
most northern hemisphere countries went through two winters (and two COVID waves).
As a result, there is a weak negative unconditional correlation between income and COVID impact.
The finding, highlighted recently by Deaton (2021), is entirely due to the higher circulation of COVID in
advanced economies. However, as we show in section 3 below, if the size of the COVID shock is
controlled for, developed economies fared better than the rest. Moreover, as we document in section 6,
once we measure the economic cost over the full cycle (including the recovery), or (even more so) when
we consider a 10-year medium-term window, the correlation between income and economic losses is
inverted: poor countries will ultimately face a larger cost.

The Secretariat for the Independent Panel for Pandemic Preparedness and Response                                                       5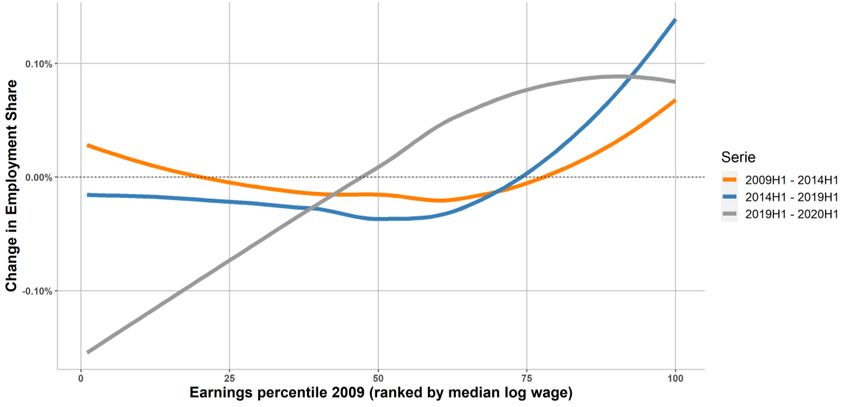
May 2021

      Figure 5. Growth forecast and income (areas proportional to population; in red, OECD countries)
      Growth revision (IMF WEO Oct-        0
                                          -2 6                 7                8                    9              10               11                12
                                          -4
                                          -6
              20 vs Oct-19)

                                          -8                                                               Brazil

                                         -10
                                         -12
                                         -14
                                         -16
                                         -18
                                         -20
                                                                                    ln( GDP per capita in 2019, PPP)

                                         8
                                                                                                           Brazil
      Ln( Deaths pero million, 1 April

                                         7
                                         6
                                         5
                                         4
                  2021)

                                         3
                                         2
                                         1
                                         0
                                         -1 6                  7                8                    9              10               11                12

                                         -2
                                                                                ln( GDP per capita in 2019, PPP)

                                                           0
      Growth revision (IMF WEO Oct-20

                                   -2             -1      -2 0           1            2          3         4             5       6        7            8
                                                          -4
                                                          -6
                vs Oct-19)

                                                          -8                                                                                  Brazil
                                                         -10
                                                         -12
                                                         -14
                                                         -16
                                                         -18
                                                         -20
                                                                             ln( Deaths per million, 1 April 2021)

                                                 Source: IMF (2020b) and Our World in Data. Note: Red bubbles refer to OECD countries.

The Secretariat for the Independent Panel for Pandemic Preparedness and Response                                                                            6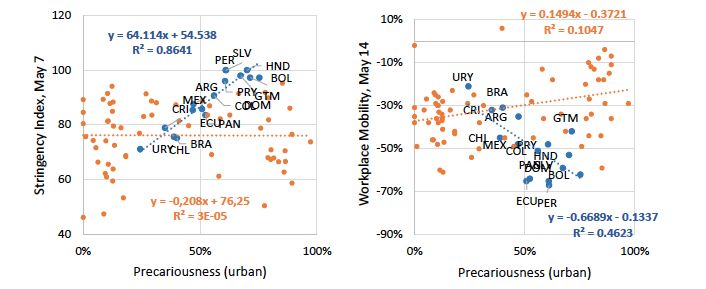
May 2021

2.2 Stage 2: The fiscal reaction
The Covid-shock trigger an unprecedented response from governments across the globe although very
heterogeneous across countries (see section 4.2). The increase of the fiscal deficit in advance
economies doubles that of emerging and middle-Income countries and was five times larger than that of
lower-income economies (Figure 6a). The sizable discretionary fiscal support, along with the contraction
in output and fiscal revenues, led to an increase in government debts (Figure 6b).

                                  Figure 6. Fiscal response (as % of GDP)
  Panel a. Forecasts for General Government Gross            Panel b. Government debt (as % of GDP)
   Debt and Fiscal Balances, 2020 (Percent of GDP)
              125.5                                 Gross public debt      150
         104.7                                         Fiscal balance                            World

                                     56.3 62.2                                                   Advanced economies
                       Oct-2020

                                                         45.0 48.8
            Jan-2020

                                                                           100                   EMDEs

          -3.0                                           -4.1
                                     -5.1                       -6.2
                                                                             50
                                            -10.7
              -14.4
          Advanced                Emerging Market       Low-Income
                                    and Middle-         Developing
                                       Income            Countries            0
                                     Economies                                     1970   1980    1990    2000        2010   2020

                                        Source: The World Bank (2021) and IMF Fiscal Monitor Oct-2020

The risks stemming from deterioration of the fiscal front –funded by the issuance of debt or base
money – was regarded as secondary for most governments in 2020. Governments focused on providing
support for households and struggling companies. Corporate indebtedness will also likely increase as
firms are facing an abrupt reduction in sales, particularly in the developing world (Figure 7).

The Secretariat for the Independent Panel for Pandemic Preparedness and Response                                                    7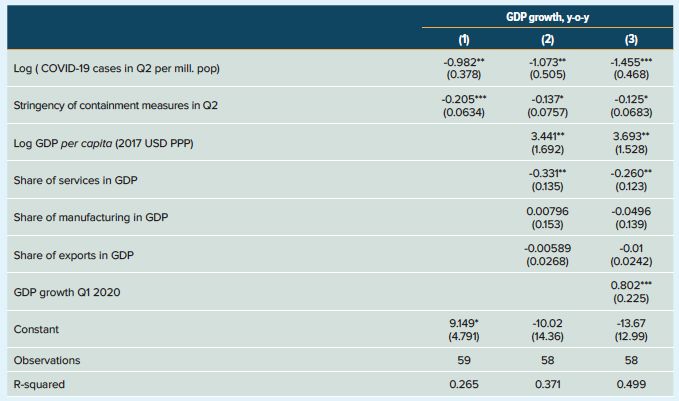
May 2021
Figure
Figure 1.10. Easier 7.Conditions
Funding Corporate Bonds
and RisingIssuances
Debt (in billion USD)
Panel a. Advance Economy Corporate Bonds and Panel b. Emerging Market Hard Currency
Bond markets hav e reopened for a broad range of issuers, with lower-rated issuers pay ing spreads higher than those before COVID-19.
Leverage Loan Issuance (in billion USD)
1. Advanced Economy Corporate Bond and Leverage
Corporate and Sovereign Bond Issuance (in
2. Em erging Market Hard Currency Corporate and
billion
3. Advanced Economy and Emerging Mar
Loan Issuance Sovereign Bond Issuance (Basis points)
(Billions of US dollars) (Billions of US dollars) USD)
Investment grade Hiegh yield 80 Investment grade High yield Non-rated CEMBI IG+ CEM
400
Not rated Leveraged loans EMBIG IG GA
70 GABI HY EM
350
60
300
50
250
40
200
30
150
20
100
10
50
0
0 2020 Feb. Mar. Apr. May Jul.
2019 Jan. Feb. Mar. Apr. May Jun. Jul. Aug. Sep.
2019 Jan. Feb. Mar. Apr. May Jun. Jul. Aug. Sep. Jan.
Avg.
Avg.
Source:
Bank lending to nonfinancial firms was strong in the first halfIMF (2020c)
of the y ear … … in part driv en by credit line drawdowns and gov ernment guarantees.
4. Bank Credit Growth in Advanced and Emerging Market Economies, 2020:Q2 5. New Loans, Credit Lines, and Government Guarantees, in Major Advanc
(Percent) Since March 2020
(Billions of US dollars)
The world is experiencing moderate tailwinds. Zero or negative real interest rates in advanced
2020:Q2 2015-19 average
economies (the
20
reflection of vast global liquidity) combine with a considerable appetite forCredit riskline draw downs
assets
Guaranteed loan commitments
Lending to corporate New business loan volume
that favours investment Lending
and capital flows to emerging to household
economies, reducing their borrowingChanges
costsin.outstanding loans
16
Figure 8. International Financial Conditions
12
8
4
0
US Euro Other China Other US Euro Other China Other
area AE EM area AE EM USA GBR DEU FRA ITA
Increased borrowing helped firms cope with liquidity pressures as earnings collapsed … and has pushed aggregate corporate debt lev els to new highs in
following the outbreak …
6. Publicly Listed Firms: Share of Debt with ICR < 1 and Increased Net Debt 7. Aggregate Nonfinancial Corporate Debt
(Firm s with public quarterly statements; percent of total debt of these firms) (Percent of GDP)
ICR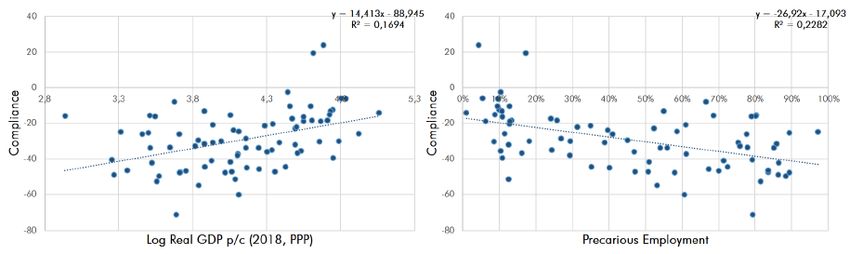
May 2021

Finally, partly because of the lax financial conditions, we are facing a boost to commodity prices.
Again, this has a differential impact across economies, especially in the developing world, depending on
whether or not a country is a net exporter or importer of commodities. In particular, it may compound
the economic pain and social deterioration in low-income commodity importers.

2.3 Stage 3: The recovery
The global economy is recovering slowly from the Great Lockdown. The most recent World Economic
Outlook (WEO) update, published in April 2021, estimates a partial recovery in 2021 with a baseline
scenario for growth at +5.8%. Economies are expected to operate with excess capacity in the medium
term (Figure 9). Both advanced and developing economies are expected to operate below the 2019 level
even after the 2021 rebound – pointing to modest growth in 2020–25.
                                            Figure 9. Losses: 2019:21 versus 2019-25

                                                             Source: IMF (2020)
At the time of this writing, the path of the post-Covid pandemic and its economic consequences
remain uncertain and may be revised. One key source of uncertainty stems from the fact that the
intermittent containment efforts could remain in force for longer than expected, as the vaccination
progresses slowly in some advanced countries and a new wave strike in developing ones. Preliminary
high-frequency indicators suggest that the rebound in economic activity may have faded somewhat in
2021 Q1 as the second wave intensifies, both in the northern and southern hemispheres, with the U.S.
and China the notable exceptions. At any rate, the speed and success of the vaccination campaigns will
be critical for the timeliness and strength of the recovery.

The Secretariat for the Independent Panel for Pandemic Preparedness and Response                           9
May 2021
Figure 10. High-frequency economic activity indicators
10 105
5 100
0
95
-5
90
-10
-15 85
-20 80
2019m1
2019m3
2019m4
2019m6
2019m7
2019m9
2020m1
2020m4
2020m7
2019m2
2019m5
2019m8
2020m2
2020m3
2020m5
2020m6
2020m8
2020m9
2019m10
2020m10
2019m11
2019m12
2020m11
2020m12
Industrial production
Manufacturing PMI: New orders
Monthly world trade volumes (seasonally adjusted, 2018=100, right scale)
Note: Three-month moving average, annualized percent change; deviations from 50 for manufacturing PMI, unless noted
otherwise. Source: IMF WEO Jan-2021
3. Initial conditions
Initial conditions matter to explain the heterogenous impact, response, and outlooks across countries.
The pandemic, besides highlighting the traditional problem of the differential fiscal space to cope with
the crisis via fiscal stimuli, revealed two other equally critical aspects: the capacity of governments to
buffer the health and economic effect and prioritize and allocate its scarce resources efficiently, and the
crucial role played by the labor market structure in inhibiting the government effort to attenuate the
impact of the shock. In this section, we address these three aspects in order.
3.1 Fiscal space
Fiscal stimuli are very heterogeneous across countries. From a historical perspective, the fiscal stimulus
during the Covid-19 shock was almost three times that observed during the Global Financial Crisis
(Figure 11). Up to some point, the magnitude of the fiscal stimulus was calibrated assuming a one-off
shock, while the second/third wave of new cases and, more generally, the persistence of the economic
damage implies that further support to the vulnerable should be –and, in developed economies, is
being– extended until treatments and vaccines are made available to all.
Figure 11. Fiscal Stimuli
Panel a. Discretionary fiscal stimulus (as % of Panel b. International fiscal response to COVID-19
GDP) (as % of 2019 GDP)
The Secretariat for the Independent Panel for Pandemic Preparedness and Response 10May 2021
Source: IMF (2020b)
In addition to the fiscal space, an important dimension to understand the capacity of individual
governments to cope with the pandemic is their political space. The political space is relevant to
understand the interaction between lockdowns and the fiscal response. Specifically, stricter and more
persistent lockdowns mean bigger downturns and stronger demands for support for household and
firms (see section 4.1). The (effectiveness of the) lockdown and the fiscal response are, in turn,
conditioned by two aspects. On the one hand, many countries came from a period of increased civil
unrest that may detract from the government´s ability to restrict mobility; on the other hand, besides
the predictable economic toll of a protracted lockdown, most countries suffer from lockdown fatigue
associated with diminished socialization and stressed mental health due to limited mobility or to the
combination of home office with closed schools. The diverse degree of compliance with protocols and
restrictions also helps explain the heterogeneous efficacy of the fiscal response.
Looking ahead, the question is whether governments can provide additional support without causing
renewed financial stress. The risk of financial turmoil has been magnified by the rise in debt levels
because of the pandemic. Less developed countries –running behind the vaccination race– that need
more persistent fiscal stimuli to support the vulnerable, with more limited access to cheap finance, will
face the toughest test in the months ahead.
3.2 State capacity
The Covid-19 crisis posed a critical challenge for policymakers as they need to quickly reach workers
and households during the abrupt economic crisis. To support affected groups, policymakers require
sufficient information (household composition, job status, income) and a reliable delivery framework to
ensure that the support reaches the targeted population. These is particularly difficult for emerging and
low-income countries with large informal sectors, and therefore more limited sources of information on
employment and labor income (IMF 2020e). Prady et al. (2020) estimate that on average, countries have
spent an additional 1% of GDP to flex up pre-existing social programs—insurance, assistance, and labor
market-related—and to introduce new ones. Additional fiscal outlays have mainly financed the
expansion of social assistance systems to cover over 1.8 billion people worldwide (Gentilini et al. 2020).
Figure 12. Fiscal Assistance
Panel a. Data availability across government Panel b. Existing, additional, and total population
registries (by income group) coverage of monetary transfers during Covid-19
The Secretariat for the Independent Panel for Pandemic Preparedness and Response 11May 2021
Source: IMF (2020e) Source: Gentilini et al. (2020). Note: Sample of 57 countries.
EAP: East Asia and Pacific; ECA: Europe and Central Asia;
LAC: Latin America and Caribbean; MENA: Middle East and
North Africa; SA: South Asia; SSA: Sub-Saharan Africa.
There are three key success factors for the rapid and efficient delivery of government responses. First,
existing social-support infrastructure, the presence of which help manage the support of vulnerable
populations immediately and without the need for special response measures. Second, the strength of
the digital delivery, considering that these reliefs ought to reach the beneficiaries during lockdowns –
some of the quickest delivery vehicles have come from emerging markets (McKinsey 2020). Third, real-
time tracking: because traditional monitoring systems based on field surveys cannot do this job (due to
the low frequencies and lengthy-time lags of data collection and processing and the mobility restrictions
imposed worldwide), policymakers should rely on nontraditional, advanced analytics and data (updated
daily or weekly) to check the pulse on households and businesses.
3.3 The labor market channel
The pandemic is having disproportional effects on the most economically vulnerable segments of the
population. The Covid-19 shock affected workers and labour income differently, depending on the
composition of the workforce in terms of skills, occupation types, infrastructure (particularly, but not
exclusively, those lacking connectivity), and type of contractual relations (particularly, informal and self-
employed workers).
The precariousness of workforce influenced the economic impact through four distinct channels:
• the prevalence of informality and self-employment reduced the coverage of job retention and
furlough schemes (Escobari and Levy Yeyati, 2020),
• the limited ability to assign resources and attenuate the negative shock to the labor income of
precarious workers, in turn, reduced the effectiveness of social distancing (Levy Yeyati and
Sartorio 2020) (Figure 13)
The Secretariat for the Independent Panel for Pandemic Preparedness and Response 12May 2021
Figure 13. Smoothed Change in Employment by Occupation Wage Percentile
Sources: Levy Yeyati and Valdez (2020)
• the fact that lower-income economies have a lower share of jobs that can be done at home (Dingel
and Neiman 2020):1 conditions to telework depend on occupation and worker characteristics (Bick
et al. 2020) and on the available infrastructure (connectivity, access to digital devices, availability
of childcare and school services); and
• the bias of COVID-related restrictions against primarily low-wage, high-contact jobs such as
cleaning, hospitality, or health care activities, and the fact that remote jobs often require skills or
hardware that low-wage workers may not have (Figure 14).
This pattern, if persistent, does not bode well for developing economies. Due in part to the relative
abundance of unskilled labor, the adoption of new, labor-substituting technologies has been so far
slower, resulting in the past in less labor market polarization (Busso et al. 2020) and even declining-to-
stable inequality (Messina et al. 2020), albeit from very high levels and for varied reasons (Levy Yeyati et
al. 2014). But this delay in the introduction of new technologies implies that the acceleration effect of
the pandemic may be even more pronounced, as developing economies move swiftly from a labor-
intensive production mix to streamlined processes with leaner payrolls. For this reason, the COVID
impact on labor markets may be larger and more persistent than in the developed world due to the
prevalence of unskilled labor. 2
1 For instance, the authors show that, in 13 Latin American countries, the average share of teleworkable
jobs is only 20%—ranging from 14% in Honduras to 27% in Uruguay.
2 When comparing the impact on employment based on unemployment data for 2020, one has to bear
in mind that, in the US, the absence of furlough schemes implies that temporarily suspended workers
are added to the unemployed; hence, the sharp peak and fast decline in temporary unemployment in
the U.S. in the first semester, and the plateauing once labor dynamics start to reflect permanent layoffs.
The Secretariat for the Independent Panel for Pandemic Preparedness and Response 13May 2021
Figure 14. Lockdowns and Labour Market
Sources: Levy Yeyati and Valdez (2020)
3.4 Initial conditions and economic impact
What does the evidence say about the link between pre-existing conditions and the economic impact
of the pandemic? Can it be argued that nations with adequate fiscal space, state capacity, and labor
formality soften the impact of the COVID shock? Answering this question is not straightforward for
several reasons. COVID-19 hit countries with an intensity that is hard to quantify empirically and,
importantly, while the three identified pre-existing conditions amplified the impact, there were not
more important than the actual disease burden in terms of both the economic and socials costs of
coping with the pandemic.
While there is evidence that supports the hypothesis that pre-conditions help to mitigate the
economic costs of the pandemic, no comprehensive study addresses all pre-conditions at once. This is
in no small part because the economic costs are being continuously reassessed. An exception is The
World Bank (2020), which shows that the decline in economic activity in the second quarter of 2020 is
correlated with the number of cases and the stringency of the lockdown, as well as with per capita GDP,
a standard proxy for economic development (Table ). One should note, however, that the number of
cases may not be a reliable gauge of the intensity of the pandemic, as testing varied considerably across
countries and over time. Since a similar caveat applies to growth, the economic impact of COVID-19 is
often measured as the difference between pre- and post-Covid growth forecasts for the period 2020-21,
as we mostly do here.
The Secretariat for the Independent Panel for Pandemic Preparedness and Response 14May 2021
Table 1. Initial Conditions and Output 2020-Q2
Source: The World Bank (2021)
There is a link between fiscal space and fiscal stimulus. Benmelech et al. (2020) find that a country’s
credit rating is the most important determinant of its fiscal spending (and monetary expansion) during
the pandemic. Indeed, as noted, high-income countries entered the crisis with historically low (in real
terms, negative) interest rates and, as a result, were prone to using non-conventional monetary policy
tools such as quantitative easing. The World Bank (2020) has also found evidence that the COVID -19
impact is biased against informality, an aspect tightly related to per capita GDP, as low-income
economies, ill-equipped to provide fiscal and monetary support, are typically characterized by higher
levels of labor precariousness, which in turn is particularly high in (contact-intensive) service activities
that were more hardly hit by the pandemic (as Table reports).
We find evidence that preconditions affect the economic response to COVID. Table reports three basic
models: columns 1 and 2 regress the growth forecast revision on cumulative deaths per million (a proxy
for the intensity of the COVID shock), per capita GDP (alternatively, the labor informality rate), and
interactions with the shock. Results are as expected: per capita income mitigates the shock; informa lity
amplifies it. Column 3 regresses a measure of working hours lost against the shock and the informality
rate; the results point in the same direction: informality led to a greater hour loss. The findings are by no
means definitive but are indicative that these two preconditions may have played an amplifying role.
The Secretariat for the Independent Panel for Pandemic Preparedness and Response 15May 2021
Table 2. Initial Conditions and Economic Impact of the Covid Shock
(1) (2) (3)
Forecast revision Forecast revision Working hours lost
Ln (Deaths per million) 0.126 -5.266*** 0.341
(0.15) (-2.67) (0.35)
Labor informality 14.49*** -11.77
(2.02) (-1.18)
Ln (Deaths per million) x labor informality -3.181*** 4.788***
(-2.73) (2.73)
Ln (GDP per capita) -1.382
(-1.29)
Ln (Deaths per million) x Ln (GDP per capita) 0.393**
(1.97)
Constant -8.212* 13.61 2.917
(-1.46) (1.29) (0.45)
Observations 66 65 64
R2 0.222 0.261 0.463
Source: Authors’ estimations based on IMF-WEO, ILO, Ourworldindata.org.
There seems to be a weak link between state capacity and economic performance under COVID. The
role of state capacity is more difficult to define and, as a result, less often researched. 3 Here, as a proxy
for the lack of state capacity, we use the Index of State Weakness in the Developing World, which ranks
all 141 developing countries according to their relative performance in four critical spheres: economic,
political, security, and social welfare. We find this index negatively correlated to growth revisions, as
expected, but only weakly.
3Serikbayeva et al. (2020) study the link between state capacity and deaths from Covid-19. The state
capacity is proxied by the level of democracy, government policy responses, the share of the elderly
population, and health system resource capacity. The study presents strong evidence for the critical role
of state capacity in achieving positive policy outcomes.
The Secretariat for the Independent Panel for Pandemic Preparedness and Response 16May 2021
Figure 15. GDP losses vs. State Weakness
0
-0.02 0 2 4 6 8 10
Growth revision (Oct 2019 vs Oct
-0.04
-0.06 SDN
-0.08
2020
-0.1 AFG
-0.12
-0.14
ZWE
-0.16
IRQ
-0.18
-0.2
Overall State Weakness
Sources: IMF (2020c) and Rice and Patrick (2016)
In sum, while preconditions played a key part in the welfare impact of the pandemic, they appear to
have been also influential in buffering its impact on aggregate economic performance.
4. Dealing with the pandemic
While public policy responses varied across countries, we could identify two commo n features across
countries: the speed and the synchronicity of the responses. Indeed, by late March 2020, as much as
25% of the world population was under lockdown measures (Hale et al. 2020). Broadly, the policies
responses aimed at two broad objectives:
(a) reduce the spread of the virus and strengthen the health systems; and
(b) support households and firms that faced sudden income/revenue losses due to supply
and demand shortages, and the financial system to avert a spike in non-performing loans
and defaults.
Policymakers tackled the first objective through quarantines, lockdowns, and social distancing. These
policies played a critical role in slowing the transmission of the virus and reducing the stress on the
health care system –particularly in less developed countries with modest heath capacity. With large
heterogeneity across countries, these measures were complemented with higher health care spending
to ensure adequate capacity and resources. Predictably, these policies had a significant economic
impact: for instance, Demirgüç-Kunt et al. (2020) estimate that non-pharmaceutical interventions led to
a decline of about 10% in economic activity across Europe and Central Asia during 2020.
On the other hand, policymakers implemented different fiscal, monetary and regulatory measures to
tackle the second objective. Household support measures were especially relevant in developing
economies, where staying at home implied a sudden collapse of income as a larger share of workers are
informal and their families depend on their labour income to make ends meet (Loayza and Meza-Cuadra
2018; Busso et al. 2020). Many governments supported households through salary subsidies, relief from
The Secretariat for the Independent Panel for Pandemic Preparedness and Response 17May 2021
contractual obligations and debt, and conditional cash transfers. Governments provided liquidity
support through measures such as loans, equity injections, and guarantees to support firms. Some
governments also encouraged banks to make use of available capital and liquidity buffers to support
lending –at the risk of preserving nonviable “zombie” firms. These policies were complemented by a
sharp reduction of monetary policy rates and a sustained quantitative easing by central banks to relax
borrowing conditions in financial markets.
4.1 Cross-country evidence on lockdowns and economic activity
There is consensus that lockdown measures negatively affected economic activity. Several authors
point to a substantial role of lockdowns in the United States leading to employment losses, a substantial
decline in spending, and deterioration in local economic conditions (Brodeur, and Wright 2020; Coibion,
Gorodnichenko, and Weber 2020). Similar effects have been documented across different countries
(Carvalho and others 2020; Demirgüç-Kunt et al. 2020). The data provides suggestive evidence that the
stringency of lockdowns had a short-term economic impact, as measured by the GDP relative to pre-
pandemic forecasts. However, this evidence should be interpreted with caution given the large
heterogeneity displayed in the sample and the fact that there are important omitted variables (think, for
example, of the dependence on international inputs or capital, or the incidence of demographic,
geographical, and seasonal factors) as well as lagged effects.
Figure 16. GDP Forecast Error in 2020 H1 and Lockdown Stringency
0
0 10 20 30 40 50 60 70
2020:H1 GDP Forecast error (percent)
-5
-10
-15
-20
-25
Lockdown stringency (index, average in 2020:H1)
Source: IMF WEO Oct-20
The Secretariat for the Independent Panel for Pandemic Preparedness and Response 18May 2021
Figure 17. Lockdowns and Economic Activity
Source: IMF WEO Oct-20
There is an incipient consensus that, while strict lockdowns helped reduce the circulation of the virus
at an early stage, their impact declined over time due to “lockdown fatigue”. Based on studies using
the University of Oxford ´s Lockdown Stringency Index (and its sub-components) and Google’s Mobility
Index for a cross section of more than 100 countries, we can list a few stylized preliminary facts: 1)
lockdowns (particularly, restrictions on public events and private gatherings) have a large effect both on
mobility and COVID-19 cases at the initial stage of the pandemic (Askitas et al., 2020; Wong et al., 2020);
2) the early effectiveness of lockdowns on reproduction and related deaths was heterogeneous ,
depending on country-specific factors such as average daily temperature, population density, health
system quality and age structure (Deb et al., 2020; Li et al., 2020; Goldstein et al, 2020); 3) compliance
(as measured by the response of the Mobility Index to changes in the Stringency Index) declined over
time, and was particularly weak in emerging and developing countries where, in part for this reason,
lockdowns were particularly stringent and long (Levy Yeyati and Sartorio, 2020; Goldstein at al., 2020;
and Figure 18); 4) the effectiveness of lockdowns declined over time, in part (but not solely) as a result
of a weaker compliance (Goldstein et al., 2020; Caselli et al, 2020).
The Secretariat for the Independent Panel for Pandemic Preparedness and Response 19May 2021
Figure 18. Impact of Lockdowns and Voluntary Social Distancing
Source: IMF WEO 2020-Oct
Several papers point to the large contribution of voluntary social distancing as a key factor affecting
mobility and the economy. Aum, Lee, and Shin (2020), Goolsbee and Syverson (2020), Maloney and
Taskin (2020), and Levy Yeyati and Sartorio (2020) show that mobility has been tightly correlated with
the spread of Covid-19 –mobility declines after a steady increase in daily deaths, and vice versa– even
after controlling for government lockdowns. This implies that the pandemic affects the economy beyond
the intensity of a lockdown, a pattern that was estimated and reported in the IMF´s WEO (2020) by
decomposing variations in mobility into a component explained by official restrictions (again, proxied by
the Stringency Index) and a residual, and then modeling changes in economic activity due to each of the
two components. As can be seen in Figure 18, there is a considerable portion of the economic impact
that could be attributed to voluntary distancing –or, more rigorously, to actions that are orthogonal to
variations in lockdown intensity–, particularly in advanced economies. In addition, compliance with de
jure restrictions over time depends on socioeconomic conditions such as per capita income or labor
precariousness (Levy Yeyati and Sartorio, 2020) (Figure 19), which suggests that long lockdowns in
middle-to-low-income countries may lose their impact and –to the extent to which non-compliance
extends to social distancing in general– even be counterproductive.
The Secretariat for the Independent Panel for Pandemic Preparedness and Response 20May 2021
Figure 19. Correlations between compliance with Real GDP per capital
and Urban Labor Precarity, June 22th
Sources: Levy Yeyati and Sartorio (2020) based on Oxford COVID-19 Government Response Tracker (OxCGRT), Google COVID-19 Community Mobility
Reports, World Bank and International Labor Organization
4.2 Fiscal response to the pandemic
The size, composition, and evolution of fiscal support have varied widely because of country
circumstances. Three stylized facts help to draw some intuition of the drivers behind this diversity. On
average, countries that deployed smaller fiscal packages (i) put in place strong containment measures,
such as mobility restrictions, early on (before COVID-19 cases peaked), (ii) have lower per capita income
(a broad proxy for development), and (iii) have higher borrowing costs (wider sovereign bond spreads)
that limit their capacity for on-budget support.
The Secretariat for the Independent Panel for Pandemic Preparedness and Response 21May 2021
Figure 20. Discretionary Fiscal Response to the Covid-19 Crisis and Country Preconditions
Panel a. Fiscal Support and Stringency of Early Containment Panel b. Fiscal Support and Initial Income per Capita
AEs AEs
40 40.0
EMDEs EMDEs
Fiscal package (percent of
Fiscal package (percent of
30 30.0
20 20.0
GDP)
GDP)
10 10.0
0 0.0
0 20 40 60 80 100 0 20 40 60 80 100 120
Early stringency of mobility restrictions (index 0-100) GDP per capita, 2019 (thousands of US dollars, PPP)
Panel c. Fiscal Support and Initial Sovereign Spreads
20 AEs
On-budget support (percent
EMDEs
15
of GDP)
10
5
0
-5 0 5 10 15 20
10-year sovereign bond spreads, 2019 (ppt)
Sources: OxCGRT Database; IMF, World Economic Outlook database; and IMF staff estimates. Note: Sovereign spreads are computed over 10-year US
Treasury bond yields for non-European economies and 10-year German bund yields for European economies. Grey trend lines in panels 1 and 2 refer to both
AEs and EMDEs; blue and orange trend lines in panels 3 and 4 refer to AEs and EMDEs, respectively. AEs = advanced economies; EMDEs = emerging market
and developing economies; PPP = purchasing power parity; ppt = percentage point.
Debt-funded fiscal stimuli in advanced economies contrast with modest ones in developing countries,
where central bank financing has been more prevalent. The main fiscal measures are outlined below:
• Wage subsidies. Furlough programs for businesses with revenue losses have been particularly
effective in preserving employment linkages in advanced economies with a majority of salaried
workers (Barrero et al. 2020). 4
• Cash and in-kind transfers5 . Particularly effective in protecting the disposable income of the poor
when means-tested and targeted to those most likely to spend, existing cash transfer programs
4The take-up of job retention schemes averaged one-quarter of employees in OECD economies.
5Bronka et al. 2020 estimates that means-tested universal credit allowance fully offset the adverse
impact of the pandemic on poverty in the U.K. On the other hand, Chetty et al. 2020 estimate that in the
United States, however, higher-income households that received “stimulus checks” under the
Coronavirus Aid, Relief, and Economic Security Act have spent less than lower-income households that
received those checks, and on goods less affected by the lockdown, such as durables, limiting the
aggregate impact.
The Secretariat for the Independent Panel for Pandemic Preparedness and Response 22May 2021
coverage were expanded and supplemented with the distribution of food and hygiene items, and
other voucher programs. These policies provided complementary coverage to vulnerable
households, particularly in developing economies with larger informal sectors where job retention
programs had limited impact.
• Loans and guarantees. While governments announced significant programs to provide liquidity
to cash-strapped businesses, most programs had a low take-up explained by design issues (large
loan size and low coverage of the guarantees), administrative capacity constraints or program
conditionality, liquidity buffers in less-affected sectors and firms, the availability of other forms of
government support such as grants and wage subsidies (Anderson, Papadia, and Véron 2020), and
private debt overhang.
• Equity injections. In some cases (New Zealand, Singapore), governments provided convertible
loans to national airlines with options to convert bonds into common equity, which ensured that
the risks and rewards are better shared by the state and shareholders (OECD 2020a). In France,
airline support was combined with conditionality on cutting emissions, which helps foster a
“greener” recovery.
• Tax measures. Many countries extended deadlines and deferred payment of taxes (OECD 2020b;
Djankov and Nasr, 2020) to support household and firm liquidity, albeit with a relatively low
impact given that tax burdens were already limited by low sales and reduced profits (OECD
2020b)6 . Additionally, tax-based support was less effective in emerging and developing economies
because of the presence of widespread informality.
• Payment forbearance policies. These policies included moratoriums facilitated by government
support or public enterprises on payments of mortgages (United States), utilities (Argentina,
Colombia, Japan), rents (China), or loans (Argentina, Turkey) and provided short-term relief to
households and businesses, including in informal sectors, to buffer the impact of the crisis on
disposable income.
6These measures were implemented through tariff waivers on medical supplies (Colombia, Vietnam),
accelerated VAT refunds (France, Indonesia), new and expanded loss carry-back rules (China, New
Zealand, Japan), accelerated depreciation deductions (Australia) and reduced social security
contributions (Argentina, China, France, Korea).
The Secretariat for the Independent Panel for Pandemic Preparedness and Response 23May 2021
Table 3. Fiscal and monetary response to the pandemic
Maintain Monetary-policy actions Provide quantitative easing/liquidity injections
financial Reduce interest rates
stability
Maintain Support of critical needs Maintain household disposable incomes (Cash and
household in-kind transfers)
economic
Ease household expenses/financial obligations
welfare
(payment forbearance policies)
Help Liquidity/cash-flow Postpone government fees/receivables and non-
companies improvements debt obligations (payment forbearance policies)
survive the
Balance-sheet interventions Provide equity interventions (equity injections)
crisis
Restructure debt and defer loans (loans)
Guarantee funds (guarantees)
Companies cost reduction Reduce/eliminate government fees (tax measures)
Compensate/reduce salary costs (wage subsidies)
Source: Author’s elaboration based on McKinsey (2020)
Figure 21. Increase in the Coverage of Social Assistance (in % of the population)
45
40 Cash coverage
In-kind coverage
35
30
13 22
25
20 1
7
15
10 20 22 22
17 15
14
5
6 3
0 2
EAP ECA LAC MENA NA SA SSA Global
Source: Gentilini et al. (2020). Note: EAP = East Asia and Pacific; ECA = Europe and Central Asia; LAC = Latin America and th e
Caribbean; ENA = Middle East and North Africa; NA = North America; SA = South Asia; SSA = sub-Saharan Africa.
There are several fiscal risks associated with the duration of the aforementioned policies in the event
of a lengthening of the pandemic:
• A protracted economic downturn. The lack of widespread availability of effective therapies or a
vaccine implies a considerable risk for recovery. This could mean more bankruptcies, further
deterioration in banks’ balance sheets, and a greater need for fiscal resources to support and
retrain unemployed workers at a time when debt ratios and bas e money are already quite
stretched in many developing countries.
The Secretariat for the Independent Panel for Pandemic Preparedness and Response 24May 2021
• Tightening of financial conditions. The rapid growth in sovereign and private debt stocks,
particularly among non-financial corporations, and the need to service those debts, has left
government budgets and private entities more exposed to changes in financing conditions and
potential debt overhangs (depressed investment due to the anticipation of future taxes to pay
current debt).
• Commodity market volatility. Commodity price fluctuations impact commodity exporters and
importers differently. A sharp fall in oil prices would further undermine the already-stretched
budgets of oil exporters but could also provide importers with some relief. Conversely, the
ongoing boom in food items could put additional pressure on commodity importers in the
developing world.
• Contingent liabilities. Although new guarantees remain largely untapped by firms to date, their
use of guarantees may accelerate and could eventually be called in the event of a new fall in
economic activity, adding to public indebtedness and fiscal needs.
To a lesser extent, there are also upside fiscal risks. These include the rapid development and wide
distribution of a safe, affordable, and effective vaccine; changes in economic structures that boost
productivity through new techniques or technologies; or the normalization that proceeds faster than
expected in areas that have reopened without sparking new outbreaks of infections. Realization of these
outcomes would imply a faster economic recovery than expected, thereby reducing the necessary fiscal
support.
Public investment could play a central role in the post-pandemic scenario. Countries have redirected
resources budgeted to public investment to finance the measures discussed above. In this vein, it could
help revive economic activity and create new low-skilled jobs in the short term. IMF (2020f) estimates
that increasing public investment by 1% of GDP could strengthen confidence in the recovery and boost
GDP by 2.7%, private investment by 10%, and employment by 1.2% (Figure ). The impact is magnified
due to the uncertainty on the economic outlook that depressed private investment, potentially inducing
a crowding-in of private resources. To be sure, these estimates assume that the existing public and
private debt burdens do not jeopardize the response of the private sector to the stimulus, which
remains a considerable source of risk; because of that, they are more relevant for developed countries
under the assumption of the continuation of extremely low interest rates.
The Secretariat for the Independent Panel for Pandemic Preparedness and Response 25May 2021
Figure 22. Amplifying effects of public investment
Source: IMF (2020f)
We believe risks are balanced but biased against developing countries. Vaccine rollouts and new
mutations may find many developing countries ill-prepared. Because those countries where vaccine
supply may be a constrained are often low-income ones with limited fiscal space, delays due to
production hurdles or beggar-thy-neighbor competition for jabs will likely translate into wider cross-
country inequality. Moreover, remaining risks are still uncertain and likely to affect economies
differently. For example, even if vaccines prevent deaths, they may not reduce circulation as expected;
vaccine hesitancy, particularly high among young people, may slow down vaccine rollouts (paradoxically,
relaxing the supply constraint); and virus mutations may not only feed people´s fears and delay a return
to normality but may also require further vaccination (or boosts) down the road. While all this would be
especially problematic for developing countries without the resources to cope with a second wave –
which, as a result, may see new waves that hinder economic activity in 2022–, it also represents a hurdle
to the recovery of cross-country transportation and migration, with global consequences. Globally-
minded governments and multilateral institutions should anticipate, internalize and address these
risks before they are realized.
5. The role of IFIs
Global liquidity and capital flight, short-lived as it was (see section 2), affected countries in very
different ways. To analyze this, it is useful to distinguish four groups of countries: advanced (benefited
by near-zero interest rates), emerging markets in good standing (where the increase in sovereign risk
premiums was largely offset by the decline in risk-free interest rates leaving borrowing costs near pre-
Covid levels), emerging markets in crisis (with significant private debt ratios and limited or no access to
private refinancing, hence dependent on multilateral lending), and frontier markets (with limited or no
private financing, reliant on –mostly concessionary– multilateral and bilateral lenders and donors).
The injection of global liquidity by central banks helped countries selectively. It was positive for the
first group and –to a lesser extent– the second group by enabling the funding of fiscal stimuli, but was at
best neutral for the third (rationed from capital markets due to their domestic crises) and the fourth
(with no private funding). This exacerbated the long-standing conundrum faced by the international
The Secretariat for the Independent Panel for Pandemic Preparedness and Response 26May 2021 financial community during global crises: those with access to multilateral support do not need it; those with needs cannot access it. The IMF created new liquidity windows to help emerging economies cope with capital flight. The Fund has two types of programs: back-loaded conditional ones (e.g., Stand by agreements) tailored to deal with fundamental macroeconomic misalignments, and front-loaded unconditional ones (e.g., FCL and PCL, as well as the new SLL) aimed at external liquidity shocks to otherwise well-behaved economies. As a result, economies with a less-than-stellar track record hit by an external shock remain unattended. Recognizing this gap, in April 2020 the IMF launched the Rapid Financing Instrument (RFI) that “provides rapid and low-access financial assistance to member countries facing an urgent balance of payments need, without the need to have a full-fledged program in place” (IMF 2020a) and the RCF, a similar line available “only to low-income countries eligible for concessional financing”, in addition to transitorily extending the size of these emergency loans (from 50 to 100 percent of quota). Despite all these efforts, the use of the facilities has been rather modest: about $250 billion out of its $1 trillion lending capacity (as of December 21, 2020), centered on countries without financial constraints. More importantly, this use was concentrated in the unconditional liquidity windows, primarily the RFI, which were used by many as a financial backstop against a persistent increase in borrowing costs, reflecting a well-known reluctance from governments to engage in an IMF program due to reputation and political s tigma. Another attempt to make up for potential liquidity problems in the developing world was the proposal to issue SDRs, the IMF´s basket currency. Such a move, emulating a similar one in the context of the 2009 global financial crisis, is the international equivalent to a central bank´s transfer to finance the Treasury and would have benefitted all IMF member countries. Advocated by many experts (see, e.g., Gallagher et al., 2020), it was ultimately stalled by the opposition of the U.S. government, but remains a likely outcome under the Biden administration. A third initiative that also received wide support from experts and multilaterals was a debt relief for low- and middle-income economies to enhance their fiscal space. The proposal is based on the view that, because countries suffered a permanent loss and a persistent impairment of their growth potential, concessionary lending is not enough and a true transfer, in the form of a nominal debt haircut, is needed. In the end, the initiative received a lukewarm response from the private sector and key bilateral lenders, such as China, and was narrowed down to a temporary suspension of debt service under which 73 countries are eligible for a temporary suspension of debt-service payments to official bilateral creditors through June 2021. 7 Other ideas to fill in the gaps of the international financial architecture were floated during the year, with no success. The creation of a Special Purpose Vehicle (SPV) to be used to leverage countercyclically the investment-grade rating of multilaterals or regional reserve funds in times of historically low interest rates failed to stir the interest of potential beneficiaries that, as noted above, did not perceive liquidity as a relevant restriction. Similarly, calls for a recapitalization of multilateral lending institutions were weakened by the fact that existing multilateral resources were far from exhausted by demand and, 7Note that, since these economies receive grants and concessional loans, any debt service suspension by bilateral official donors is likely to be offset by a smaller amount of new funds from the same source, with limited or no effect on the availability of finance in the short term. The Secretariat for the Independent Panel for Pandemic Preparedness and Response 27
May 2021

overall, by the combination of low financing costs in high- and middle-income economies and solvency,
as opposed to liquidity, concerns in low-income ones.

6. Estimating the economic costs of the pandemic
To complement the previous analysis, in this section we present a back-of-the-envelope, preliminary
assessment of the economic cost of Covid-19. As will become clear below, this is an indicative exercise,
modelled in blocks so that the reader can decide what to include, and open-ended as the crisis is still
ongoing and the numbers used are broad projections under permanent revision.
First, we approximate the output loss over a 10-year window. We accumulate the differences between
the realized real GDP in 2020 and the one projected right before the pandemic, and between pre- and
post-COVID projections for 2021-2030 (the shaded area compares pre-Covid real GDP growth forecast
from the WEO of October 2019 with the most current, upgraded forecast from the WEO April-2021),
discounted at a 0% real interest rate. The calculation yields a total equal to 53% of the 2019 global GDP.
                        Figure 20. Global GDP Projections (in constant USD, index 2017=100)
             170

             165

             160

             155

             150

             145

             140

             135

             130

             125

             120
                        2017        2018        2019        2020        2021       2022    2023   2024   2025

                                                       Oct-19           Oct-20        Apr-21

                                           Sources: IMF WEO Oct-2019, Oct-2020 and Apr-2021

Second, we add the economic costs of the fiscal stimuli. There are several complex, non-linear channels
influencing the realized and future output losses that are not incorporated in the GDP forecasts. In
particular, we need to address the 15% of GDP global fiscal stimulus without which the output loss in
2020 would have been much steeper. How much of this stimulus should be regarded as a cost? This is a
non-trivial exercise for various reasons, including because almost half of the stimulus was below the line
(loans, equity stakes, guarantees) with a cost that is contingent on the speed and composition of

The Secretariat for the Independent Panel for Pandemic Preparedness and Response                                     28
You can also read