Society of Actuaries Research Brief Impact of COVID-19 - May 1, 2020 - SOA
←
→
Page content transcription
If your browser does not render page correctly, please read the page content below

Society of Actuaries Research Brief
 Impact of COVID-19
 May 1, 2020

May 2020
2

Society of Actuaries Research Brief
Impact of COVID-19
May 1, 2020

AUTHORS                 R. Dale Hall, FSA, MAAA, CERA, CFA
                        Cynthia S. MacDonald, FSA, MAAA
                        Peter J. Miller, ASA, MAAA
                        Achilles N. Natsis, FSA, MAAA
                        Lisa A. Schilling, FSA, EA, FCA, MAAA
                        Steven C. Siegel, ASA, MAAA
                        J. Patrick Wiese, ASA

REVIEWERS               Michael C. Dubin, FSA, FCAS, FCA, MAAA
                        Timothy J. Geddes, FSA
                                             , EA, FCA, MAAA
                        Daniel J. Geiger
                                      , PhD
                        Umesh Haran, FSA, ACIA, CERA
                        Jing Lang, FSA, FCIA
                        Ronald Poon Affat, FSA, FIA, MAAA, CFA
                        Benjamin C. Pugh, FSA, MAAA
                        Max J. Rudolph, FSA, MAAA, CERA, CFA
                        Nazir Valani, FSA, FCIA, MAAA
                        Greger Vigen

Caveat and Disclaimer

This study is published by the Society of Actuaries (SOA) and contains information from a variety of sources. The study is for informational purposes only
and should not be construed as professional or financial advice. The SOA does not recommend or endorse any use of the information provided in this
study. The SOA makes no warranty, express or implied, or representation whatsoever and assumes no liability in connection with the use or misuse of this
study.

Copyright © 2020 by the Society of Actuaries. All rights reserved.

                                                                                                                  Copyright © 2020 Society of Actuaries
3

CONTENTS
Introduction.............................................................................................................................................................. 5
Key Statistics............................................................................................................................................................. 6
       Reported Cases .............................................................................................................................................................. 6
                Worldwide Cases ............................................................................................................................................... 6
                U.S. and Canadian cases .................................................................................................................................... 7
       Case Fatality and Mortality Rates ................................................................................................................................. 9
                CFRs by Age Group ............................................................................................................................................ 9
                U.S. Subpopulations ........................................................................................................................................ 11
                CFR Limitations ................................................................................................................................................ 11
                Reported Cases vs. Actual Cases..................................................................................................................... 14
       Comparison to Past Pandemics and Influenza ........................................................................................................... 15
                COVID-19 and Past Epidemics and Pandemics .............................................................................................. 15
                COVID-19 and Influenza .................................................................................................................................. 16
       Health Care Cost and Utilization ................................................................................................................................. 18
                Supply of Medical Resources .......................................................................................................................... 19
                Hospitalization Rates ....................................................................................................................................... 19
                Comorbidities .................................................................................................................................................. 24
                COVID-19 Treatment ....................................................................................................................................... 26
                Non-COVID-19 Health care ............................................................................................................................. 28
                Mental Health .................................................................................................................................................. 28
       Infection Spread Rate .................................................................................................................................................. 28
Economic and Asset Impact .................................................................................................................................... 30
      Macroeconomic Variables ........................................................................................................................................... 30
      Asset Values and Volatility........................................................................................................................................... 33
      Low Interest Rate Environment .................................................................................................................................. 35
      Reinvestment and Default Risk ................................................................................................................................... 35
Impact on Insurance Industry.................................................................................................................................. 37
       Impact on Life Insurance Companies .......................................................................................................................... 37
       Impact on Health Insurance Companies ..................................................................................................................... 38
       Impact oN Property/Casualty Coverages .................................................................................................................... 41
              Business Interruption Insurance ..................................................................................................................... 41
              Cancellation Insurance .................................................................................................................................... 41
              Workers’ Compensation ................................................................................................................................. 41
              Personal Automobile Insurance...................................................................................................................... 42
              Medical Malpractice Insurance ...................................................................................................................... 43
              Financial Guaranty/Mortgage Guaranty ........................................................................................................ 43
       Changes in Insurance Regulation and Contractual Requirements ............................................................................ 43
       Cyber Risk ..................................................................................................................................................................... 44
Impact on Retirement Plans .................................................................................................................................... 44
       Corporate Defined Benefit Retirement Plans ............................................................................................................. 45
       Multiemployer Defined Benefit Retirement Plans ..................................................................................................... 46
       Public Defined Benefit Retirement Plans.................................................................................................................... 46
       Defined Contribution Retirement Plans ..................................................................................................................... 47
Operational and Emerging Risks.............................................................................................................................. 47
      Reopening .................................................................................................................................................................... 47
      Hospital Operations ..................................................................................................................................................... 49
      Food Supply Risks......................................................................................................................................................... 51

                                                                                                                                                    Copyright © 2020 Society of Actuaries
4
Remote Work ............................................................................................................................................................... 52
Employment Law ......................................................................................................................................................... 53
Internet Service Provider and Virtual Private Network Capacity .............................................................................. 53
Fraud 53
Stockpiling .................................................................................................................................................................... 54
Event Cancellations and Restaurant Closings............................................................................................................. 54
International Trade Dependency ................................................................................................................................ 55
Alternative Entertainment Distribution ...................................................................................................................... 55
Risk of Extreme Weather and Other Natural Hazards ............................................................................................... 55
Previous SOA Research Highlights ........................................................................................................................... 57
Impact on the U.S. Life Insurance Industry................................................................................................................. 57
Comparison to Current COVID-19 Events................................................................................................................... 57
Impact on the U.S. Health Insurance Industry ........................................................................................................... 58
Low and Negative Interest Rate Research .................................................................................................................. 58
End Notes ............................................................................................................................................................... 60
Additional References ............................................................................................................................................. 72
Key Statistics................................................................................................................................................................. 72
Economic and Asset Impact ........................................................................................................................................ 73
Operational and Emerging Risks ................................................................................................................................. 74
Appendix: Additional Data ...................................................................................................................................... 75
Worldwide Data ........................................................................................................................................................... 75
U.S. Data ....................................................................................................................................................................... 76
Canadian Data .............................................................................................................................................................. 77
About The Society of Actuaries ............................................................................................................................... 78
Copyright © 2020 Society of Actuaries5
Society of Actuaries Research Brief
Impact of COVID-19
May 1, 2020
Introduction
In late December 2019, doctors in the city of Wuhan, China, began to piece together information from several
medical cases showing similar symptoms. As 2019 ended, Chinese officials announced a pneumonia-like outbreak
and began to identify a “novel coronavirus” linked to the cases. By January 23, over 600 cases had been confirmed, 1
and Wuhan and other areas in China instituted social distancing policies and travel restrictions. 2 On March 11,
World Health Organization (WHO) publicly characterized COVID-19 as a pandemic, 3 and on March 13, the United
States declared the COVID-19 outbreak a national emergency. 4
Even with “stay at home” orders issued in many countries, 5 by April 2, the disease had spread to nearly all corners of
the world. By April 29, 2020, the number of confirmed cases involving the novel coronavirus now named “SARS-CoV-
2”—which causes the respiratory disease now named “coronavirus disease 2019” (COVID-19) 6—was nearly 3.2
million worldwide with general agreement that the number is higher due to delays in full testing and reporting in
many countries. Approximately 170 countries have reported at least one case and about 227,000 deaths have
resulted from COVID-19. 7 It is important to recognize that the number of reported cases for any disease typically
lags behind the number of actual cases. As a result, the number of reported cases typically continues to rise after
the actual number of new cases declines. A key differentiation among some countries is the speed at which they
have ramped up testing and identification processes across their populations.
The health, mortality and economic focus is of unprecedented international concern compared to recent times.
Financial markets have seen high volatility as new economic information becomes available, monetary policies are
implemented, and value and opportunity come in and out of favor with investors. Supply chains of international
operations are greatly impacted as well, as many major worldwide manufacturers are evermore connected across
continents. Unemployment rates have risen as the world adjusts to lower levels of economic activity.
A confluence of risks has come together. Operational and financial risks have emerged, compounding the current
situation. Actuaries will be watching for any additional risk events that layer on to the current environment,
especially ones that may cause additional property, mortality and health risks such as catastrophic weather events.
This update to the Society of Actuaries (SOA) Research Brief on the Impact of COVID-19 has been constructed to
highlight some of the key continuing and new features of the pandemic all around the world and contemplate the
risks for the actuarial profession to consider in their work. Significant changes to the previous edition of this report,
other than updates to numbers, graphs and tables, have been highlighted for ease of finding them.
Copyright © 2020 Society of Actuaries6
Key Statistics
REPORTED CASES
WORLDWIDE CASES
National health organizations around the world have been fast at work in connecting with health care providers to
collect current case information. Confirmed cases are a function of the ability for any public health agency across
countries to distribute, administer and collect results from their respective health systems. Through April 29, 2020,
approximately 3.2 million cases have been reported worldwide. Eight countries comprise nearly 70% of the world’s
cases, with slightly more than half (52%) of the world’s cases in four countries: U.S., Spain, Italy and United Kingdom.
Figure 1 shows the weekly progression of confirmed cases for the 15 countries that have reported the most COVID-
19 cases as of April 29, 2020.
Figure 1
CONFIRMED COVID-19 CASES FOR 15 COUNTRIES WITH THE MOST CONFIRMED CASES, APRIL 29, 2020
Number of Cases Confirmed During Period Ending...
29-Jan 26-Feb 25-Mar 1-Apr 8-Apr 15-Apr 22-Apr 29-Apr % of World
U.S. 32.6%
Spain 7.4%
Italy 6.4%
U.K. 5.2%
France 5.2%
Germany 5.1%
Turkey 3.7%
Russia 3.1%
Iran 2.9%
China 2.6%
Brazil 2.5%
Canada 1.7%
Belgium 1.5%
Netherlands 1.2%
Peru 1.1%
0 200 400 600 800 1,000 1,200
Thousands
Data source: Johns Hopkins University
On April 28, 2020, the number of confirmed cases within the U.S. surpassed the 1 million mark, a significant
milestone. Further, the number of confirmed cases in the U.S. is about 4 times the number of confirmed in Spain,
the country with the second most confirmed cases in the world. However, the U.S. is far more populous than Spain.
To put the number of reported cases in context of country size, consider the number of confirmed cases per million
of population. Figure 2 shows that cases per million vary significantly by country. For Figure 2, the day that a
country’s reported cumulative COVID-19 cases per million reached or exceeded 10.0 is considered day zero (day 0).
The appendix includes a table showing data from Figure 2.
Copyright © 2020 Society of Actuaries7
Figure 2
TOP 50 COUNTRIES FOR CONFIRMED COVID-19 CASES PER MILLION, APRIL 29, 2020
6,000
Spain: 7-Mar, 5,069
Qatar: 11-Mar, 4,436 Switzerland: 4-Mar, 3,423
5,000
Belgium: 7-Mar, 4,147 Italy: 27-Feb, 3,362
Ireland: 13-Mar, 4,148
4,000
France: 6-Mar, 2,535
U.S.: 15-Mar, 3,157 Netherlands: 7-Mar, 2,270
3,000 Sweden: 6-Mar, 2,023
Singapore: 14-Feb, 2,695
Day 0
2,000
Canada: 16-Mar, 1,413 Bahrain: 25-Feb, 1,780
Kuwait: 27-Feb, 889
1,000 World: 22-Feb, 413
South Korea: 23-Feb, 210
China: 2-Feb, 59
0 12
0 5 10 15 20 25 30 35 40 45 50 55 60 65 70 75 80 85 90
Days Since Cumulative Cases Per Million Exceeded 10.0
Data source: Johns Hopkins University
U.S. AND CANADIAN CASES
Figure 3 shows cases per million for U.S. states confirmed cases per million of at least 10.0 as of April 29, 2020. And
Figure 4 shows the equivalent for Canadian provinces. Refer to the appendix for data from the figures.
It is important to recognize that these data show reported cases, not actual cases. Major differences exist between
testing and reporting, and the differences vary by country. Countries with the highest reported case rates likely
reflect serious infection rates, while countries with low reported case rates may reflect slower reporting or
underreporting. For example, as of early March, Indonesia, the world’s fourth most populous country, had reported
only two cases. Epidemiologists noted this was implausible and statistically impossible, especially given Indonesia’s
close ties to China and visits between the two countries. 8
Copyright © 2020 Society of Actuaries8
Figure 3
CONFIRMED CASES PER MILLION BY U.S. STATE, APRIL 29, 2020
14,000
New Jersey: 16-Mar, 13,101
New York: 12-Mar, 12,684
12,000
10,000
Connecticut: Massachusetts: 11-Mar, 8,744
16-Mar, 7,508 Rhode Island: 13-Mar,
8,000
7,785
Louisiana: 14-Mar, 5,950
6,000
D.C.: 16-Mar, 5,818
4,000 Delaware: 17-Mar, 4,780
U.S.: 15-Mar, 3,157
2,000 Washington: 6-Mar, 1,848
0 31
0 5 10 15 20 25 30 35 40 45 50 55 60 65
Days Since Cases Per Million Exceeded 10
Data source: Johns Hopkins University
Figure 4
CONFIRMED CASES PER MILLION BY CANADIAN PROVINCE, APRIL 29, 2020
6,000
Quebec: 16-Mar, 5,714
5,000
Nova Scotia: 16-Mar, 2,179
4,000 Newfoundland and
Labrador: 17-Mar, 1,193
3,000 Ontario: 13-Mar, 2,578
Alberta: 13-Mar, 2,528
Canada: 16-Mar, 1,413 Saskatchewan:
2,000 16-Mar, 679
British Columbia:
8-Mar, 933
1,000
Prince Edward Island:
15-Mar, 391
0 14
0 5 10 15 20 25 30 35 40 45 50 55 60
New Brunswick: 16-Mar, 352
Days Since Cases Per Million Exceeded 10
Data source: Johns Hopkins University
Copyright © 2020 Society of Actuaries9
CASE FATALITY AND MORTALITY RATES
The ultimate rate of mortality from COVID-19 will evolve over time, after the actual number of cases, rather than
the reported number of cases, is better understood. 9 This may take years.
At the start of a pandemic, mortality rates are crudely estimated using a statistic known as the “case fatality rate”
(CFR), which divides the known deaths by the identified number of cases. 10 Using this methodology and the Johns
Hopkins University database through April 14, 2020, the COVID-19 CFR across the worldwide set of case information
is 6.4%. These raw estimates, however, often are adjusted to produce updated rates, due to the current likelihood
of underreporting of actual cases. Some key health officials in the U.S. expect an ultimate case fatality rate from the
disease, once all known cases are included in the calculation, to settle in the 0.1%–1.0% range. 11
Many potential cases may yet be identified in some countries due to limited supply of testing kits and a reduced
ability to process tests in laboratory settings. In addition, individuals with asymptomatic and mild cases of the
disease may not actively seek treatment in the local health care systems. Death rates are also substantially impacted
by other factors such as age, smoking and social interactions in each country.
Initial CFRs in the U.S. ranged between 3.5% and 4.5%, slightly higher than the worldwide rate, primarily due to the
disease initially being seen in higher age groups, per the Centers for Disease Control and Prevention (CDC). As more
cases have been identified, the CDC’s estimate of the U.S. CFR has trended downward to the 1.8%–3.4% range. 12
As of April 14, 2020, the U.S. CFR was 4.3%, based on Johns Hopkins University data. Because the pandemic is
rapidly evolving, the U.S. CFR is likely overstated because the number of new cases each day has been increasing
significantly. In Hubei province, China, where the pandemic began, the number of new cases daily had declined to a
relatively small level by the beginning of March. The stability of the Hubei province data reduces the risk of CFR
overestimation. 13 As of April 14, the CFR for Hubei province, China, was 4.8% compared to 4.7% for each day from
March 23 through April 12, 2020.
While the CFR is a useful starting point for mortality analysis, it does not address the fact that some symptomatic
individuals—particularly those with mild symptoms—may be excluded from the data. With enough time,
researchers may be able to assemble the information required to estimate the size of this pool of individuals. The
estimate can be used to calculate the symptomatic case fatality rate, which is equal to the number of deaths divided
by the estimated number of individuals who developed symptoms associated with the virus. Joseph T. Wu and other
researchers estimated the COVID-19 symptomatic case mortality rate for Wuhan—the capital city of Hubei province
and the location of most of the COVID-19 deaths in the province—to be 1.4%, with a 95% confidence interval
running from 0.9% to 2.1%. 14
CFRS BY AGE GROUP
CFR and mortality rates by age have become available as the pandemic progresses. Figure 5 compares ranges of
COVID-19 CFR by age group in the U.S. estimated by the CDC to the most recent mortality rates for the U.S. general
population computed by the Social Security Administration. For someone between the ages of 45 and 84 who
contracts COVID-19, the probability of dying from COVID-19 is generally higher than the probability of dying from all
other causes combined. However, the chance that children who become infected with COVID-19 die from it is nearly
zero, much lower than their mortality rates from all other causes combined.
Copyright © 2020 Society of Actuaries10
Figure 5
U.S. GENERAL POPULATION MORTALITY AND COVID-19 CASE FATALITY RATE RANGES BY AGE GROUP
Range Values
0% 5% 10% 15% 20% 25% 30% 35%
Low High
85–100 10.4% 27.3%
75–84 4.3% 10.5%
Age Group
65–74 2.7% 4.9%
55–64 Probability of Death, All Causes 1.4% 2.6%
COVID-19 Case Fatality Rate
45–54 0.5% 0.8%
20–44 0.1% 0.2%
0–19 0.0% 0.0%
Data sources: Centers for Disease Control and Prevention, Morbidity and Mortality Weekly Report, March 27, 2020 (published as early
release March 18, 2020); Social Security Administration Period Tables for 2016, the most current tables available.
CFRs have also been calculated by age group in China, Italy, Spain and South Korea as shown in Figure 6. Italy has the
highest rate in most age groups, while South Korea has the lowest CFR in most age groups. The range of CFR across
these countries is greatest at the older age groups. CFR for the 70–79 age group ranges between 5.2% in Spain and
15.3% in Italy. And for those above age 80, CFR ranges between 10.0% in South Korea and 23.6% in Italy. 15
Figure 6
SELECTED COUNTRIES COVID-19 CASE FATALITY RATES BY AGE GROUP
0% 5% 10% 15% 20% 25%
80+
70–79
60–69 Italy
Age Group
50–59 Spain
40–49 China
30–39 South Korea
20–29
10–19
0–9
Data source: Sánchez, R.; Ordaz, A., Mendoza, S. P., eldiarios.es, March 22, 2020
Gender differences in CFRs have also been emerging in the available data, and men have fared worse than women.
In mainland China as of February 11, 63.8% of the deaths are male. 16 In Spain, as of April 13, 61.6% of the deaths
have been male. 17 Other risk factors are also prevalent in those who have died. Of the 8,644 people who died in
Spain as of April 1, 80.6% had one or more risk factors such as heart disease, respiratory disease or diabetes. 18 In the
U.S., 78% of the intensive care unit (ICU) patients and 71% of the non-ICU hospitalizations have had multiple risk
factors. 19
Copyright © 2020 Society of Actuaries11
U.S. SUBPOPULATIONS
New York City also has statistics on the number of cases and deaths by gender and age group (Figure 7). As of April
29, 2020, the New York City CFR for males is 9.18% and for females is 6.3%. These figures have risen since April 14,
2020, when they were 6.9% for males and 4.9% for females. 20 Because the city’s age groupings do not align with
those shown for Italy, China, Spain and South Korea, it is difficult to compare results. However, New York City’s CFRs
appear to be higher than the estimated CDC ranges (Figure 5).
Figure 7
NEW YORK CITY CASE FATALITY RATES, APRIL 29, 2020
0% 5% 10% 15% 20% 25% 30% 35%
Age 0–17 0.2%
18–44 0.8%
45–64 4.7%
65–74 15.3%
75+ 33.2%
Females 6.3%
Males 9.1%
Total 7.7%
Data source: New York City Department of Health
Several states and large cities have released preliminary data that COVID-19 is infecting and causing fatalities for
African Americans at significantly higher rates. For instance, statistics released for Chicago show that African
Americans make up more than half of those who have tested positive and 72 percent of virus-related fatalities in
Chicago, even though they are slightly less than one-third of the population. Michigan and Louisiana have also
reported disproportionate rates. 21
Some health researchers and officials have attributed these rates to several factors including higher rates of
underlying health conditions; less access to care; more individuals working essential jobs, which reduces social
distancing; less available information about COVID-19; housing disparities; and living in more densely packed
areas—factors that are generally accepted as driving higher death rates for communicable diseases. At present,
however, experts say the data is too limited to make broad conclusions about COVID-19. Federal authorities are
currently working to provide further statistics on what might be explanations for these preliminary data. 22
Further, to the above reference about densely packed areas, an article prepared by the CDC COVID-19 response
team noted that population density could be a significant factor in the transmission of COVID-19. Since COVID-19 is
transmitted mainly by respiratory droplets, increased density could lead to acceleration in the transmission. Urban
areas such as New York City and the District of Columbia are exceeding national averages. Louisiana has shown
greater incidence and increase in incidence than other states in the South. This could be connected to the level of
population density that occurred during Mardi Gras celebrations, before many major events were cancelled. 23
CFR LIMITATIONS
It should continue to be reinforced that emerging statistics on the pandemic contraction and case fatality rates lag
real-time information. In the early onset of the disease, cases might often be realized in datasets between one to
two weeks after the first identification of the case occurred. The amount of time between contraction of the
Copyright © 2020 Society of Actuaries12
disease, onset of symptoms, and its ultimate treatment and identification in public health statistics could be much
longer in counties without complete implementation of test processing. Deaths also occur on a lagged basis. Deaths
and death rates will greatly increase in many countries and communities over the next month.
As with other viruses such as influenza, climate conditions may have an impact on the ability of the virus to survive.
Viruses often survive better in cold weather because of the coatings that allow them to survive in the air and be
passed on from person to person. These features degrade in warm temperatures. However, it is questionable
whether COVID-19 is similar to other viruses in this regard. In the Southern hemisphere, South America and
Australia have seen significant outbreaks even in their warmer seasons.
Death rates and reported cases will grow rapidly over the coming weeks. However, the pace will be very different in
each community and country. It is important to understand the different timing of different numbers. Deaths are a
lagging indicator. Deaths will greatly increase in many communities over the next month—even if the personal and
private actions have slowed the growth of the virus. The same is true for reported cases. The numbers of reported
cases will greatly increase over the next months.
One technique to limit wild fluctuation in and gross under- or overstatement of CFRs that often occur during early
reporting is to “lag” the number cases in the denominator by seven or 14 days. The lag better aligns the deaths with
an appropriate exposure for calculating a CFR. However, CFRs calculated with a “lagged” case number could
potentially be significantly higher than a CFR using a non-lagged case number, especially during the early days of an
epidemic.
Another approach for avoiding misrepresentation of mortality rates because of early reporting issues is to analyze
data for a location only after a certain number of deaths have been recorded there.
A word of caution: Many of the CFRs shown in and quoted in this brief have been pulled from sources that did not
clearly document whether a lag is included. The reader should be aware of these potential shortcomings when
reviewing these statistics and other reported CFRs.
Figure 8 highlights the effect of using lagged CFRs for Hubei province, China, as well as the impact of analyzing data
only after 1,000 deaths were recorded in Hubei province. Without adjustment for reflecting unconfirmed and
unreported cases, it appears the lagged and unlagged CFRs for Hubei province are converging and may stabilize
between 4.7% and 4.8%.
Copyright © 2020 Society of Actuaries13
Figure 8
COVID-19 CASE FATALITY RATES FOR HUBEI PROVINCE, CHINA, THROUGH APRIL 12, 2020
8% 8%
14-day lag
7% 7%
7-day lag 14-day lag
7-day lag
Case Fatality Rate (CFR)
6% 6%
5% 5%
4% 4%
no lag no lag
3% 3%
2% 2%
0 5 10 15 20 25 30 35 40 45 50 55 60 65 70 75 80 85 0 5 10 15 20 25 30 35 40 45 50 55 60
Days Since First Death Days Since 1,000th Death
4.8%
4.7% 14-day lag
4.6%
7-day lag
4.5%
no lag
4.4%
4.3%
25 30 35 40 45 50 55 60
Days Since 1,000th Death
Data source: Johns Hopkins University
The reader can see in Figure 9 that COVID-19 CFRs show clear effects of early reporting for all countries with at least
1,000 deaths through April 14, 2020, with the possible exception of Hubei province and all provinces of China.
Although it is too early to draw conclusions about the likely long-term CFRs among countries, the differences are
striking. At this early stage, CFRs in Italy significantly outpace those of all other countries that have suffered at least
1,000 COVID-19 deaths. Italy’s higher CFRs may be in part because in Italy the cases are geographically
concentrated, which is overwhelming Italy’s health care system, while in other countries, the cases are more
geographically spread out.
Copyright © 2020 Society of Actuaries14
Figure 9
CFRS WITHOUT LAG FOR COUNTRIES WITH AT LEAST 1,000 COVID-19 DEATHS, THROUGH APRIL 29, 2020
17%
U.K., 15.8%
16%
15% France, 14.6%
14% Sweden, 12.1%
Italy, 13.6%
13% Mexico, 9.7%
Case Fatality Rate (CFR)
12% Netherlands, 12.1%
11%
10% Spain, 10.2%
9% World, 7.1%
8% Canada, 6.0% U.S., 5.9%
7% Brazil, 6.9% Iran, 6.4%
6% Hubei, 6.6%
5%
4% China, 5.5%
3% Germany, 4.0%
2%
1% Switzerland, 5.8%
0% Ireland, 5.9% Turkey, 2.6%
0 5 10 15 20 25 30 35 40 45 50 55 60 65 70 75 80
Days Since 1,000th Death
Data source: Johns Hopkins University
Similarly, New York City’s CFR shows the effects of early reporting (Figure 10).
Figure 10
NEW YORK CITY TOTAL CFR WITHOUT LAG, MARCH 15,2020–APRIL 29, 2020
9.0%
7.7%
8.0%
7.0%
6.0%
5.0%
4.0%
3.0%
2.0%
1.0%
0.0%
15-Mar
17-Mar
19-Mar
21-Mar
23-Mar
25-Mar
27-Mar
29-Mar
31-Mar
2-Apr
4-Apr
6-Apr
8-Apr
10-Apr
12-Apr
14-Apr
16-Apr
18-Apr
20-Apr
22-Apr
24-Apr
26-Apr
28-Apr
Data source: New York City Department of Health
REPORTED CASES VS. ACTUAL CASES
As previously stated, at this early stage in the pandemic, the CFR focuses on mortality rates relative to only
confirmed and reported cases. Due to resource constraints, most countries have focused COVID-19 testing almost
exclusively on individuals who exhibit severe symptoms. 24 Consequently, a key question remains unanswered: What
percentage of the population has already been exposed to the virus?
Copyright © 2020 Society of Actuaries15
A high exposure percentage would be good news, indicating that a significant portion of the population has already
contracted the virus, experiencing either mild or no symptoms. The greater the number of infected individuals who
have experienced little or no discomfort as a result of the virus—relative to the number who have experienced
severe complications or death—the less danger the virus poses to the population that has not yet been infected.
In the absence of random testing of the general population, some researchers have used indirect approaches to
estimate the portion of the population that has already been infected by SARS-CoV-2, the coronavirus that causes
the illness known as COVID-19. For example, researchers from Penn State University and Montana State University
examined publicly available U.S. influenza-like illness (ILI) data for this past March and identified a surge in non-
influenza ILI. The surge defied patterns seen in prior years. Across U.S. states, the researchers found that the surge
correlates with COVID-19 case counts. The authors conclude that the “symptomatic case detection rate of SARS-
CoV-2 in the U.S. to be 1/100 to 1/1000.” 25 This conclusion, in turn, suggests that tens of millions of Americans have
already been infected by the SARS-CoV-2 and, correspondingly, implies that the mortality rate among infected
persons may be far lower than previously believed.
Additional emerging evidence supports the idea that COVID-19 is much more prevalent than indicated by the
number of identified cases in most populations. Thus, the CFR may not be as deadly as originally thought. Data from
Iceland, where testing has been more broadly implemented than in other countries, indicates that the prevalence
may be around 1%. Using the deaths that have occurred in Iceland and its population age mix, this would
extrapolate to a global CFR of about 0.6%. 26 The USS Theodore Roosevelt is another population where there has
been widespread testing. As of April 16, 585 of the 4,860 crew had tested positive, resulting in an infection rate of
12%. There has only been one death associated with this Navy ship, although it may be early in the cycle of disease
progression. 27
COMPARISON TO PAST PANDEMICS AND INFLUENZA
COVID-19 AND PAST EPIDEMICS AND PANDEMICS
By comparison, the spread of COVID-19 has been much greater than similar epidemics witnessed in the 21st century
but also with much lower mortality rates. SARS-CoV-2 is one of seven distinct coronaviruses that can infect humans
and get their name from the crown-like spikes on their surfaces. Four common coronaviruses (known as 229E, NL63,
OC43 and HKU1) rarely cause serious complications or mortality events. Two other coronaviruses have been more
prominent in their impact on human illness and mortality. The SARS-CoV virus caused the severe acute respiratory
syndrome (SARS) outbreak of 2003 28 and the MERS-CoV virus created the Middle East Respiratory Syndrome (MERS)
in 2012. 29 Table 1 shows comparative statistics of COVID-19 compared to the severe acute respiratory syndrome
(SARS) outbreak of 2003 and the Middle East Respiratory Syndrome (MERS) in 2012. 30
The U.S. was a very small part of these previous outbreaks in comparison to the level of activity seen with COVID-19.
Eight U.S. patients had evidence of the SARS infection, and no deaths occurred in the U.S. due to SARS. The U.S. saw
only two cases and no deaths due to MERS in 2014, both associated with individuals who had lived or worked on the
Arabian Peninsula. As of April 14, 2020, the U.S. had reported 607,670 cases of COVID-19, about 31% of the world’s
confirmed cases.
Copyright © 2020 Society of Actuaries16
Table 1
COMPARISON OF SELECTED CORONAVIRUS EPIDEMICS
Number of Estimated
Countries Estimated Estimated Case Fatality
Coronavirus Epidemic Reporting Cases Deaths Contracted Cases Rate
SARS (2002–2003) 29 774 8,098 9.6%
MERS (2012–2014) 27 858 2,494 34.4%
COVID-19 (2019–4/14/2020)
No lag 170 125,578 1,972,254 6.4%
Lag-7 -- -- -- 8.8%
Lag-14 -- -- -- 14.7%
Note: Significant differences between the estimated COVID-19 case fatality rates (CFRs) with and without lags indicate that CFRs are
likely distorted by reporting issues that often exist in the early stages of epidemics. COVID-19 CFRs are expected to change as the
epidemic matures.
COVID-19 AND INFLUENZA
In addition, it can be beneficial to compare the extent of the impact of a sample influenza year to understand the
magnitude and strain on health care systems and population mortality. The most recent full year of mortality in the
U.S. is from 2018, which was also a fairly harsh year for the age-adjusted influenza mortality rate. The U.S. influenza
season across 2017–2018 saw over 48 million people become ill, with over 950,000 people hospitalized and over
79,000 deaths. 31 The annual case fatality rate for influenza in the U.S. typically is observed between 0.1% and 0.2%,
with population mortality generally in the range of 12 to 20 deaths per 100,000 of population (0.012% to 0.020%)
depending on the severity of the season. 32
During the 1918 influenza H1N1 pandemic as World War I was ending, mortality was high in people younger than 5
years old, people aged 20 through 40, and in people age 65 years and older. 33 The high mortality in healthy people,
including those in the 20–40-year age group, was a unique feature of this pandemic. Health officials estimate
mortality was approximately 50 million deaths worldwide. Since 1918, the world has experienced three additional
pandemics, in 1957, 1968 and most recently in 2009. 34 These subsequent pandemics were less severe and caused
considerably lower mortality rates than the 1918 pandemic. The 1957 H2N2 pandemic and the 1968 H3N2
pandemic each resulted in an estimated 1 million global deaths, while the 2009 H1N1 pandemic resulted in fewer
than 300,000 deaths in its first year. 35
When looking at deaths, each flu season can vary by timing within the flu season and by severity. Figure 11 shows
the weekly flu and pneumonia deaths for the total U.S. population for four highlighted flu seasons using data from
the CDC’s Flu Activity and Surveillance webpage 36 and flu, pneumonia and COVID-19 deaths from the CDC’s Weekly
Surveillance Summary of U.S. COVID-19 activity. 37 A flu season in the U.S. is measured by week and typically begins
in week 40 of a calendar year through week 39 in the following calendar year. Week 40 in a calendar year will be the
first flu week. Deaths in the 2014–2015 and 2017–2018 flu seasons peaked in week 14, increasing by about 25%
over the prior week. The week over week increases in the 2009–2010 and 2011–2012 seasons were much lower,
with the largest increase of 8.8% occurring in week 14 of the 2011–2012 season.
Copyright © 2020 Society of Actuaries17
Figure 11
WEEKLY FLU, PNEUMONIA AND COVID-19 DEATHS BY FLU SEASON—TOTAL POPULATION
14,000
12,000 2020 COVID-19
Deathts per Week
10,000
8,000
2017–18
6,000
2009–10 2014–15
4,000
2011-12
2,000
1 3 5 7 9 11 13 15 17 19 21 23 25 27 29 31 33 35
Flu Week
Data source: CDC
Results for the COVID-19 deaths and 2020 flu and pneumonia deaths captured on April 27, through flu week 28 or
April 11, have been included in Figure 11. Flu and pneumonia deaths are included to provide context for
understanding the completeness of COVID-19 mortality data and related trends. Deaths due to COVID-19 may be
misclassified as flu or pneumonia deaths and the increase in flu and pneumonia deaths may be an indicator of
excess COVID-19 related mortality. Weekly death data for COVID-19 increased greatly in weeks 26 and 27. In flu
week 28, the total flu, pneumonia and COVID-19 deaths equaled 13,838, greatly surpassing the 2017–2018 flu
season weekly high. Note, the death counts are lagged by 1-2 weeks. The National Vital Statistics System (NVSS)
updates death counts as the CDC’s National Center for Health Statistics (NCHS) receives more death certificate
information. Although the graph shows a slow-down in flu, pneumonia and COVID-19 deaths in week 28, this could
be due to the lag in data and should not be used to indicate any pattern or trend.
Life insurance companies will focus on how general population mortality rates translate into the ultimate mortality
of their own insured populations. Socioeconomic factors may be a key driver of how mortality plays out, because an
individual’s access to health care services and current health condition are often factors that drive survival rates in a
confirmed case.
Insurers who can segment their policyholders into various income level groupings may be able to make use of U.S.
population mortality data, shown in Figure 12, to benchmark their own flu and pneumonia death rates. This along
with an understanding of the relationship between past flu events and the emerging COVID-19 experience can be
useful in estimating the potential impact of COVID-19 on an insured block of business.
Figure 12 demonstrates how flu and pneumonia death rates in the U.S. have varied historically by various county
level income percentile groups. U.S. counties were ranked based on median household income and split into five
county level groups. The 80–100% group represents the quintile of counties with the highest income, and the 0–
20% group is the quintile of counties with the lowest income. The bottom income quintile (0%–20%) has had
significantly higher mortality, ranging from 8.4% to 22.7% higher, than the total population. The other quintile
groups have clustered together, and their rank order has shifted over time. However, the top income quintile (80%–
100%) has had the lowest mortality rates since 2005 and has ranged from 0.2% higher to 12.7% lower than the total
population. 38
Copyright © 2020 Society of Actuaries18
Figure 12
U.S. POPULATION DEATHS FROM FLU AND PNEUMONIA BY COUNTY INCOME PERCENTILE
County Income
95 Percentile
Group
85 0%–20% (Bottom
Incomes)
Deaths per 100,000
20%–40%
75
40%–60%
65
60%–80%
55
80%–100% (Top
45 Incomes)
All Counties
35
1999
2000
2001
2002
2003
2004
2005
2006
2007
2008
2009
2010
2011
2012
2013
2014
2015
2016
2017
2018
Calendar Year
Data source: CDC WONDER Online Database
In a recent survey completed by the SOA, the Life Insurance Marketing and Research Association (LIMRA), Oliver
Wyman and the American Council of Life Insurers (ACLI), life insurance companies were asked which median
household income quintile their policyholders fell into on average. 39 The results were across the board. Thirty-two
of 53 responded with the following percentile groups: 7 in the top 20th; 4 in the 21st–40th; 9 in the 41st–60th; 9 in
the 61st–80th; and 3 in the 81st–100th. The remaining 21 could not provide an answer. The results show a lack of
homogeneity in the insurance industry and indicate that each insurer needs to consider its own block of business if
using population mortality as a benchmark to its own flu, pneumonia and COVID-19 claims.
HEALTH CARE COST AND UTILIZATION
Data on the cost and utilization of treatment for individuals who are diagnosed with COVID-19 is still emerging. The
financial impact of COVID-19 is seen through increases in underlying expenses and is driven by costs for testing,
special equipment, protective systems for health care workers and additional staffing needs. In some locations,
additional hospital and ICU beds are often needed, and they are being built or converted from other sources. 40
These increased costs may be passed onto payers immediately through fee-for-service claims or later in other
payment arrangements. In the U.S., many insurers are waiving patient out-of-pocket costs for health care treatment
related to COVID-19. 41 As an example, a broad list of health care insurance activities being used to provide access to
care and support in the current environment can be found on the website of America's Health Insurance Plans
(AHIP), a U.S. national association whose members provide health insurance coverage and health‐related services. 42
The largest increases in costs are directly connected to the critical care needed for the sickest patients who have
contracted the virus. Intensive care units for these patients are very expensive and the costs are further
compounded by the need for isolating them. The impact also varies by the outbreak situation in local areas
depending on demographics and efforts such as social distancing to slow the spread. Additional details on the range
Copyright © 2020 Society of Actuaries19
of estimates for COVID-19 health care claims can be seen in the Society of Actuaries report COVID-19 Costs to
Commercial Health Insurers at https://www.soa.org/resources/research-reports/2020/covid-19-cost-commercial/.
SUPPLY OF MEDICAL RESOURCES
An issue in some countries, including the U.S., is that the supply of many testing and critical care resources is lower
than the demand during this pandemic. 43 Countries around the world are looking to find ways to improve their
ability to meet this demand. As an example, medical centers within the University of California system have
converted laboratory space into in-house coronavirus testing centers. 44
Testing for the virus involves collecting respiratory specimens from a patient and running it through test kits at
public health laboratories that perform real-time RT-polymerase chain reaction (rRT-PCR) detection of the SARS-
CoV-2 virus. Inside the labs, reagents are required to test the specimen provided. Supply of test kits is growing, in
spite of ongoing production challenges, but one constraint may also be the amount of public and clinical lab capacity
that can be used or increased.
Some countries have dramatically increased capacity for testing, leveraging off past investments in health care
infrastructure. As an example, South Korea has had a high number of detections of SARS-CoV-2 but has also seen
the number of new cases decline since the start of March 2020. In many parts of the country, drive-through test
centers have been established to expedite the process and extend testing ability. These methods also help limit
health care workers from having extended direct exposure to the virus. 45
Several U.S. retail pharmacy chains announced on April 27, 2020, that they will expand free coronavirus testing to
be conducted in their parking lots or drive-thru windows. 46 A new test that could expedite detection was granted
“emergency-use authorization” by the Food and Drug Administration (FDA) on March 27 for rollout the week of
March 30. 47 Manufacturers are currently producing 50,000 tests per day and looking to increase production. Some
jurisdictions were able to purchase and implement large quantities of rapid tests to help increase the response to
testing and treatment. Allocation of rapid tests have been under debate between various levels of government. 48
From insurer and consumer cost perspectives, on March 18, 2020, Congress passed a new law, the Families First
Coronavirus Response Act, that requires most private health plans to cover testing for the coronavirus with no cost-
sharing during the current emergency period. 49
Testing is important early in the cycle of a pandemic to help detect infections and contain the spread of the virus. As
the infection has spread and containment is no longer possible, the strategy has shifted from containment to
protection of the most vulnerable through social distancing and self-isolation.
HOSPITALIZATION RATES
Hospitalization rates for COVID-19 patients appear to be high. Using the CDC’s hospitalization rate of 29.2 per
100,000 population 50 and the CDC’s 690,714 number of cases 51 as of April 18, along with a U.S. population of 330.7
million, 52 the hospitalization rate per COVID-19 cases in the U.S. is 14% and much higher than the hospitalization
rate of 1%–2% for influenza patients (Figure 13).
Figure 14 digs into hospitalization rates a little deeper and compares COVID-19 hospitalization rates by age groups
for COVID-19 and influenza. Based on COVID-19 data from China and Spain and influenza data from the U.S., COVID-
19 hospitalization rates significantly exceed influenza hospitalization rates for ages 18 and up. 53
Copyright © 2020 Society of Actuaries20
Figure 13
PERCENTAGE OF U.S. COVID-19 AND INFLUENZA CASES THAT REQUIRED HOSPITALIZATION
COVID-19 CASES INFLUENZA CASES
Hospitalized,
1.6%
Hospitalized,
14%
Not Hospitalized, Not Hospitalized,
86% 98.4%
Data source: Centers for Disease Control and Prevention
Figure 14
PERCENTAGE OF CASES REQUIRING HOSPITALIZATION BY AGE GROUP
0% 5% 10% 15% 20% 25% 30%
Age 80+ 27.3%
70–79 24.3%
60–69 16.6% COVID-19:
50–59 10.2% China,
40–49 4.9%
30–39 3.2% through
20–29 1.2% February
10–19 0.3%
0–9 0.1%
80+ 16.6%
70–79 16.2%
60–69 16.9%
50–59 19.0% COVID-19:
40–49 15.3% Spain,
30–39 10.0% April 6,
15–29 5.6% 2020
5–14 0.3%
2–4 0.1%21
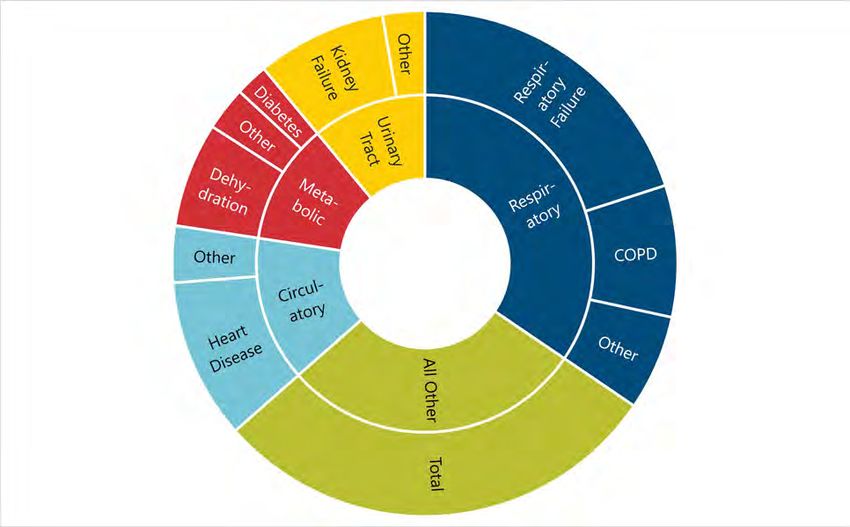
ICU patients. This helps to validate the frequently repeated trope that comorbidities and underlying medical
conditions can lead to more severe cases of COVID-19. 54
The critical focus shifted from testing kits toward having adequate numbers of hospital beds and ventilators for
COVID-19 patients and sufficient personal protective equipment for frontline health care professionals and other
critical service employees like police. The number of hospital beds per 1,000 people in the U.S. is 2.8 and lags Italy
(3.2 per 1,000), China (4.3 per 1,000) and South Korea (12.3 per 1,000). 55 Models and projections of hospital bed
usage in the U.S. produced by ProPublica demonstrate why public health officials are so intent on “flattening the
curve.” 56
Figure 14 emphasized the distribution of hospitalization related to influenza claims. Figure 15 shows the incidence
rates of influenza hospitalizations by age group for each flu season. These results are similar in that there are
significant increases in flu hospitalizations as members age, with incidence rates more than doubling as members
shift into different 10-year age bands. In addition, males tend to have slightly higher hospitalization rates with those
discrepancies increasing at higher ages.
Figure 15
HOSPITAL ADMISSION RATE PER THOUSAND MEMBERS DUE TO INFLUENZA BY GENDER, 2013–2017
Female 2.30
85+ Male 2.72
All Genders 2.46
0.96
75–84 1.07
1.01
0.38
65–74 0.38
0.38
0.21
55–64 0.19
0.20
0.11
45–54 0.11
0.11
0.07
35–44 0.07
0.07
0.03
19–34 0.03
0.03
0.10
0–18 0.14
0.12
0.0 0.5 1.0 1.5 2.0 2.5 3.0
Source: Health Care Cost Institute Enrollment and Inpatient Claims Data from 2013–2017.
New York City released data of the cumulative number of reported COVID-19 cases and hospitalizations in the city,
as shown in Figures 16 and 17. The data show that persons age 18 to 44 are more likely than other age groups to
contract COVID-19. However, compared to all older age groups, a much smaller percentage of persons age 18 to 44
who contracted COVID-19 have been hospitalized. 57 Note that data from a very specific locale such as New York City
may not be representative of situations in other locales.
Copyright © 2020 Society of Actuaries22
Figure 16
CUMULATIVE NUMBER OF NEW YORK CITY REPORTED COVID-19 CASES AND HOSPITALIZATIONS, APRIL 29, 2020
Age Group Gender Total
120,000 Total Cases 120,564
100,000 83,916
78,154
80,000 Not
59,684 59,715 Hospitalized
60,000
40,000
20,273 18,506 Hospitalized
20,000 3,711 323 142
0
0 to 17
18 to 44
45 to 64
65 to 74
75 +
Unknown
Female
Male
Unknown
Total
Data source: New York City Department of Health
Figure 17
PERENTAGE OF NEW YORK CITY REPORTED COVID-19 CASES THAT HAVE BEEN HOSPITALIZED, APRIL 29, 2020
0% 5% 10% 15% 20% 25% 30% 35% 40% 45% 50% 55% 60% 65% 70%
Total 26%
Male 29%
Female 22%
Age 75 + 62%
65 to 74 47%
45 to 64 24%
18 to 44 10%
0 to 17 8%
Data source: New York City Department of Health
New York City’s data shows that through April 29, 2020, 26% of COVID-19 patients have been hospitalized. It also
shows that males are more likely than females to contract COVID-19, and they are more likely to get sicker from
COVID-19 than are females. While males have contracted 52% of the confirmed cases, 58% of the hospitalized cases
have been males.
Each influenza outbreak can differ by the time of year it will peak. Figure 18 shows the weekly hospitalization rate
for the total U.S. population for four highlighted flu seasons using data from the CDC’s Weekly Surveillance
Summary of U.S. COVID-19 activity 58 and the CDC’s Flu Activity and Surveillance webpage. 59 A flu season in the U.S.
is measured by week and typically begins in week 40 of a calendar year through week 39 of the following calendar
year. Week 40 in a calendar year will be the first flu week. The 2009–2010 season was unusual in that it peaked
early in flu week three, whereas the 2011–2012 flu season peaked in flu week 24. The 2014–2015 season’s peak was
quite severe at a rate of 14.6 per 100,000 hospitalizations in week 14 but dropped off quickly the following week.
The 2017–2018 season also peaked in week 14 at a rate of 10.2 and dropped off slowly over the next eight weeks.
Copyright © 2020 Society of ActuariesYou can also read