Soil Dynamics and Earthquake Engineering
←
→
Page content transcription
If your browser does not render page correctly, please read the page content below
Soil Dynamics and Earthquake Engineering 47 (2013) 117–131

                                                        Contents lists available at SciVerse ScienceDirect

                                       Soil Dynamics and Earthquake Engineering
                                                   journal homepage: www.elsevier.com/locate/soildyn

Performance of bridges with seismic isolation bearings during the Maule
earthquake, Chile
Mauricio Sarrazin n, Ofelia Moroni, Carlos Neira, Braian Venegas
University of Chile, Civil Engineering, Blanco Encalada 2002, Santiago, Chile

a r t i c l e i n f o                                   abstract

Article history:                                        On February 27, 2010 an earthquake of magnitude Mw ¼ 8.8, with epicenter in Cobquecura, Maule
Received 14 November 2011                               region, hit the central part of Chile. After the earthquake, a tsunami occurred that caused heavy
Received in revised form                                casualties and damage to buildings and infrastructure. In particular, 4.5% of the overpasses located in
5 April 2012
                                                        the affected region suffered some type of damage and 25 bridges and several pedestrian bridges
Accepted 23 June 2012
Available online 21 July 2012
                                                        collapsed. At that time, there were about a dozen bridges with seismic isolation bearings in Chile, two
                                                        of which were instrumented with accelerometer networks: the Marga Marga Bridge, located in Viña del
                                                        Mar, and an elevated section of the Metro Line 5 in Santiago, at approximately 300 km and 400 km from
                                                        the epicenter, respectively. This paper analyzes the acceleration records obtained at these instrumented
                                                        structures and studies the effect of the seismic isolation on their dynamic response. The beneficial effect
                                                        of the isolation system, especially in the longitudinal direction, is apparent. In addition, some flaws in
                                                        the collapsed bridges are described.
                                                                                                                          & 2012 Elsevier Ltd. All rights reserved.

1. Introduction                                                                        the worldwide trend [3], most of the important bridges have some
                                                                                       seismic protection system consisting of natural rubber or neo-
   An 8.8 magnitude earthquake struck central Chile at 3:34 AM                         prene isolators, friction bearings and/or energy dissipation
on February 27th, 2010, followed by a tsunami that swept the                           devices. In the disaster zone there are two bridges with seismic
coastline between Llolleo and Lebu, nearly 700 km apart. The                           isolation support that are instrumented with accelerometer
epicenter was located 35 km deep, off the coast of Cobquecura,                         networks: Marga Marga Bridge, located in Viña del Mar, at
Maule Region. According to seismic data the rupture zone was                           approximately 300 km from the epicenter and, a viaduct section
500 km long and 150 wide [1]. This area is one of the most                             of the Metro Line 5 in Santiago, some 400 km away from the
densely populated in Chile and concentrates the majority of the                        epicenter. The acceleration records obtained at both structures are
industrial facilities in the country, excluding mining. The damage                     analyzed in this paper. The effect that the seismic isolation had on
to buildings, industries and road works were substantial.                              the dynamic response of the structures is also assessed. This type
   The area is instrumented with a network of broadband                                of analysis has been performed for bridges in other countries [4,5];
seismometers and strong motion accelerometers, thus a large                            however the high magnitude of the earthquake and the local soil
number of records at the epicentral area was obtained [1,2].                           conditions are unprecedented and make this research of interest.
The earthquake lasted nearly 140 s with a strong motion part of                        Failures of highway bridges and crosswalks at various locations in
40–50 s. The largest horizontal acceleration was recorded by the                       Chile are also described.
Melipilla station (0.78 g), about 50 km from the coast and more
than 200 km away from the epicenter. This station also recorded
high accelerations during the 1985 earthquake. However the
                                                                                       2. Description of damaged bridges
damage in Melipilla city was quite modest as compared with
places closer to the epicenter, where lower accelerations were
                                                                                          Most bridges in Chile are composed of simply supported steel
recorded.
                                                                                       or reinforced concrete beams, with transverse diaphragms that
   In the last 15 years, many concession roads have been built or
                                                                                       connect locally the beams over the piers and/or at the abutments.
renovated in Chile, which include several major bridges. Following
                                                                                       In addition, vertical anchorage rods called ‘‘seismic bars’’ are
                                                                                       provided at the supports (see Fig. 1). This practice changed
  n
      Corresponding author. Tel.: þ56 2231 8406; fax: þ 56 2334 7194.                  around the year 2000, when the use of precast prestressed
      E-mail address: sarrazin@ing.uchile.cl (M. Sarrazin).                            concrete beams was massified, and the transverse diaphragms

0267-7261/$ - see front matter & 2012 Elsevier Ltd. All rights reserved.
http://dx.doi.org/10.1016/j.soildyn.2012.06.019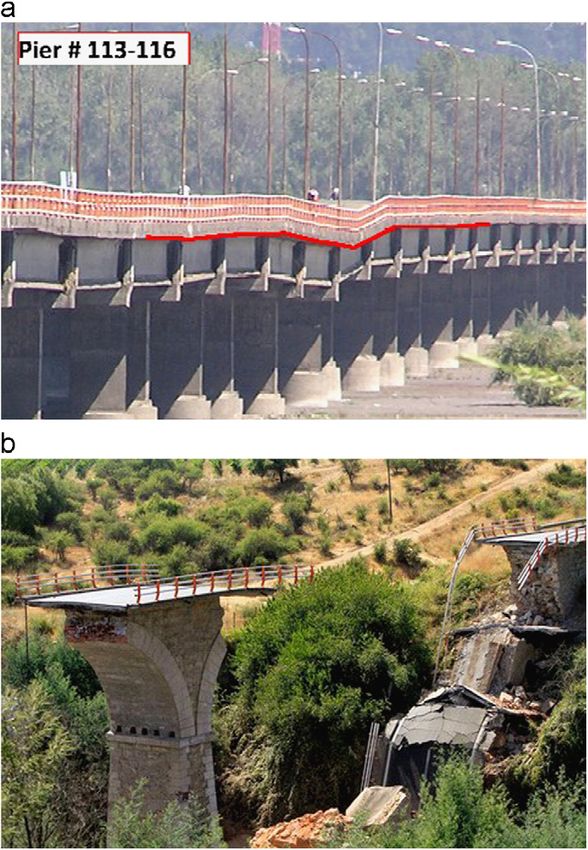
118 M. Sarrazin et al. / Soil Dynamics and Earthquake Engineering 47 (2013) 117–131
Fig. 1. ‘‘Seismic bars’’ and transverse diaphragms in typical simply supported
Fig. 2. (a) Vespucio Norte Overpass. Insufficient steel stoppers.(b) Overpass near
bridge.
Rancagua.
were eliminated. Instead of them, steel or reinforced concrete Vespucio Norte where the steel side stoppers were insufficient to
stoppers were considered at the bottom flange of the beams in the hold the beam flanges. Other factors that contributed to the
transverse direction. damage were the lack of vertical restraint bars at the supports
Most bridges with large spans and tall piers are equipped with and the small size of the supporting area. Fig. 2b shows a
seismic isolation and/or dissipation devices. Using ambient vibra- damaged overpass with a significant lateral displacement of the
tion records and FFT analysis, Moroni et al. [6] determined in superstructure that broke the reinforced concrete stoppers. In
some of them the fundamental frequencies and equivalent damp- addition, local amplification of seismic waves and poor soil
ing. In the horizontal direction, frequencies varied between quality was reported in all these sites.
0.68 Hz and 1.46 Hz and the equivalent damping between 1% Three bridges over the Bio Bio River, connecting the city of
and 4.4% Concepción to the south, partially collapsed (see Fig. 3a). Lique-
About 4.5% of the overpasses failed due to the earthquake and faction and lateral spreading of the soil could explain such
25 bridges collapsed, 10 of them on public roads and 15 in damage. Between Curico and Talca, over the Claro River, an old
privately managed toll roads [7]. A detailed description of the bridge built in 1890 collapsed. It was a 117 m long bridge, formed
failures of 32 bridges, several of them of the skew type, was by 7 masonry arches of about 25 m height. This bridge (Fig. 3b)
reported by Yen et al. [8]. It is believed that the skewed shape and had been declared a National Monument a few years earlier.
the lack of transverse diaphragm over the abutments were the All seismically isolated bridges, with the exception of Cardinal
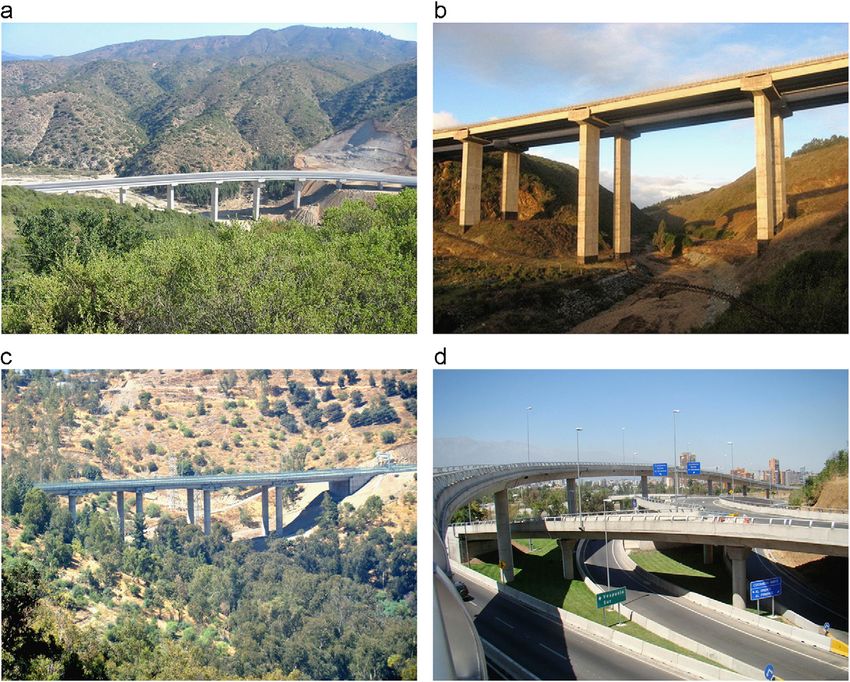
main cause of the collapse of the overpasses. After the earthquake Silva Henriquez Bridge in Constitución, had good performance.
experience, the Ministry of Public Works decided that the use of Some of them can be seen in Fig. 4. Detailed damage in Cardinal
transverse diaphragms should be compulsory. The damage to Silva Henriquez Bridge is described in [8]. The main damage was a
highways around Santiago, as Vespucio Norte and South East lateral displacement of the supporting plates that produced fail-
Highway, both operated by private agencies, had a big economic ure of the stoppers. The welded connection of the beams to one of
impact. Other badly affected areas were the village of Hospital the abutments was also fractured. Despite the damage, light
and the Rancagua By-Pass. Fig. 2a shows a collapsed overpass in vehicles were allowed to cross the bridge while it was repaired.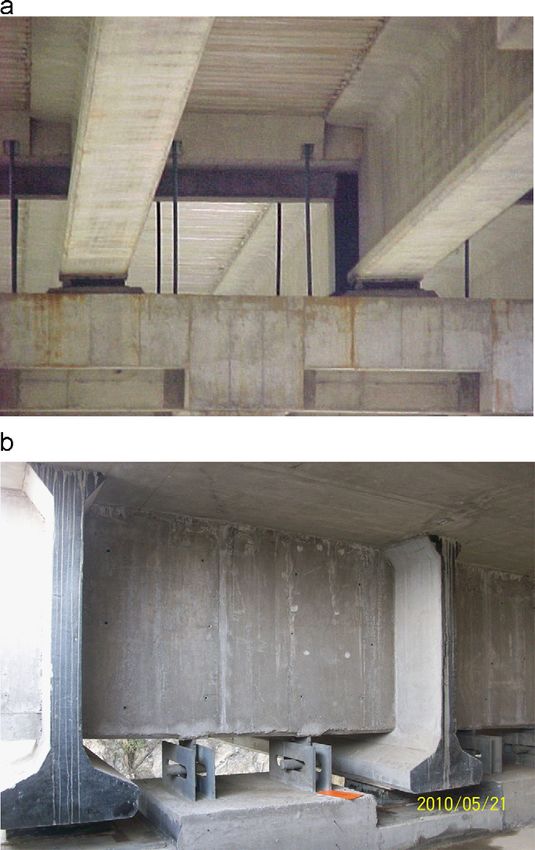
M. Sarrazin et al. / Soil Dynamics and Earthquake Engineering 47 (2013) 117–131                             119

                                                                                      base and top of pier C4, north and south abutments and several
                                                                                      positions on the deck, as shown in Fig. 6. The top of Fig. 6 shows
                                                                                      the deck with the sensors in the transverse and longitudinal
                                                                                      directions and the bottom shows pier C4 with sensors 2, 5, 8 and
                                                                                      14 that measure in the vertical direction. Using this network for
                                                                                      ambient vibrations, frequencies in longitudinal (L) and transverse
                                                                                      (T) direction, as well as damping of the superstructure were
                                                                                      determined (see Table 1). This table also shows the corresponding
                                                                                      frequencies and equivalent damping obtained from the July 24,
                                                                                      2001 earthquake records. At the deck, the predominant frequen-
                                                                                      cies in both horizontal directions were reduced considerably
                                                                                      during the strong motion interval of the earthquake, while the
                                                                                      equivalent damping in longitudinal direction increased, reaching
                                                                                      up to 15%.
                                                                                         Ambient vibrations were measured using seismometers at the
                                                                                      ground, at the bottom of pier C4 and at the valley, 20 m apart to
                                                                                      the west of pier C4. Predominant frequencies of 1.3 Hz in both
                                                                                      horizontal directions and 1.8 Hz in the vertical direction were
                                                                                      identified. Subsequently, frequencies in horizontal direction of
                                                                                      1.2 Hz at the valley and 4.4 Hz on the rock at the south abutment
                                                                                      were obtained from moderate seismic records using Nakamura’s
                                                                                      method. [10].

                                                                                      3.2. Maule earthquake records

                                                                                          Figs. 7, 8 and 9 show the acceleration records, in fractions of g,
                                                                                      obtained during the February 27th, 2010 earthquake in the
                                                                                      longitudinal, transverse and vertical directions, respectively. Peak
                                                                                      accelerations are listed at the right end of each diagram. There is a
                                                                                      significant reduction of accelerations in the longitudinal direction
                                                                                      between the pier and the deck and also between the abutments
                                                                                      and the deck. Accelerations at the south abutment are much
                                                                                      larger than at the north one, although both sites may be classified
                                                                                      as hard soils. The differences in topographic conditions between
                                                                                      one abutment and the other could explain the differences in
       Fig. 3. (a) Bridge in Concepción.(b) Collapsed Claro river bridge.            accelerations. There is also a considerable change in the dominant
                                                                                      frequency of the different records. Acceleration on the deck at
                                                                                      sensors 7, 18 and 12 are quite similar, indicating nearly a rigid
                                                                                      body motion in the longitudinal direction.
3. Marga Marga Bridge                                                                     In the transverse direction, the accelerations are of the same
                                                                                      order of magnitude at the deck and at the piers, but almost twice
3.1. Description                                                                      the ‘‘free-field values’’. Peak accelerations at the deck reached the
                                                                                      largest values, 1.9 g and 1.4 g at the north and south abutments,
   The Marga Marga Bridge, built in 1996, is located in Viña del                     respectively. This fact could be explained by the existence of
Mar. A view and a general scheme are shown in Fig. 5. The                             friction between the deck and the lateral stoppers. For moderate
superstructure consists of a reinforced concrete deck, 0.27 m thick                   earthquakes, it has been observed that the horizontal accelera-
and 18 m wide, and 4 continuous steel I-beams, which rest on 36                       tions are generally higher at the valley than at the base of the pier,
rubber isolators located at the two abutments and the 7 piers. The                    which seems to indicate that the piles attenuate the ground
piers have a hollow rectangular section of 2  10 m, 0.25 m thick.                    motion. However, this effect was not observed this time.
The deck can move only longitudinally at the abutments. There                             There was a significant reduction between the free field and
are reinforced concrete transverse elements connecting the steel                      the base of the pier in the vertical direction (first two graphs of
beams at both ends. All spans, except the southernmost one, are                       Fig. 9), probably due to the effect of the piles that are embedded
50 m long. The total length of the bridge is 383 m. Pier height                       in the soil to reach harder layers. On the deck, the amplification in
varies between 22 and 32 m. Groups of ten one-meter diameter                          the vertical direction is apparent, especially in sensor 15, located
piles, with depths ranging from 14 to 31 m, bear piers C2–C6,                         on top of pier C6. Differences between sensors 8 and 14 may
whereas the piers C1, C7 and the abutments are supported                              indicate some torsion of the deck. Finally, it is confirmed that the
directly on rock. A complete description of this bridge is in [9].                    bridge is exposed to differential support motions, so this effect
   Isolators’ section varies depending on the vertical load applied.                  should be taken in account in any analytical study of this bridge.
They are 0.85  0.55 m over the piers, 0.5  0.7 m at the north                           Elastic acceleration spectra (5% damping) of the longitudinal
abutment and 0.5  0.5 m at the south abutment. The required                          and transverse valley free field ground motions and the design
shear modulus of the rubber for 50% strain was 0.75 70.05 MPa                         spectrum are shown in Fig. 10. Although the design spectrum is
with an equivalent damping of 8 to10%. This was verified during                        lower than the spectra obtained from the records, the bridge
the construction process by testing rubber samples in direct shear                    performed as expected at the design stage.
and each of the 36 rubber bearings.                                                       The square of the Fourier spectra of the records, in both
   The monitoring system of the bridge consists of 24 sensors                         horizontal directions, are shown in Figs. 11 and 12. The free
placed at the following locations: free field-valley, free field-rock,                  field-valley motions have large peaks, with amplitudes of the
120                                      M. Sarrazin et al. / Soil Dynamics and Earthquake Engineering 47 (2013) 117–131

                  Fig. 4. Undamaged isolated bridges: Marga Marga Bridge, Cartagena Viaduct, El Bosque Radial Nororiente, Américo Vespucio.

                                                                                   these same frequencies. At the top of the pier, in the longitudinal
                                                                                   direction, the amplitude at 1.21 Hz increases up to 150, while in
                                                                                   the transverse direction the largest amplitude (around 80) is
                                                                                   between 2.4–2.6 Hz. The motion at the free field and at the pier
                                                                                   for frequencies above 5 Hz show very little energy. The motion at
                                                                                   the deck in the longitudinal direction shows very small peak
                                                                                   amplitudes: 3.2 for 0.42 Hz, 2.1 for 0.7 Hz and 4 for 6.1 Hz. The
                                                                                   first peak of the square of the Fourier spectrum on the deck is
                                                                                   associated with the natural frequency of the deck sliding as a rigid
                                                                                   body on the bearings.
                                                                                      These results show clearly the beneficial effect of the isolation
                                                                                   bearings on the response in the longitudinal direction, in which
                                                                                   the deck is free to move. The motion in the transverse direction
                                                                                   experiences a significant change in its frequency content and their
                                                                                   amplitudes are reduced with respect to the top of the pier to less
                                                                                   than half. Note that in this direction there are stoppers that
                                                                                   prevent the motion at the abutments.
                                                                                      Predominant frequencies were obtained using three different
                                                                                   time intervals along the duration of the records, which were
          Fig. 5. General view, Marga Marga Bridge Viña del Mar.
                                                                                   filtered using a Butterworth band pass filter between 0.2 and
                                                                                   20 Hz. As could be expected, the frequencies changed with time,
                                                                                   demonstrating the nonlinear behavior of the isolation bearings.
                                                                                   The natural frequencies are shown in Table 2. The longitudinal
order of 40 around 1.21 Hz, and 50 around 0.95–1.05 Hz in the                      frequency at the deck presented a significant reduction as
longitudinal and transverse directions, respectively. In both hor-                 compared to previous earthquakes and is quite close to the value
izontal directions there are small peaks of the order of 10 around                 used at the design phase (0.5 Hz). This table also shows the
1.9 and 2.4 to 2.6 Hz. The motions at the bottom of the pier are                   equivalent damping obtained from the strong motion segments of
very similar to the free-field motion, with larger amplitudes at                    the records. Dai et al. [11] studied the effect of the stiffness of the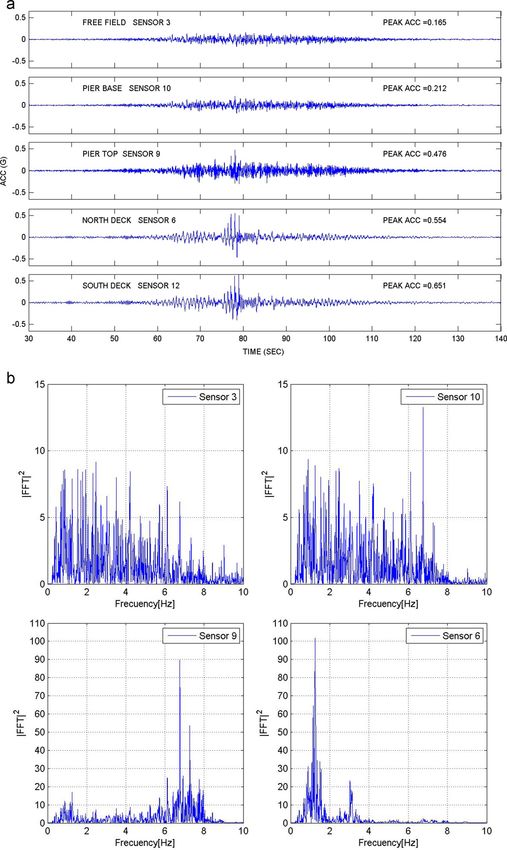
M. Sarrazin et al. / Soil Dynamics and Earthquake Engineering 47 (2013) 117–131                           121

                                                    Fig. 6. Local acceleration network in Marga Marga Bridge.

Table 1
Natural frequencies and damping. Ambient vibrations and 24/07/2001 earthquake. Marga-Marga Bridge.

 Ambient vibration                                                                        24/07/2001 earthquake

 Frequency (Hz)             Damping (%)               Predominant direction               Frequency (Hz)               Damping (%)   Direction sensor

       1.05                 2.6                       Transverse                                0.65                   15            Longitudinal-deck
       1.18                 1.9                       Transverse                                0.85                   3.4           Transverse-deck
     1.5–1.7                1.2                       Pier/Deck-General                         1.25                                 Transverse-all
       1.85                 1.4                       Trans-long                              1.4–1.6                                Longitudinal-all
     1.8–2.1                1.5                       Longitudinal                           2.45–2.75                 1.5           Vertical-deck

rubber pads and the conditions at the ends of the deck on the                       directions, respectively. The main difference with respect to
dynamic characteristics of the bridge using transfer functions in                   ambient vibration measurements is in the vertical frequency of
the frequency domain. For the rubber pads, with a shear modulus                     the soil.
of 3.0 and 1.0 MPa, and free deck condition, significant peaks
occurred at 0.5 Hz and 0.32 Hz in the longitudinal direction. This                  3.3. Mathematical model
gives an starting point to prepare an analytical model of the
bridge in order to reproduce the experimental data.                                    A finite element model of the bridge was developed using the
   Displacements were obtained by double integration of the                         Open Sees platform. Girders, slab and piers were represented by
acceleration records, using standard software from Kinemetrics                      elastic beam–column type elements, and the isolators by elasto-
SMA, that includes a baseline correction of the records and                         meric bearing type elements. In order to fit the experimental and
filtering of low and high frequencies with a band pass between                       analytical responses, the bearings stiffness were varied. The best
0.15–0.25 Hz and 23.0–25.0 Hz, respectively. Maximum distor-                        result was obtained by the following properties: ke¼9.5 kN/mm,
tion of the bearings was 15.6 cm (76.5% rubber shear strain) and                    fy¼40 kN, kf¼2.0 kN/mm; ke¼7.5 kN/mm, fy¼11 kN, kf¼
occurred in the transverse direction over pier C4. In the long-                     0.75 kN/mm and ke¼11 kN/mm, fy¼20 kN, kf ¼1.1 kN/mm,
itudinal direction, maximum distortion was about 11 cm (54%                         for the bearings located at the piers, south abutment and north
rubber shear strain) at the same location and around 6 cm at                        abutment, respectively. Two different cases of input were
the abutments. For these shear strains, the G value would be                        considered. In the first, the records obtained at free field-valley
0.6–0.8 MPa, according to bearings tests.                                           were applied to the abutments and piers simultaneously in long-
   Frequencies of 1.2 Hz, 1.0 Hz and 4.2 Hz were obtained at                        itudinal, transverse and vertical directions. In the second model,
the ‘‘free-field valley’’ in longitudinal, transverse and vertical                   records obtained at—south abutment were applied at south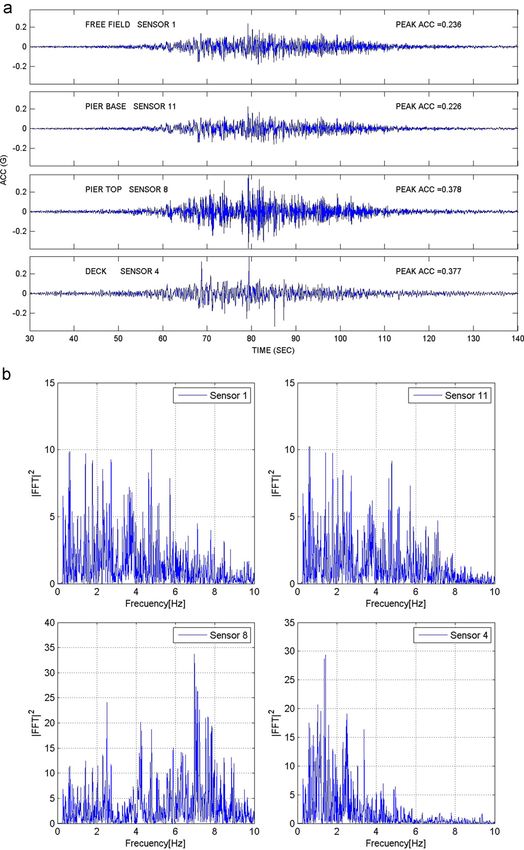
122                                   M. Sarrazin et al. / Soil Dynamics and Earthquake Engineering 47 (2013) 117–131

                                        Fig. 7. Longitudinal records, 27/02/2010 earthquake. Marga Marga Bridge.

abutment and pier 1, records obtained at north abutment were                    Agrı́cola, San Joaquin, Pedrero and Mirador. The viaduct is
applied at north abutment and piers 6 and 7, and the records from               composed of two 1.8 m high external prestressed concrete beams
free field-valley were applied at base of piers 2–5, in longitudinal             connected by means of a transversally post-tensioned concrete
and transverse direction, while the vertical free field-valley record            slab, 30 cm thick. The spans range from 27 to 36 m and widths
was applied at all the supports. All piers were considered fixed in all          from 6.3 to 7.5 m. The beams are simply supported on reinforced
directions except the torsional direction that was free to move.                neoprene pads, 30  60 cm in plan and 5.2 cm thick, located at the
Additionally, the deck was considered fixe at both abutments in                  ends of cantilevers spanning from a hollow central column.
transverse direction. Gap elements of elastic-perfectly plastic mate-           Column dimension are: 2.4  1.4 m and 30 cm thickness wall. At
rial were considered in longitudinal direction.                                 the stations, the columns are 2.4  2.2 m. The columns are
    Rayleigh damping was used in both cases with 2% critical                    connected monolithically to the foundations, which consist of a
damping for modes 1 and 3. Figs. 13, 14 and 15 show theoretical                 hollow reinforced concrete parallelepiped, with variable depth
and experimental displacements and spectral power densities                     between 7 and 12 m, filled with compacted soil. Detailed infor-
obtained by longitudinal sensor 7, transverse sensor 9, and                     mation is in [12]. A view of a section and the station area is shown
vertical sensors (8þ14)/2, for both type of input. A significant                 in Fig. 16a.
improvement is observed with the use of non-synchronic motions                     The instrumentation installed at the Metro Line 5 is a local
at the supports.                                                                network of three uniaxial and three triaxial accelerometers, as
    Some factors that can explain the differences between theore-               shown in Fig. 16b. Frequencies obtained in the longitudinal,
tical and experimental results are: incorrect damping in the                    transverse and vertical directions, from records of moderate
model, theoretical frequencies different from the experimental                  earthquakes, are listed in Table 3.
ones, differences in the input motions considered, between
others.                                                                         4.2. Maule earthquake records

                                                                                    The Metro was able to operate normally after the quake,
4. Line 5, Santiago metro viaduct                                               except for some minor damage to non-structural elements at
                                                                                some stations. Figs. 17–19 show the records obtained on February
4.1. Description                                                                27th, 2010 and also the square of the Fourier spectra of the motion
                                                                                in the longitudinal, transverse and vertical directions. Peak accel-
   Line 5 viaduct of the Santiago Metro extends for 5,810 m,                    erations are listed at the right of each diagram. The reduction of
including stations: Rodrigo de Araya, Carlos Valdovinos, Camino                 acceleration in the longitudinal direction between the beam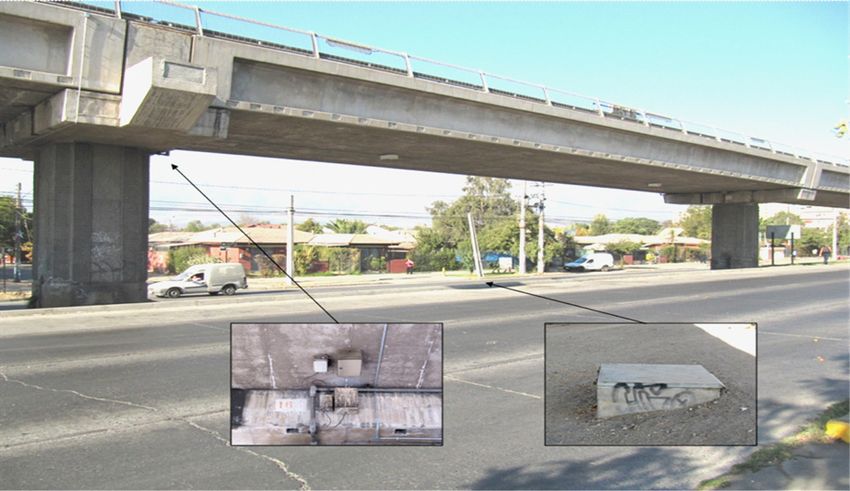
M. Sarrazin et al. / Soil Dynamics and Earthquake Engineering 47 (2013) 117–131                         123

                                        Fig. 8. Transverse records, 27/02/2010 earthquake. Marga Marga Bridge.

(sensor 4) and top of pier (sensor 8) is apparent. The acceleration            maximum peak of 203 for 2.5 Hz and a smaller one of 40 for 5 Hz.
in both horizontal directions at the pier top (sensors 8 and 9) is             With this information, it is possible to identify some predominant
almost twice the acceleration at the bottom pier (sensors 10 and               frequencies and equivalent damping measured during this earth-
11). The longitudinal acceleration is quite similar between the                quake, which are shown in Table 4. The design frequency was
‘‘free field’’ (sensor 1) and the pier bottom (sensor 11). Transverse           0.83 Hz, much lower than the values determined till now. Damp-
accelerations at both ends of the beam (sensors 6 and 12) are very             ing is quite low. It was obtained by means of the bandwidth
similar, which indicates the absence of torsion. The motion in the             method [13].
transverse direction on the deck shows quite different frequency                   Integrating twice the acceleration records, the maximum shear
content with respect to the pier top. Vertical acceleration at the             deformations at the bearings were determined. They were 2.2 cm
deck almost double the pier top’s and it is almost 2.5 the value at            and 2.7 cm in longitudinal and transverse directions, which
the free field.                                                                 correspond to 56% and 67% of shear strain. These values are
    The elastic acceleration spectra at the free field ground                   lower than the 3 cm considered as the designed maximum
motions and the design spectrum are quite similar, as can be                   allowed displacements. [14].
seen in Fig. 20.
    Fourier spectra of sensors 1 and 11 are quite similar: it is hard          4.3. Mathematical model
to find any significant peak until 6 Hz, indicating that at both
places the soil is quite rigid. At the pier top, the spectrum up to                A three-dimensional model was developed using SAP2000 that
2.2 Hz is quite similar to the pier bottom, but there is a peak of             included frame elements representing the piers and superstruc-
24.1 at 2.52 Hz and a maximum peak of 33.6 around 7 Hz. At the                 ture, and rubber isolator elements representing the bearings.
beam (sensor 4) there is a maximum peak of 29.3 at 1.4 Hz. From                Lateral springs were used to represent the soil confinement.
4 Hz up the energy is negligible. In the transverse direction, at the          Three continuous span were considered, the span at the left,
free field and pier bottom (sensors 3 and 10), up to 6.4 Hz, the                which is closer to Mirador Station, is 27 m long, while the span
energy is almost uniformly distributed in frequencies; the same                length of the other two is 36 m. The height of the columns is 8 m.
can be observed in the longitudinal direction. From 7.3 Hz up the              In order to fit the model to the predominant frequencies deter-
energy is negligible. At the pier top there is a maximum of 90                 mined experimentally from the earthquake records, the piers,
around 6.7 Hz. At the beam, sensors 6 and 12 coincide at a                     bearings and soil spring stiffness were varied. Changes in bearing
maximum peak of 116 for 1.25 Hz and a smaller one at 3 Hz.                     stiffness affected the vibration modes containing deck move-
From 4 Hz up the energy is negligible. In the vertical direction,              ments; changes in the soil stiffness affected mainly the modes
sensors 2 and 7 almost coincide, but on the beam, sensor 5 has a               containing piers’ movements; and changes in the mechanical
124                                M. Sarrazin et al. / Soil Dynamics and Earthquake Engineering 47 (2013) 117–131

                                       Fig. 9. Vertical records, 27/02/2010 earthquake. Marga Marga Bridge.

                                               Fig. 10. Elastic response spectra, Marga Marga bridge.

properties of the concrete affected mainly the modes containing              5. Conclusions
vertical movements. The best result was obtained for ‘‘high soil
spring stiffness’’ and about 8% rubber shear distortion,                        Despite the magnitude of the February 27th, 2010 earthquake,
(G ¼2.0 MPa). Theoretical frequencies are also shown in Table 4.             most road structures had an adequate performance. However,
   Modal damping was varied to fit acceleration and displace-                 while less than 0.15% of the exposed structures in the stricken
ment time history records. The best fit was obtained for damping              area were damaged or unserviceable, there was a critical situation
much higher than the one estimated with the half band-width                  for surface transportation, which was vital for assisting the
method.                                                                      affected communities.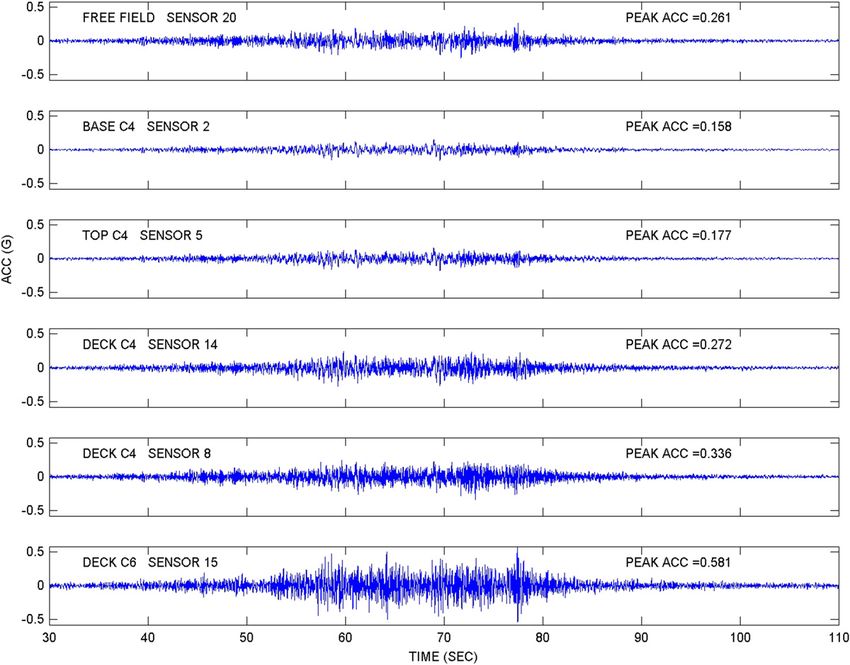
M. Sarrazin et al. / Soil Dynamics and Earthquake Engineering 47 (2013) 117–131                           125

                                    Fig. 11. Square Fourier Spectra, 27/02/2010 earthquake. Marga Marga Bridge.

                                    Fig. 12. Square Fourier Spectra, 27/02/2010 earthquake. Marga Marga Bridge.

   As a consequence of the damage observed in different types of              length at abutments, piers, and joints of girders, seating length at
bridge during the February 27th, 2010 earthquake, the Ministry of             abutments for skew bridges, and unseating prevention structures
Public Works elaborated a document that corrects the Chilean                  connecting the superstructure with the substructure. In all these
code for structural design of bridges, increasing the requirements            cases the new specifications were taken from the Japanese
for new bridges [15]. The main changes were related to seating                code [16]. Additional specifications are related to the size of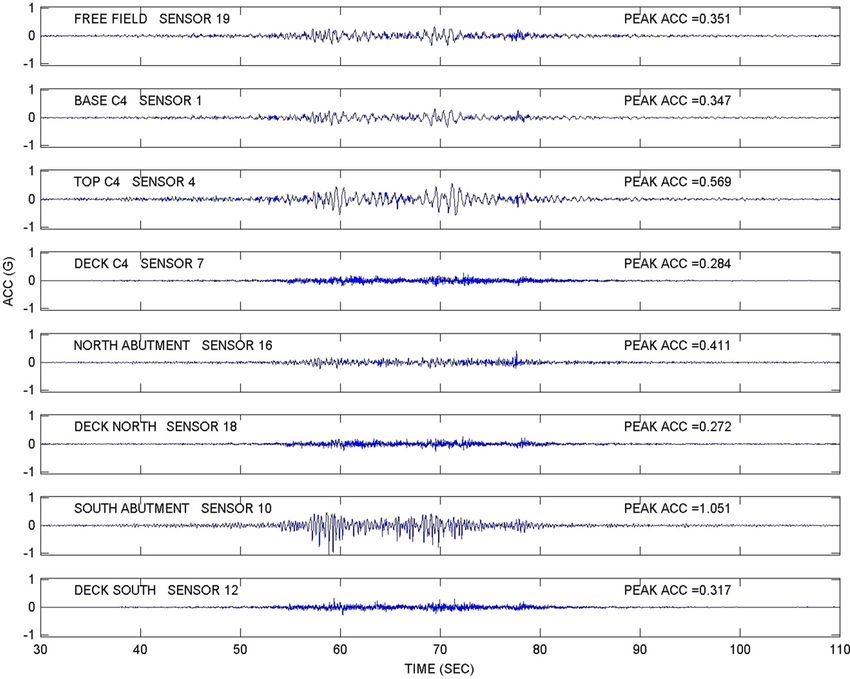
Table 2
Frequency analysis, Marga Marga Bridge, 27/2/2010 earthquake.

 Interval                        Direction                   Sensorn                 Frequency (Hz)                Damping (%)                 Comments

 1 (0–50.4 sec)                  Longitudinal                pier top                1.42–1.55
                                                             deck                    0.57–0.66                     9–10
                                 Transverse                  pier top                1.16
                                                             deck                    0.75
 2 (50.4–84.8 sec)               Longitudinal                deck                    0.40                          6.3                         Strong motion interval
                                                             deck                    0.75                          3.6
                                                             all                     1.21
                                 Transverse                  deck                    0.43–0.48                     11.4–12
                                                             all                     0.93
                                                             all                     1.05
                                 Vertical                    all                     1.2–1.29
                                                             deck                    2.37–2.64
 3 (84.8–170 sec)                Longitudinal                deck                    0.49                          19.5                        Signal decay
                                                             all                     1.14–1.4
                                 Transverse                  all                     1.21

    n
      This column indicates the location of the sensors that contribute with energy to each mode, i.e, in longitudinal direction, pier top represents sensor 4 and deck
represents sensors 7, 12 and 18.

                           Fig. 13. Comparison between experimental and theoretical response, Marga Marga Bridge, longitudinal direction.

                          Fig. 14. Comparison between experimental and theoretical response, Marga Marga Bridge, transverse direction.
M. Sarrazin et al. / Soil Dynamics and Earthquake Engineering 47 (2013) 117–131 127
Fig. 15. Comparison between experimental and theoretical response, Marga Marga Bridge, vertical direction.
5
4
12 6
8
7
9
2 11
1 10
3
Fig. 16. General view, Line 5 viaduct and Local acceleration network in Line 5 viaduct.128 M. Sarrazin et al. / Soil Dynamics and Earthquake Engineering 47 (2013) 117–131
Table 3 temperature joints, vertical anchorage bars at abutments and the
Frequency analysis, moderate earthquakes. Line 5 metro viaduct. compulsory use of transverse diaphragms between girders at the
Mode Direction Frequency (Hz)
abutments and at the center of span.
The seismically isolated structures had good performance, and
Minimum Maximum thanks to the instrumentation installed in some of them, impor-
1 Longitudinal 1.5 2.6
tant information about their response to severe earthquakes was
2 Transverse 1.4 2.4 obtained for the first time. In general, there were significant
3 Vertical 2.6 3.1
reductions in the longitudinal directions of the bridges and,
Fig. 17. Longitudinal acceleration records and square Fourier spectra, 27/02/2010 earthquake. Line 5 viaduct.M. Sarrazin et al. / Soil Dynamics and Earthquake Engineering 47 (2013) 117–131 129 Fig. 18. Transverse acceleration records and square Fourier spectra, 27/02/2010 earthquake. Line 5 viaduct.
130                                            M. Sarrazin et al. / Soil Dynamics and Earthquake Engineering 47 (2013) 117–131

                                Fig. 19. Vertical acceleration records and square Fourier spectra, 27/02/2010 earthquake. Line 5 viaduct.

                                                                                         evaluate. Marga Marga Bridge and Metro viaduct performed as
                                                                                         expected during the design phase.

                                                                                         Acknowledgments

                                                                                            This research was made possible by the financial support from
                                                                                         the Universidad de Chile, the Ministry of Public Works (MOP),
                                                                                         Metro de Santiago and Fondecyt, which have provided funding for
                                                                                         equipment, installation, and maintenance during more than a
                                                                                         decade. Additional support was provided by CONICYT-Chile post-
                                                                                         graduate fellowship program to Braian Venegas, Master Student
                                                                                         at University of Chile.

              Fig. 20. Design and elastic response spectra, Metro.
                                                                                         Appendix A. Supporting information

                                                                                            Supplementary data associated with this article can be found in
Table 4
                                                                                         the online version at http://dx.doi.org/10.1016/j.soildyn.2012.06.019.
Frequency analysis, 27/02/2010 earthquake, Line 5 Metro Viaduct.

 Mode Direction                 Experimental                    Theoretical

                                Frequency (Hz) Damping (%)       Frequency (Hz)          References

 1      Transverse              1.25              1.8           1.32                      [1] Barrientos S. Earthquake Cauquenes, February 27, 2010. Technical Report
 2      Longitudinal            1.4               0.8           1.26                          Updated May 27, 2010, /http://ssn.dgf.uchile.clS; 2010.
 3      Vertical longitudinal   2.5               0.5           2.57                      [2] Boroschek R, Soto P, León R, Comte D. Terremoto Centro Sur, 27 Febrero 2010.
 4      Transverse              3.0               0.6           2.36                          Informe Preliminar No. 4, /www.renadic.clS; 2010.
 5      Vertical                5.0               0.2           5.79                      [3] Kunde MC, Jangid RS. Seismic behaviour of isolated bridges: a-state-of-the-
                                                                                              art review. Electronic Journal of Structural Engineering 2003;3.
                                                                                          [4] Chaudhary M. Evaluation of seismic performance of base-isolated bridges
                                                                                              based on earthquake records. PhD dissertation. Department of Civil Engineer-
although vertical movement was amplified, this fact was not
                                                                                              ing, Japan: University of Tokyo; 1999.
critical for the structures. Bearings didn’t show any sign of                             [5] Huang MC, Wang YP, Chang JR, Chang Chien CS. Physical system identifica-
distress.                                                                                     tion of an isolated bridge using seismic response data. Structural Control and
    The frequency responses of the bridges have been predicted by                             Health Monitoring 2009;16:241–65.
                                                                                          [6] Moroni MO, Sarrazin M, Benavides C, Dı́az A. Caracterı́sticas dinámicas de
computational models. For the Marga Marga Bridge, non-synchronic                              puentes chilenos con protección sı́smica. Revista Sul-Americana de Engen-
input motions had to be considered. Modal damping is very hard to                             haria Estructural, Passo Fundo 2004;1(2):55–73.
M. Sarrazin et al. / Soil Dynamics and Earthquake Engineering 47 (2013) 117–131 131
[7] Hube M, Santa Marı́a H, Villalobos F. Preliminary analysis of the seismic [12] Sarrazin M, Moroni MO, Romo D, Quintana J, Soto P. Respuesta sı́smica de
response of bridges during the Chilean 27 February 2010 earthquake. Obras y puentes chilenos con apoyos aislantes. Revista Internacional De Desastres
Proyectos 2010;8:48–57. Naturales, Accidentes e Infraestructura Civil 2002;2(2):31–48.
[8] Yen W, Chen G, Buckle I, Allen T, Alzamora D, Ger J, et al. Post earthquake [13] Tanaka T, Yoshizawa S, Osawa Y, Morishita T. Period and damping of
Reconnaissance Report on Transportation Infrastructure Impact of the Feb- vibration in actual building modes. Bulletin of the Earthquake Research
ruary 27, 2010, offshore Maule Earthquake in Chile, FHWA-HRT-11-030. US Institute 1969;47:1073–92.
Department of Transportation; 2011. [14] Sarrazin M, Saragoni R, Araya M, Gonzalez A, Izzo F, Vergara R. Applications
[9] Boroschek R, Moroni MO, Sarrazin M. Dynamic Characteristics of a long span of seismic isolation to the Santiago metro, line 5 and the Rodelillo Viña Del
seismic isolated bridge. Engineering Structures 2003;25:1479–90. Mar highway bridge. In: Proceedings of the international post-smirt con-
[10] Taylor D, Trigo T, Moroni MO, Sarrazin M., Análisis dinámico del puente Marga– ference seminar on seismic isolation, passive energy dissipation and control
Marga considerando variación espacial del movimiento sı́smico. In: Proceedings of vibrations of structures, Santiago, Chile; 1995. pp. 431–44.
of the XXXIII Jornadas Sudamericanas de Ingenierı́a Estructural; 2008. [15] Nuevos Criterios Sı́smicos para el Diseño de Puentes en Chile. Department of
[11] Dai W, Moroni MO, Roesset JM, Sarrazin M. Effect of isolation pads and their Projects and Structures, Engineering Division, Roads Direction, Ministry of
stiffness on the dynamic characteristics of bridges. Engineering Structures Public Works; 2011.
2006;28(9):1298–306. [16] Specifications for Highway Bridges, Part V Seismic Design. Japan; 2002.You can also read