Solar Energy Development in Pakistan: Barriers and Policy Recommendations - MDPI

Page created by Corey Payne
 
CONTINUE READING
Solar Energy Development in Pakistan: Barriers and Policy Recommendations - MDPI
sustainability

Article
Solar Energy Development in Pakistan: Barriers and
Policy Recommendations
Muhammad Irfan * , Zhen-Yu Zhao *, Munir Ahmad                and Marie Claire Mukeshimana
 Beijing Key Laboratory of New Energy and Low Carbon Development, School of Economics and Management,
 North China Electric Power University, Beijing 102206, China; munirahmad@ncepu.edu.cn (M.A.);
 muclairese@hotmail.com (M.C.M.)
 * Correspondence: irfan@ncepu.edu.cn (M.I.); zhaozhenyuxm@263.net (Z.-Y.Z.);
   Tel.: +86-156-1189-7375 (M.I.); +86-10-6177-3150 (Z.-Y.Z.)
                                                                                                    
 Received: 7 January 2019; Accepted: 19 February 2019; Published: 25 February 2019                  

 Abstract: Energy generation is heavily dependent on fossil fuels in Pakistan. Due to the huge
 population and current progress in industrialization, these sources are not fulfilling the existing energy
 needs of the country. Meanwhile, they have adverse environmental impacts and are economically
 unsuitable to electrify remote areas. Consequently, there is a need to look for alternate energy sources.
 The aim of this paper is to find out the best renewable energy option for Pakistan. For this purpose,
 we have collected data for solar radiation and wind speed for a period of one year in four major cities
 of Pakistan. Results indicate that solar energy is the best renewable energy option for Pakistan in
 terms of price, life span, operation and maintenance cost. Key barriers have been identified over
 the whole solar energy spectrum through semi-structured interviews with industry professionals.
 And finally, important policy recommendations have been proposed for institutions and government
 to overcome these barriers and utilize maximum solar energy in the country.

 Keywords: solar energy; resource potential; metrological data; barriers; policy recommendations;
 Pakistan

1. Introduction
      Energy plays a key role in the development of modern economies. All human activities i.e.,
education, health care, agriculture and employment require energy for proper functioning. A country
cannot succeed without proper utilization of energy. It is considered the main component of a country’s
economy [1]. Pakistan is a developing country. Due to recent development and to support its large
population and industry, the country needs a huge amount of energy to keep all things on track [2,3].
However, there is a shortage of energy supply and the country is in its worst energy crisis. The gap
between electricity demand and supply has been increased in the past few years and is highly obvious
during summer season [4] which has resulted in the complete shutdown of power for 10–12 h in urban
areas and for 16-18 h in rural areas [5–8].
      Energy shortage problems not only affect the life of individuals but also hindering the economic
development of the country. All sectors including agricultural, industrial, transport, domestic and
energy generation have been affected severely due to long power outages and caused huge economic
loss to the country. The current share of renewable energy is insufficient in the total energy mix of
Pakistan [9]. The country fulfills its energy needs by utilizing fossil fuels [10]. Huge dependency on
fossil fuels not only has a burden on the national economy but also have led to different environmental
hazards like the greenhouse effect, CO2 emissions, global warming and irregular weather patterns.
Moreover, natural resources are being exhausted due to overuse of fossil fuels. Hence, there is a need
to develop a new energy economy. In this new economy, renewable energy sources (wind, solar and

Sustainability 2019, 11, 1206; doi:10.3390/su11041206                    www.mdpi.com/journal/sustainability
Solar Energy Development in Pakistan: Barriers and Policy Recommendations - MDPI
Sustainability 2019, 11, 1206                                                                        2 of 18

biomass) will be utilized to produce energy which can decrease the fossil import bill on one hand,
and lessen the climatic challenges on the other hand [11].
      Energy demand is increasing by more than 9% annually in Pakistan. It is expected that energy
demand will increase 8-fold by 2030 and 20-fold by 2050 in Pakistan [12]. The major reason of energy
crises in Pakistan is that energy structure is mainly dependent on thermal resources including coal,
oil and natural gas which are expensive as well as are under huge pressure of shortage. In the recent
past, the share of hydroelectricity has reduced significantly. Moreover, renewable energy sources only
fulfill 0.3% of the energy needs of the country, which is almost negligible. Among different renewable
energy options, solar energy has the potential to tackle all these challenges. It has emerged as the
most competitively priced technology worldwide. According to the International Energy Agency,
global capacity of solar PV had reached 402 gigawatts (GW) at the end of 2017. It will further expand
by almost 580 GW and lead the renewable electricity capacity growth [13]. Luckow et al. [14] found
out the institutional and technical barriers associated with solar energy. The European commission
carried out research programs on solar energy for almost two decades to reduce pollution and carbon
emissions, ensure energy security and diversify energy mix of European countries [15].
      Geographically, Pakistan lies in the sun belt and receives massive amounts of sunlight all through
the year. To address the current energy issues, it is very important to exploit the existing solar energy
resources. Meanwhile, public and private sector investment is very important to harness its true
potential [16]. Many researchers have focused on solar energy to estimate its potential for proper
utilization in the country [17]. Khalil and Zaidi [18] found out the reasons for energy crises in Pakistan.
Shaikh et al. [19] stressed on the importance of solar energy as a natural asset for Pakistan. Farooq and
Shakoor [5] suggested solar thermal as the best option for current energy crises in the country. Farooq
and Kumar [20] assessed the technical potential to generate electricity from solar technology. Shakeel et
al. [21] reported that the country has an overall solar power potential of 1600,000 MW. Mirza et al. [22]
discussed the outlook and status of utilization of solar energy in Pakistan and highlighted the role
of research and development organizations to develop solar energy in the country. Muneer et al. [3]
described the potential applications of solar thermal i.e., solar water heaters for the textile industry.
Ghafoor and Munir [6] designed an off-grid PV system for domestic users. Some researchers found
challenges associated with renewable energy [23–28]. But no one has tried to compare indigenous
renewable energy sources over different factors to realize the best energy choice for Pakistan.
      To bridge this research gap, it is very crucial to carry out comprehensive research. This study
is the first attempt to find out the best energy option for Pakistan, among many renewable energy
sources. We have compared the efficiency of wind turbines and solar radiation intensity in four major
cities of Pakistan. For this purpose, data was collected every month for a period of one year. The data
was then analyzed by employing MAT Lab and RT Screen. The research findings indicate that solar
energy is the best renewable energy option for Pakistan due to many factors such as price, operation
and maintenance costs and life span. Moreover, we found the major barriers associated with solar
energy in Pakistan by conducting semi-structured interviews with industry professionals. Finally,
we have proposed policy recommendations for government and key stakeholders to overcome these
barriers and further develop the solar power industry in Pakistan.
      The paper is organized as follows, Section 2 examines the worldwide status of solar energy.
Section 3 compares the solar energy utilization among Pakistan, India and China. Section 4 discusses
the geography, topography and socioeconomic profile of Pakistan. The current energy scenario in
Pakistan has been described in Section 5. Section 6 discusses the grid structure and situation of solar
energy in Pakistan. Section 7 illustrates the methods used to conduct this research. Solar energy
applications have been described in Section 8. Barriers to solar energy development have been
discussed in Section 9. Section 10 is devoted to the policy recommendations for solar energy
development. And finally, Section 11 concludes the study.
Solar Energy Development in Pakistan: Barriers and Policy Recommendations - MDPI
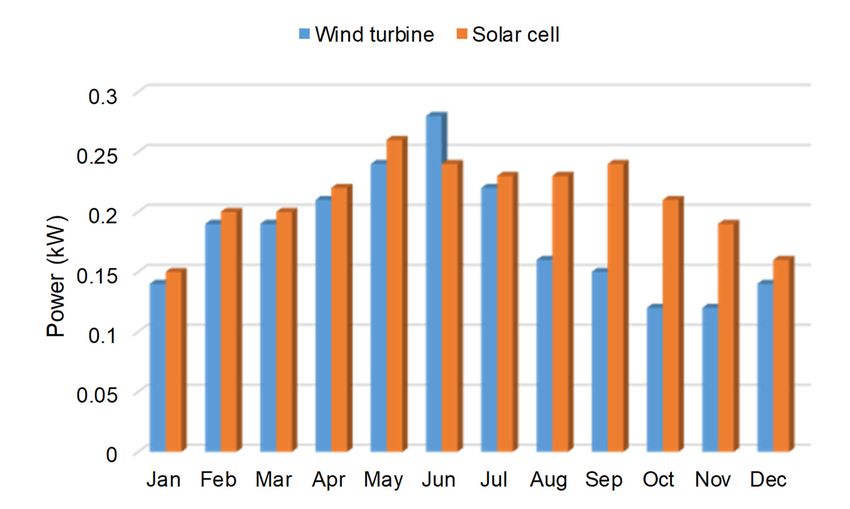
Sustainability 2019, 11, x FOR PEER REVIEW                                                                  3 of 19
      Sustainability 2019, 11, 1206                                                                                3 of 18

 95          According to renewables global status report, the global solar photovoltaic (PV) installed
 96    capacity  reached
      2. Worldwide        402ofGW
                     Status        at Energy
                                Solar  the end of 2017. Up to 98 GW were added during 2017 and the global
 97    solar PV installed capacity was 303 GW at the end of 2016. Table 1 shows the top 10 countries with
 98    theirAccording to renewables
             cumulative               global
                         installed solar  PV status  report,
                                              capacity.  It is the  globalfrom
                                                                obvious     solarTable
                                                                                  photovoltaic   (PV)
                                                                                         1 that 86% ofinstalled
                                                                                                       the totalcapacity
                                                                                                                 solar PV
 99   reached  402 GW   at the end  of  2017. Up  to  98 GW     were   added    during    2017
       capacity has been installed by these countries and the share of other countries in the  and the  global
                                                                                                           worldsolar PV
                                                                                                                   is only
100   installed
       14% [29].capacity was 303 GW at the end of 2016. Table 1 shows the top 10 countries with their
      cumulative installed solar PV capacity. It is obvious from Table 1 that 86% of the total solar PV capacity
101   has been installed by these
                              Tablecountries
                                    1. Top 10 and  the share
                                              cumulative   solar ofPV
                                                                    other  countries
                                                                      capacity  in the in the world
                                                                                       world  2017. is only 14% [29].

              Country                      Total
                                Table 1. Top     End-2016 solar PV
                                             10 cumulative       Added during
                                                                   capacity      2017
                                                                             in the world 2017. Total End-2017
              China                              78.1                   53.1                          131.1
                        Country              Total End-2016      Added during 2017        Total End-2017
              United States                      40.4                   10.6                            51
              Japan       China                    78.1
                                                  42                    53.1
                                                                          7                     131.1   49
                      United States                40.4                 10.6                      51
              Germany                            40.7                    1.7                           42.4
                          Japan                      42                   7                       49
              Italy     Germany                  19.3
                                                   40.7                  0.4
                                                                        1.7                      42.4 19.7
              India        Italy                   19.3
                                                  9.2                   0.4
                                                                         9.1                     19.7 18.3
                           India                     9.2                 9.1                     18.3
              United Kingdom                     11.8                    0.9                          12.7
                    United Kingdom                 11.8                  0.9                     12.7
              France      France                  7.27.2                 0.9
                                                                         0.9                       8     8
              Australia Australia                  66                   1.3                       7.2 7.2
              Spain       Spain                   5.55.5                 0.1
                                                                         0.1                      5.6 5.6
                    Rest of the world                43                  14                       57
              Rest of the world
                       Total Top 10               43260                  14
                                                                         85                      345 57
              Total Top  10 Total
                       World                     260303                  85
                                                                         98                      402 345
              World Total                           303                    98                          402
102          China,the
           China,   theglobal
                        globalleader
                                leaderininthe
                                           thesolar
                                               solarenergy
                                                       energysector
                                                                sectorhas
                                                                       hasprogressed
                                                                            progressedremarkably
                                                                                        remarkablyin  inthe
                                                                                                         therecent
                                                                                                              recentpast.
                                                                                                                      past.
103    The  country  had  a total installed  solar  PV  capacity   of 131.1 GW   at the end  of 2017. The
      The country had a total installed solar PV capacity of 131.1 GW at the end of 2017. The United StatesUnited   States
104    installed51
      installed  51GW
                    GWofofsolar
                            solarPVPVand
                                       andranks
                                            rankssecond.
                                                    second.Similarly,
                                                              Similarly,Japan
                                                                          Japan49
                                                                                49GW,
                                                                                    GW,Germany
                                                                                         Germany42.442.4GW,
                                                                                                          GW,Italy
                                                                                                                Italy19.7
                                                                                                                       19.7
105    GW,   India 18.3 GW,   United   Kingdom      12.7  GW,   France  8  GW,  Australia  7.2 GW,
      GW, India 18.3 GW, United Kingdom 12.7 GW, France 8 GW, Australia 7.2 GW, and Spain 5.6 GW.   and   Spain   5.6 GW.
106    Figure11shows
      Figure     showsthe
                        thepercentage
                             percentageshare
                                          shareofoftotal
                                                     totalinstalled
                                                           installedsolar
                                                                      solarPV
                                                                            PVcapacity
                                                                               capacityinintop
                                                                                            topcountries
                                                                                                 countriesofofthe
                                                                                                               theworld.
                                                                                                                   world.

                                                                                      Rest of the
                                Australia      Spain                                    world
                    France        2%            1%                                       14%
                      2%

                                                                                                 China
                           United                                                                 33%
                          Kingdom
                             3%

                            India
                             5%

                             Italy
                              5%

                                       Germany                                             United States
                                         10%              Japan                                 13%
                                                           12%
107
            Figure 1. Percentage share of installed solar photovoltaic capacity in top countries of the world [29].
108          Figure 1. Percentage share of installed solar photovoltaic capacity in top countries of the world [29].
      3. Comparison of Solar Energy Utilization in Pakistan, India and China
109    3. Comparison of Solar Energy Utilization in Pakistan, India and China
           Fossil fuels are the main sources of energy generation in major Asian countries like Pakistan,
110         Fossil
      India and     fuels Pakistan
                 China.   are the main
                                    uses sources  of energy
                                          natural gas        generation
                                                      (44%) as           in major
                                                                a major source    Asian countries
                                                                               of electricity       like Pakistan,
                                                                                              generation. On the
111    Indiahand,
      other  and China.    Pakistan
                   the major         usesgeneration
                              electricity  natural gassource
                                                       (44%)ofasIndia
                                                                 a major
                                                                      andsource
                                                                          China of electricity
                                                                                is Coal  whichgeneration.  On
                                                                                                accounts for   the
                                                                                                             57%
112    other hand, the major electricity generation source of India and China is Coal which accounts for 57%
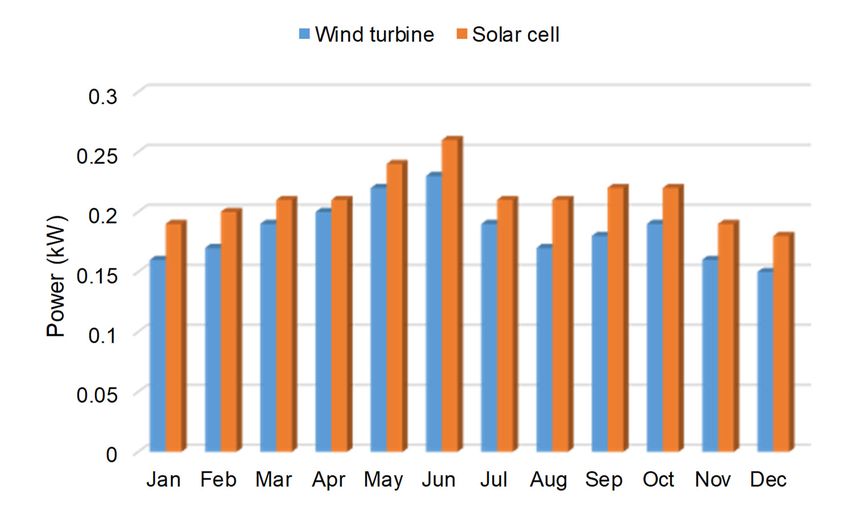
Solar Energy Development in Pakistan: Barriers and Policy Recommendations - MDPI
Sustainability
        Sustainability 2019,
                       2019, 11,
                             11, x1206
                                   FOR PEER REVIEW                                                                               44of
                                                                                                                                    of 19
                                                                                                                                       18
       Sustainability 2019, 11, x FOR PEER REVIEW                                                                               4 of 19
 113    and 72% respectively [30–32]. Scarce fossil fuels are under huge pressure of shortage due to massive
 114
113     and72%
        use.
       and   72%   respectively
             Therefore,           [30–32].Scarce
                           governments
                  respectively   [30–32].  inScarce   fossil
                                               thesefossil   fuelsare
                                                       countries
                                                            fuels   areunder
                                                                   are   underhuge
                                                                        looking    huge    pressure
                                                                                    for clean
                                                                                         pressureandofof   shortagedue
                                                                                                       renewable
                                                                                                         shortage     duetotomassive
                                                                                                                     energy   massive
                                                                                                                              sources,
 115
114     use. Therefore,
        especially
       use.                governments
                     solargovernments
            Therefore,     energy, to reducein  these
                                          in thesetheircountries
                                                         dependence
                                                      countries     are  looking     for
                                                                        on traditional
                                                                  are looking             clean
                                                                                   for clean     and
                                                                                             sources    renewable     energy   sources,
                                                                                                        of energy.energy sources,
                                                                                               and renewable
 116
115     especially
             China
       especially    solar
                      made
                    solar  energy,  toreduce
                                       reduceintheir
                             great progress
                          energy,  to             their
                                                   Solardependence      ontraditional
                                                          energy generation
                                                       dependence      on    traditional    sources
                                                                                  as compared
                                                                                            sources    of
                                                                                                    toof   energy.and India. Figure
                                                                                                        Pakistan
                                                                                                           energy.
 117
116           China
        2 shows       made
                   China’s   great
                            quick  progress
                                   progress   in
                                               on  Solar
                                                    solarenergy
                                                          energy  generation
                                                                   generation   as   compared
                                                                                   from
            China made great progress in Solar energy generation as compared to Pakistan   2008  toto Pakistan
                                                                                                     2017.        and
                                                                                                             Within    India.
                                                                                                                   andthis     Figure
                                                                                                                           period,
                                                                                                                        India.      the2
                                                                                                                               Figure
 118
117     shows
       2installedChina’s
                   capacity
         shows China’s     quick   progress
                             increased
                           quick         from
                                  progress     on
                                              on113 solar
                                                      MW
                                                   solar   energy    generation
                                                            to 131,100
                                                         energy                       from
                                                                          MW indicating
                                                                  generation                 2008
                                                                                  from 2008marvelousto   2017.    Within
                                                                                                              growth.
                                                                                                to 2017. Within           this  period,
                                                                                                                     thisPakistan  and
                                                                                                                          period, the
 119
118     the installed
        India  on  the  capacity
                        other handincreased
                                     are far   from
                                              behind  113  MW
                                                        China    to
                                                                in   131,100
                                                                    solar      MW
                                                                           energy      indicating
                                                                                       utilization.  marvelous
                                                                                                      Figure
       installed capacity increased from 113 MW to 131,100 MW indicating marvelous growth. Pakistan and         3   growth.
                                                                                                                  compares    Pakistan
                                                                                                                             the  solar
 120
119     and India
        energy
       India      theon  the other
              ongeneration
                      other  hand   hand
                               between
                                    are farare
                                         Pakistanfar behind
                                             behind   and
                                                       China  China
                                                            India  from
                                                               in solarin energy
                                                                           solar
                                                                           2008 to energy
                                                                                       2017.utilization.
                                                                                              At the
                                                                                     utilization.       endFigure
                                                                                                    Figure    of      3 compares
                                                                                                                  2017,
                                                                                                              3 compares Pakistan   the
                                                                                                                                   had
                                                                                                                            the solar
 121
120     solar
        an
       energy  energy
           installed    generation
                       solar
                generation   capacity
                              betweenbetween
                                       of  730 MW
                                        Pakistan  Pakistan
                                                       while
                                                     and     and  India
                                                              India
                                                           India  fromhad  from  to2008
                                                                             18,300
                                                                          2008         MW
                                                                                     2017.to [33].
                                                                                             2017.
                                                                                             At  theAt endtheofend  of 2017,
                                                                                                                 2017,       Pakistan
                                                                                                                       Pakistan   had
121     had  an  installed  solar capacity   of   730  MW    while  India
       an installed solar capacity of 730 MW while India had 18,300 MW [33].had    18,300   MW    [33].

 122
122
 123                                           Figure 2. Solar energy generation in China.
                                               Figure 2. Solar energy generation in China.
123                                           Figure 2. Solar energy generation in China.

 124
 125
124                        Figure
                           Figure 3.
                                  3. Comparison
                                     Comparison of
                                                of solar
                                                   solar energy
                                                         energy generation
                                                                generation between
                                                                           between Pakistan and India.
125     4. Geography,
                          Figure 3. Comparison of solar energy generation between Pakistan and India.
           Geography, Topography
                      Topography and
 126    4.                       and Socioeconomic
                                     Socioeconomic Profile
                                                   Profileof
                                                           ofPakistan
                                                             Pakistan
126
 127           Pakistan is
       4. Geography,
               Pakistan     placed
                            placed between
                         Topography
                         is               and latitude
                                     between     latitude24
                                                            ◦
                                                           24oand
                                                Socioeconomic       37 ◦
                                                                      37onorth
                                                               andProfile  northofand
                                                                                    andlongitude
                                                                                                        ◦
                                                                                           longitude6262and
                                                                                    Pakistan              o and
                                                                                                                  ◦ degrees east. It is
                                                                                                               7575 o degrees east. It

 128     surrounded    by  4 countries.  On   the  north side,  it shares    its border    with  China.   On the  south
                                                                                                                      theside,  there  is
127      is surrounded
              Pakistan is by  4 countries.
                           placed   betweenOn      the north
                                               latitude        side,37ito shares
                                                          24o and         north and its border
                                                                                         longitudewith62China.
                                                                                                         o and 75 On       south
                                                                                                                   o degrees      side,
                                                                                                                               east.  It
 129     Arabian    sea. India   is on the  east   side, Iran  on   the   west    side  and    Afghanistan     is on  the  north-west
128    isthere  is Arabian
           surrounded    by sea.  India is on
                             4 countries.   Onthe theeast side,
                                                      north      Iran
                                                              side,  it on   the west
                                                                        shares            side and
                                                                                   its border    withAfghanistan
                                                                                                       China. On the is on  the north-
                                                                                                                         south   side,
 130     side  of Pakistan.   Punjab,  Sindh,    Baluchistan,    Khyber       Pakhtunkhwa        and   Gilgit  Baltistan   are the
                                                                                                                                are five
129      west is
       there   side  of Pakistan.
                  Arabian           Punjab,
                            sea. India  is onSindh,
                                               the eastBaluchistan,
                                                         side, Iran on  Khyber
                                                                            the westPakhtunkhwa        and Gilgit is
                                                                                        side and Afghanistan        Baltistan
                                                                                                                       on the north- the
 131     provinces   of Pakistan.   ManyManyfederally   administered       tribal areas     are alsoare
                                                                                                     located   in Pakistan   [22,34].
130      five  provinces   of  Pakistan.            federally   administered         tribal  areas
       west side of Pakistan. Punjab, Sindh, Baluchistan, Khyber Pakhtunkhwa and Gilgit Baltistan are the also  located   in  Pakistan
 132
131      [22,34].
       five   provinces of Pakistan. Many federally administered tribal areas are also located in Pakistan
132    [22,34].
Solar Energy Development in Pakistan: Barriers and Policy Recommendations - MDPI
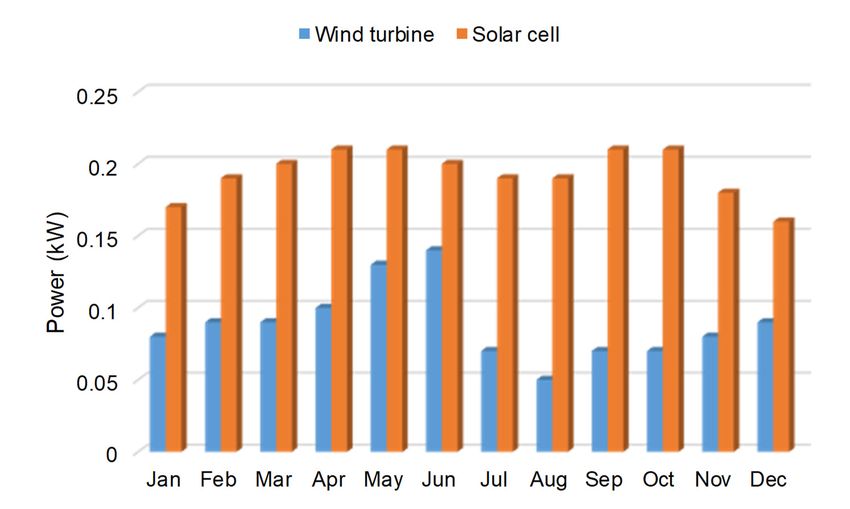
Sustainability 2019, 11, 1206                                                                                                         5 of 18
      Sustainability 2019, 11, x FOR PEER REVIEW                                                                                           5 of 19

133          In Gilgit
            In    Gilgit Baltistan
                            Baltistan and  and northern
                                                 northern areas  areas of
                                                                        of Pakistan,
                                                                            Pakistan, there
                                                                                        there are
                                                                                                are some
                                                                                                     some of of world’s
                                                                                                                world’s largest
                                                                                                                              largest mountain
                                                                                                                                       mountain
134    ranges    i.e., Himalayas,         Hindukush         and    Karakoram.      The  world’s
      ranges i.e., Himalayas, Hindukush and Karakoram. The world’s second highest mountain K-2 is  second    highest    mountain       K-2   is also
                                                                                                                                                also
135    found in
      found     in the
                    the Karakorum
                          Karakorum range    range [16].
                                                     [16]. The
                                                             Theprovinces
                                                                    provinces of  ofPunjab
                                                                                    Punjab andandSindh
                                                                                                    Sindh consists
                                                                                                           consists of  of flat
                                                                                                                            flat plains
                                                                                                                                  plains and
                                                                                                                                          andfivefive
136    rivers which
      rivers    which eventually
                           eventually join   join the
                                                   the Indus
                                                        Indus river.
                                                                   river. The
                                                                           The Indus
                                                                                 Indus is
                                                                                        is the
                                                                                            the largest
                                                                                                 largest river
                                                                                                          river of
                                                                                                                 of Pakistan.
                                                                                                                      Pakistan. On  On the
                                                                                                                                         the west
                                                                                                                                               west
137    side there
      side   there is isthe
                          theBaluchistan
                               BaluchistanPlateauPlateauwhich whichisisan  anarid
                                                                              aridtableland
                                                                                    tablelandsurrounded
                                                                                                 surroundedby   bydry drymountains
                                                                                                                             mountains[22,35].
                                                                                                                                            [22,35].
138          Pakistan is
            Pakistan        is the
                               the 66th    largestcountry
                                      th largest     countryby    bypopulation
                                                                       populationin  inthe
                                                                                         theworld.
                                                                                              world.According
                                                                                                       Accordingto    tothe
                                                                                                                          theUnited
                                                                                                                                United Nations
                                                                                                                                          Nations
139   report, the current population of Pakistan is 202,272,196. Out of a total population, 39.5 percentpercent
       report,    the    current     population       of   Pakistan      is 202,272,196.      Out   of a  total  population,        39.5     of the
140    of the population
      population        lives inlives
                                    urban   inareas.
                                                urbanThe areas.      The country
                                                                country    has a totalhasarea
                                                                                           a total   area ofkm
                                                                                                of 796,096     796,096
                                                                                                                  2 [36]. km    2 [36]. In 2018,
                                                                                                                            In 2018,    the gross
141    the gross product
      domestic       domestic       product
                                 (GDP)      had(GDP)
                                                  reached   had 300reached
                                                                     billion 300   billion US
                                                                              US dollars     withdollars  withgrowth
                                                                                                   an annual     an annual   rategrowth
                                                                                                                                   of 5.8%rate
                                                                                                                                             GDP.  of
142    5.8%   GDP.     In  a  developing        country     like   Pakistan,    the services   and   facilities
      In a developing country like Pakistan, the services and facilities are inadequate to address the          are   inadequate       to address
143    the increasing
      increasing      demandsdemands         of population
                                     of population                 and economy
                                                         and economy                 for energy,
                                                                              for energy,           resulting
                                                                                             resulting          in increasing
                                                                                                        in increasing       pressure pressure
                                                                                                                                        on scarce  on
144    scarce energy
      energy     resources.  resources.       it is expected
                                  it is expected      that the that       the GDP
                                                                     annual    annual    GDP rate
                                                                                     growth     growthwillrate  will decrease
                                                                                                            decrease     from 5.8from to 5.4% 5.8 in
                                                                                                                                                   to
145    5.4%   in  2020,    causing      high    poverty      and    a low   standard    of  living
      2020, causing high poverty and a low standard of living in Pakistan [37]. Although, current   in Pakistan     [37].   Although,      current
146    government policies
      government           policieshavehavehelped
                                                helpedin  inreducing
                                                                reducingpoverty,
                                                                            poverty, aa large
                                                                                          large population
                                                                                                  population is  is still
                                                                                                                     still below
                                                                                                                            below thethe poverty
                                                                                                                                          poverty
147    line and    living     on   less   than   2  US   dollars     per  day.   Figure   4  compares
      line and living on less than 2 US dollars per day. Figure 4 compares the population in South Asian the  population         in South    Asian
148    countries living
      countries      living below
                               below $$ 22per  perday.
                                                    day. ItItisisquite
                                                                  quiteinteresting
                                                                         interestingthat
                                                                                       thatPakistan
                                                                                              Pakistanranks
                                                                                                        ranks3rd3rdin  inthis
                                                                                                                           thiscategory,
                                                                                                                                 category,while
                                                                                                                                              while
149    more poor
      more     poor live
                       live inin India
                                 India and and Bangladesh
                                                 Bangladesh [38].

                                                    90

                                                    80       77%
                                                                          69%
                                                    70
                       Percentage of population

                                                                                         59%          57%
                                                    60

                                                    50

                                                    40

                                                    30                                                         24%
                                                    20                                                                     13%
                                                    10

                                                      0
                                                          Bangladesh      India         Pakistan     Nepal   Sri Lanka   Bhutan
150
                                                  Figure 4. Percentage of population living below $ 2 per day in South Asia [38].
151                                               Figure 4. Percentage of population living below $ 2 per day in South Asia [38].
       5. Current Energy Scenario in Pakistan
152   5. Current Energy Scenario in Pakistan
            Since last century, the demand for energy has increased tremendously all over the world and
153         Sinceislast
       Pakistan      no century,
                         exception.theAll
                                        demand
                                             human  foractivities
                                                         energy has   increased
                                                                  require   energy tremendously      all over the Pakistan
                                                                                     for proper functioning.       world and   is
154   Pakistan   is no  exception.    All   human     activities  require   energy   for proper    functioning.
       struggling with a huge energy crisis at the moment, which not only hindering the progress of country       Pakistan    is
155   struggling   with a huge
       but also affecting         energy
                            the daily       crisis
                                         life      at the moment,
                                              of people.    All majorwhich   not only
                                                                         sectors       hindering
                                                                                  of Pakistan   i.e.,the progress oftransport,
                                                                                                      agriculture,    country
156   but  also affecting   the daily   life  of  people.   All major   sectors  of  Pakistan  i.e.,  agriculture,
       industry and domestic needs a continuous supply of energy. Due to the continuous demand for energy,          transport,
157   industry   and domestic
       the gap between             needs
                           electricity      a continuous
                                        demand                supply
                                                     and supply    hasofincreased,
                                                                           energy. Due    to theincontinuous
                                                                                     resulting      the depletiondemand     for
                                                                                                                     of energy
158   energy,  the[39].
       resources    gapTable
                          between    electricity
                               2 shows             demandinstalled
                                           the electricity    and supply    has increased,
                                                                       capacity              resulting
                                                                                  from different   sourcesin in
                                                                                                             thePakistan
                                                                                                                 depletion   of
                                                                                                                          from
159   energy   resources    [39].  Table
       the period of 2012 to 2016 [4].      2 shows     the  electricity  installed  capacity   from    different  sources   in
160   Pakistan from the period of 2012 to 2016 [4].

161                                                            Table 2. Electricity Installed capacity by type (MW).

                     Type                                        2012             2013             2014       2015          2016
                     Nuclear                                      787             787              787        787            787
                     Renewables                                    1               50              106        439            852
                     Hydel                                       6730             6947             7116       7116          7116
Solar Energy Development in Pakistan: Barriers and Policy Recommendations - MDPI
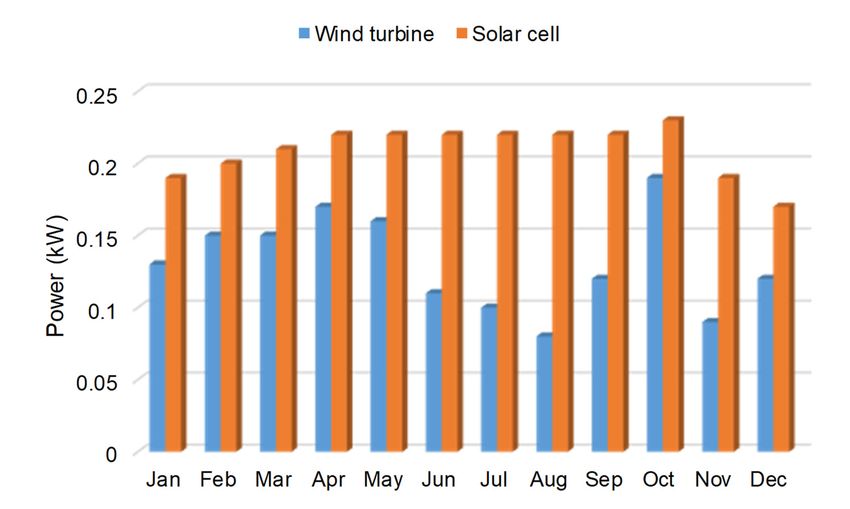
Sustainability 2019, 11, 1206                                                                                                                                                                                        6 of 18

                                               Table 2. Electricity Installed capacity by type (MW).

                                        Type                                          2012                        2013                   2014                 2015                       2016
      Sustainability 2019, 11, x FORNuclear
                                     PEER REVIEW  787        787                                                                  787                         787                         787                             6 of 19
                                  Renewables       1          50                                                                  106                         439                         852
      Sustainability 2019, 11, x FORHydel
                      Thermal        PEER REVIEW
                                           15969 6730 15941 6947                                                               15693
                                                                                                                                  7116                        16619
                                                                                                                                                              7116                        711616619                       6 of 19

                      Total        Thermal23487 159692372515941                                                                  15693
                                                                                                                               23702                         16619
                                                                                                                                                              24961                      1661925374
                     Thermal         Total 15969 2348715941 23725                                                                23702
                                                                                                                               15693                         24961
                                                                                                                                                              16619                      2537416619
162        Although, with the completion of recent projects the total power generation capacity of Pakistan
                  Total                 23487              23725            23702          24961              25374
163   has reached 25,374 MW. But still there is a huge electricity demand and supply gap in the country. In
162
164        Although,
             Although,
      the past         with
                         with
                few years,    the
                               the
                            this  completion
                                 gap  has beenof
                                    completion      ofrecent
                                                        recentprojects
                                                   increased      projects the
                                                                            thetotal
                                                                   many times.  totalpower
                                                                                      powergeneration
                                                                                  According    generation    capacity
                                                                                               to the National capacity ofofPakistan
                                                                                                                    Electric  Pakistan
                                                                                                                                Power
163
165   has reached   25,374  MW.    But  still  there is  a  huge    electricity demand    and   supply
      Regulatory Authority (NEPRA), the gap was 5298 megawatts (MW) at the end of 2016. Figure 5country.
       has  reached   25,374  MW.    But  still  there    is  a huge   electricity demand      and   supplygap  in
                                                                                                                gapthe
                                                                                                                     in country.
                                                                                                                        the         In
                                                                                                                                shows
164
166   the
       In past
      the       few years,
          the past  few
          electricity demandthis and
                          years, gap
                                  thishas
                                       gapbeen
                                      supply   has increased
                                                 gapbeen
                                                       from        many
                                                             increased
                                                                the       times.
                                                                         many
                                                                     period      According
                                                                                 times.
                                                                             of 2012           toItthe
                                                                                          According
                                                                                      to 2016.      wasNational
                                                                                                         to        Electric
                                                                                                             the National
                                                                                                          expected    that thisPower
                                                                                                                                Electric
                                                                                                                                   gap
165
167   Regulatory   Authority   (NEPRA),       the gap   was     5298  megawatts    (MW)   at  the  end
      would continue until 2018, as shown in Figure 6. Meanwhile, electricity prices have increased5
       Power   Regulatory    Authority   (NEPRA),       the    gap  was  5298  megawatts    (MW)     at of
                                                                                                        the 2016.
                                                                                                              end  Figure
                                                                                                                   of 2016.  5  shows
                                                                                                                               Figure
166
168   the electricity
       shows
      enormously      demand
               the electricity
                    which        andits
                               demand
                             makes    supply     gap from
                                          and supply
                                         affordability      gap the  period
                                                                  from
                                                             difficult       of 2012ofto
                                                                        thedomestic
                                                                       for   period      2016.
                                                                                        2012
                                                                                       and    toIt2016.
                                                                                                    was Itexpected
                                                                                            industrial                that
                                                                                                            was expected
                                                                                                           consumers         this
                                                                                                                         [40]. thatgap
                                                                                                                                    this
167   would   continue
       gap would          until until
                     continue    2018,2018,
                                         as shown
                                                as shown in Figure     6. 6.
                                                               in Figure    Meanwhile,
                                                                              Meanwhile,  electricity
                                                                                             electricityprices
                                                                                                            priceshave
                                                                                                                    haveincreased
                                                                                                                            increased
168   enormously
       enormouslywhichwhichmakes
                              makesitsitsaffordability
                                          affordability
                                                 Supply     difficult
                                                              difficult
                                                                Demand for
                                                                        for domestic
                                                                             domestic  and
                                                                                        and
                                                                              Suplus/Deficitindustrial
                                                                                             industrial    consumers
                                                                                                            consumers    [40].
                                                                                                                          [40].

                              25,000                                             Supply                Demand                      Suplus/Deficit

                              25,000

                                                                                                                                                                                         22,559
                              20,000

                                                                                                                                                        21,701
                                                                                                                         20,576
                                          18,940

                                                                                        18,827

                                                                                                                                                                                              22,559
                              20,000
                              15,000

                                                                                                                                                                                               17,261
                                                                                                                                                             21,701
                                                                                                                                                             16,500
                                                                                                                              16,170
                                                                                                                              20,576
                                                                                            14,600
                                               18,940

                                                                                             18,827

                              15,000

                                                                                                                                                                                                    17,261
                              10,000
                                                 12,320

                                                                                                                                                                  16,500
                                                                                                                                   16,170
                      MW MW

                                                                                                 14,600

                              10,000
                                                      12,320

                               5,000

                               5,0000
                                                             2012 2012

                                                                                                2013 2013

                                                                                                                                  2014 2014

                                                                                                                                                                 2015 2015

                                                                                                                                                                                                  2016 2016

                                    0
                               -5,000
                                                                                                     -4427                             -4406                          -5201                            -5298
                               -5,000                           -6620
                              -10,000
169                                                                                                 -4427                             -4406                          -5201                            -5298
                                                                -6620
170                           -10,000Figure 5. Electricity demand and supply during 2012–2016 [4].
169
                                     Figure 5. Electricity demand and supply during 2012–2016 [4].
170                                 Figure 5. Electricity demand and supply during 2012–2016 [4].
                                                                                  Supply                Demand                      Suplus/Deficit

                              40,000                                              Supply               Demand                       Suplus/Deficit
                               35,000
                               40,000
                                                                                                                                                                                          33,776

                               30,000
                               35,000
                                                                                                                                                                                              29,082
                                                                                                                                                        29,059

                               25,000
                                                                                                                                                         27,725

                                                                                                                                                                                               33,776

                               30,000
                                                                                                                         26,663
                                                                                                                         26,439
                                                                                        25,140
                                                                                        24,640
                                          23,816

                               20,000
                                                                                                                                                                                                   29,082
                                                                                                                                                             29,059

                               25,000
                                                                                                                                                              27,725
                                             20,106

                                                                                                                              26,663
                                                                                                                              26,439
                      MW MW

                                                                                             25,140

                               15,000
                                                                                             24,640
                                               23,816

                               20,000
                                                  20,106

                               10,000
                               15,000
                                                                                                                                                                             1334 1334

                                                                                                                                                                                                              4694 4694
                                                                                                                                              224 224

                                5,000
                               10,000
                                    0
                                5,000
                                                          2017 2017

                                                                                                2018 2018

                                                                                                                                  2019 2019

                                                                                                                                                                 2020 2020

                                                                                                                                                                                                  2021 2021
                                                                                                            -500 -500
                                                                         -3710-3710

                               -5,000
                                    0
                              -10,000
171                            -5,000

172                                         Projectedelectricity
                                 Figure6.6.Projected
                              -10,000
                                Figure                electricitydemand
                                                                  demandand
                                                                         andsupply
                                                                             supplyduring
                                                                                    during2017–2021
                                                                                           2017–2021[4].
                                                                                                     [4].
171
172
173                      Figurefor
           The major reason     6. Projected
                                   the power electricity
                                                shortage demand and supply
                                                           and energy       during
                                                                       crises      2017–2021
                                                                              is that         [4]. mix of energy in
                                                                                       the overall
174   Pakistan is extremely dependent on oil, LPG and natural gas which constitutes 78.8% of the total 70.3
173
175        Thetonnes
      million   majorofreason  for the power
                         oil equivalent  (MTOE).shortage   and energy
                                                     The share         crises is thatinthe
                                                               of hydroelectricity      theoverall
                                                                                            primarymix  of energy
                                                                                                     energy   supplyin
174
176   Pakistan is extremely   dependent    on oil, LPG   and natural gas which   constitutes 78.8%  of
      of the country is 11%, coal 7%, Nuclear Electricity 2%, Imported Electricity 0.15%, LNG imported the  total 70.3
175
177   million tonnes
      0.67% and       of oil equivalent
                  renewable              (MTOE).
                              energy 0.27%,          The share
                                              respectively,  asof hydroelectricity
                                                                shown   in Figure 7.in the primary energy supply
Solar Energy Development in Pakistan: Barriers and Policy Recommendations - MDPI
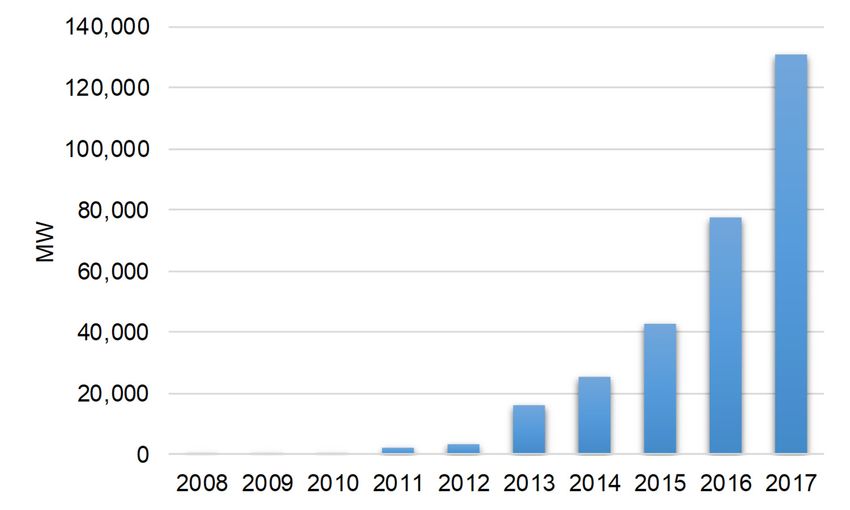
Sustainability 2019, 11, 1206                                                                                               7 of 18

     The major reason for the power shortage and energy crises is that the overall mix of energy in
Pakistan is extremely dependent on oil, LPG and natural gas which constitutes 78.8% of the total
70.3 million tonnes of oil equivalent (MTOE). The share of hydroelectricity in the primary energy supply
of the country is 11%, coal 7%, Nuclear Electricity 2%, Imported Electricity 0.15%, LNG imported 0.67%
and renewable     energy
              Sustainability    0.27%,
                             2019, 11, x FORrespectively,
                                             PEER REVIEW  as shown in Figure 7.         7 of 19

        178
        179                           FigureFigure 7. Primary energy supplies by source [4].
                                             7. Primary     energy supplies by source [4].
        180          In terms of per capita energy consumption, Pakistan is still behind many south Asian countries.
     In181
        termsTable
               of per   capita
                    3 shows      energy
                             the per capitaconsumption,
                                            energy consumption   Pakistan     is still South
                                                                      among different   behindAsianmany     south
                                                                                                     countries [13].Asian
                                                                                                                    It is countries.
Table 3182
        shows   the
             clear    perthecapita
                   from              energy
                             table that        consumption
                                        many South    Asian countries among    different
                                                                          have higher        South
                                                                                        per capita    Asian
                                                                                                   energy      countries [13]. It is
                                                                                                           consumption
       183 the
clear from   than Pakistan.
                 table that many South Asian countries have higher per capita energy consumption
than Pakistan.
       184                Table 3. Comparison of per capita electricity consumption of South Asian countries.

                                   Country            Electricity consumption/pop (kWh/per capita)
                Table 3. Comparison of per capita electricity consumption of South Asian countries.
                                   India                                  920
                                  Sri Lanka
                              Country                                630
                                                   Electricity Consumption/Pop (kWh/per capita)
                                   Pakistan                               500
                              India Bangladesh                            350
                                                                               920
                            Sri Lanka
                                    Nepal                                 170
                                                                               630
                            PakistanAfghanistan                          119.8
                                                                               500
                          Bangladesh                                           350
        185          51 million people still do not have access to electricity in Pakistan. This poses a great challenge
                              Nepal                                            170
        186     to the Pakistani government and policy makers, as electricity is a necessity of modern life. During
        187               Afghanistan                                         119.8
                2016, the electrification rate was 74% in Pakistan (urban population 90% and rural population 63%).
        188     Table 4 compares the electricity access in 2016 among major South Asian countries [41].

     51189
        million people still do not have  Tableaccess    to electricity
                                               4. Electricity                 in Pakistan.
                                                              access in 2016 South Asia.    This poses a great challenge to
the Pakistani Country
               government and     policy
                             Electrification
                                             makers,      as   electricity     is a necessity of modern life. During 2016,
                                                Urban electrification Rural electrification Population without
the electrification rate was 74%ratein Pakistan (urban
                                     (%)                rate (%)population rate   90%(%)and rural  population
                                                                                              electricity (millions) 63%). Table 4
               India                82                     97                       74                  239
compares the electricity access in 2016 among major South Asian countries [41].
                  Pakistan                  74                 90                     63                   51
                  Bangladesh                75                 90                     67                   41
                                           Table 4. Electricity access in 2016 South Asia.
                  Nepal                     77                 97                     72                    7
                  Sri Lanka                 100               100                    100                  0
                    Electrification Urban Electrification                Rural Electrification            Population without
    Country
                       Rate (%)                   Rate (%)                       Rate (%)                Electricity (Millions)
        190   5.1. Meteorological Data
      India                82                         97                             74                              239
        191        The National Renewable Energy Laboratory (NREL) has developed a geospatial toolkit and solar
    Pakistan
        192                74                         90                             63
              maps to begin solar energy projects in Pakistan, as there is no authentic data available about solar
                                                                                                                      51
   Bangladesh
        193   irradiance. For this purpose, nine locations were recognized to gather reliable and accurate solar data.41
                           75                         90                             67
      Nepal                77                         97                             72                                7
    Sri Lanka             100                        100                            100                                0

5.1. Meteorological Data
   The National Renewable Energy Laboratory (NREL) has developed a geospatial toolkit and solar
maps to begin solar energy projects in Pakistan, as there is no authentic data available about solar
Sustainability 2019, 11, 1206                                                                          8 of 18

irradiance. For this purpose, nine locations were recognized to gather reliable and accurate solar data.
The Alternative Energy Development Board (AEDB) has installed weather stations at these prime
locations as shown in Table 5 [42]. The World Bank has provided the required funding for the project.
The World Bank will publish more accurate solar maps after observing the data taken from these
weather stations for a period of two years. These maps and atlases not only help the government but
also encourage commercial developers to make their policies accordingly for future projects [43,44].
The World Bank consistently monitored solar energy potential in different areas of Pakistan from
2000 to 2012 and published solar map Diffuse Horizontal Irradiance (DHI). According to this map,
two provinces of Pakistan (Sindh, Baluchistan) have the highest solar potential. In Punjab province,
some deserted areas are also ideal for solar energy. If properly harnessed, solar energy can turn out to
be a sustainable solution for the energy problems of the country.

                                Table 5. Weather stations and their locations in Pakistan.

                                        Weather Station                    Location
                                            NUST                          Islamabad
                                   MNS campus, UET Lahore                   Multan
                                       NED University                       Karachi
                                          BUITEMS                            Quetta
                                   Quaid-e-Azam Solar Park               Bahawalpur
                                            BUET                           Khuzdar
                                     Mehran University                     Jamshoro
                                   KSK Campus UET Lahore                Kala Shah Kaku
                                            UET                            Peshawar

5.2. Resource assessment of Solar energy in Pakistan
     According to the Medium-Term Development Framework 2006, Pakistan plans to increase the
share of renewable energy technologies (RETs) in the overall energy mix to up to 9700 MW by the
end of 2030. The country can achieve these targets and tackle energy crises if it utilizes solar energy
resources in a proper and efficient way. Pakistan is located in sun belt [22]. An enormous solar
potential exists in the country. Sindh, Baluchistan and some southern parts of Punjab have abundant
solar energy potential. These areas receive 2 MWh/m2 solar irradiation and 3000 h of sunshine per
year, which are perfect to invest in solar energy to utilize its true potential [45]. Baluchistan alone has
tremendous solar energy potential. The average global insolation is 19–20 MJ/m2 per day and the
annual mean sunshine duration is 8–8.5 h, which is perfect for the installation of solar PV and other
solar energy related projects. The average temperature of the country is Celsius 260 -280 . Meanwhile,
the daily average solar power potential is 5.3 kWh/m2 [46]. The country has an overall 1,600,000 MW
solar power potential [21]. If solar PV panels were installed only on a 100 Km area of Pakistan with
14% efficiency, it could generate 30 million tons of oil equivalent (MTOE) energy in the country [47].
     The distribution and transmission network of electricity in Pakistan is old and weak. Solar energy
can relieve this traditional electricity network and turn out to be an alternate to traditional electricity
in remote areas, where no grid electricity is available. Solar energy has already gained popularity all
over the world. Current work has been going on to improve the storage capacity of the cells used in
solar PV. It is also important at this point in time to make effective policies, followed by clear strategies
and models to realize solar potential in the country. In this regard, Public-private partnership can turn
out to be very fruitful. Different solar applications are being used in Pakistan, including solar thermal,
solar PV and desalination. Meanwhile, solar thermal energy production and solar water heaters also
have huge potential. Heavy reliance on fossil fuels for power generation can be minimized and the
electricity demand and supply gap can be fulfilled by utilizing solar energy appliances effectively at
home, public places and industries. Moreover, it will further guarantee sustainable development of
the country [16].
Sustainability 2019, 11, 1206                                                                         9 of 18

6. Research Methodology
      We employed a hybrid research methodology. First, we collected data of solar radiation intensity
and wind speed every month for a period of one year in four major cities of Pakistan, namely Karachi,
Lahore, Bahawalpur and Faisalabad. To ensure accurate locations for maximum solar radiation and
wind speed, the NASA solar map of Pakistan and wind map of Pakistan were utilized [48,49]. Data was
then calculated and plotted against the 1 kW solar PV and wind turbines by using MAT LAB and RT
screen to compare the efficiency of solar PV and wind turbines (Figures 8–11).
      We began our research from Karachi city. Located in Sindh province, the coastal city Karachi is
the biggest city of Pakistan. The city is famous for Bin Qasim and Karachi sea port. Due to numerous
industrial zones, the city is the economic hub and revenue engine of Pakistan. The share of this
city in total GDP of the country is 25%. Due to massive energy demand by domestic and industrial
users, the electricity shortfall has reached 412 MW. Figure 8 compares and analyzes the monthly
average electricity generation from wind turbines and solar PV in Karachi city for a period of one
year. Although, good wind speed is available for a period of 5 months in Karachi to generate enough
electricity, solar radiation is almost constant throughout the year, making it a better energy option than
wind energy.
      Lahore is the second biggest city of Pakistan after Karachi in terms of population. 90 million
inhabitants live in this ancient and beautiful city. Lahore electric supply company (LESCO) is the
largest electricity distribution company of this city. During the last few years, electricity demand and
the supply gap has increased tremendously, due to massive population and industrial activities in the
city. Consequently, LESCO is not coping with the ever-increasing demand for energy [8]. Figure 9
shows that solar energy is the best option for Lahore city, as simulation results indicate that the average
monthly electricity generation is higher for solar PV than for wind turbines.
      Faisalabad is famous for its textile industry and is called the Manchester of Pakistan. The textile
industry accounts for 58% of the total exports of Pakistan. The city’s alone contribution to total exports
of the country is 40%. So, Faisalabad is in crying need for energy. Long short-falls make the city
more miserable. In order to find the best renewable energy source, it was revealed that solar energy
gives better output in this city throughout the year, while wind energy is only appropriate in June
(Figure 10).
      Bahawalpur is the 11th largest city of Pakistan in terms of population with 798,509 inhabitants
living in this city. The city was the former capital of Bahawalpur state. Being an industrial city,
government has liberties and revolutionized key industries including poultry, cooking oil, textile,
steel and flour mills. But the city is facing the worst load shedding, hindering the smooth development
of industries. In terms of monthly average energy production, solar energy is the most appropriate in
this city as compared to wind energy (Figure 11). Due to this fact, the Quaid-e-Azam solar park has
been constructed in this city [50].
      Second, we conducted semi-structured interviews with industry professionals about the different
aspects of solar and wind energy to find out the best renewable energy option. These aspects are: price,
average life duration, consumption of fuel, operation and maintenance costs. To compare the price of
solar PV and wind turbine it was asked ‘What is the cost required to generate 1 kWh wind/solar electricity?’.
Similarly, we asked ‘What is the average life span of wind turbines and solar PV?’ to find the life span
of both technologies. Another question was included: ‘What is the average maintenance cost/hour for
wind power plants and solar PV?’ to find out the maintenance cost. A total of 42 industry professionals
were interviewed in these four cities. After considering all parameters of solar PV and wind turbines,
the interviewees’ responses revealed that solar energy is much cheaper than wind energy for power
generation in Pakistan. As, the cost required to generate 1 kWh energy is 65,000 Pakistani rupees (PKR)
in the case of solar energy, while this is PKR 120,000 in the case of wind energy. Similarly, the average
life span of solar PV is 25 years. While it is only 10-15 years for wind turbines. Solar PV do not have
any maintenance cost while it is PKR 3.5/h for wind energy plants (Table 6). Finally, interviewees were
asked about the barriers of solar energy development in Pakistan (see Appendix A). They revealed
Sustainability 2019, 11, 1206                                                                                         10 of 18

        Sustainability 2019, 11, x FOR PEER REVIEW                                                               10 of 19
  that solar energy is facing economical, technological, Information, human resource, social and policy
            Sustainability 2019, 11, x FOR PEER REVIEW                                          10 of 19
  barriers. These barriers have been described in Section 8.

284
285 284           Figure 8. Comparison of electricity generation between solar PV and wind turbine at Karachi.

      285              Comparison
             Figure 8.Figure        of electricity
                             8. Comparison         generation
                                           of electricity       between
                                                          generation     solar
                                                                     between   PVPV
                                                                             solar and wind
                                                                                     and windturbine
                                                                                               turbineat
                                                                                                       atKarachi.
                                                                                                         Karachi.

286     Sustainability 2019, 11, x FOR PEER REVIEW                                                               11 of 19
              Figure 9. Comparison of electricity generation between solar PV and wind turbine at Lahore.
287 286           Figure 9. Comparison of electricity generation between solar PV and wind turbine at Lahore.

      287               Figure 9. Comparison of electricity generation between solar PV and wind turbine at Lahore.

288
            Figure 10. Comparison of electricity generation between solar PV and wind turbine at Faisalabad.
289             Figure 10. Comparison of electricity generation between solar PV and wind turbine at Faisalabad.
288
289          Figure
      Sustainability   10. 11,
                     2019, Comparison
                               1206   of electricity generation between solar PV and wind turbine at Faisalabad. 11 of 18

290
            Figure 11. Comparison of electricity generation between solar PV and wind turbine at Bahawalpur.
291        Figure 11. Comparison of electricity generation between solar PV and wind turbine at Bahawalpur.

                             Table 6. Comparison between Solar and wind energy in Pakistan.
292                          Table 6. Comparison between Solar and wind energy in Pakistan.
                             Parameters             Solar Panel (1 kWh)         Wind Energy (1 kWh)
       Parameters                                   Solar panel (1 kWh)                 Wind energy (1 kWh)
       Price                    Price                       65,000
                                                           65,000                     120,000 120,000
                           Life duration                   25 Years                 10–15 Years
       Life duration                                      25 Years                           10–15 Years
                       Consumption of fuel                   N/A                       N/A
       Consumption of fuel
                        Maintenance costs                   N/A
                                                             N/A                     RS. 3.5/h N/A
       Maintenance costs Sulfur oxide                       N/A
                                                             N/A                       N/A RS. 3.5/h
       Sulfur oxide                                         N/A                                 N/A

      7. Grid Structure and Situation of Solar Energy in Pakistan
293   7. Grid Structure and Situation of Solar Energy in Pakistan
            Modern energy services are vital for the social and economic development of a country.
294        Modern energy services are vital for the social and economic development of a country.
      Conventional energy sources are unable to meet current energy needs of Pakistan, resulting in
295   Conventional energy sources are unable to meet current energy needs of Pakistan, resulting in large
      large populations deprived of electricity. Energy requirements have increased tremendously due
296   populations deprived of electricity. Energy requirements have increased tremendously due to
      to advancement in technologies which have put extra pressure on grids. The traditional grid structure
297   advancement in technologies which have put extra pressure on grids. The traditional grid structure
      of Pakistan is mainly built for conventional electricity which cannot bear the current power load and
      does not have the ability to integrate renewable energy sources. System loss, such as distribution
      and transmission losses, are much higher than other South Asian countries which further exacerbate
      the situation. Energy shortfall cannot be fulfilled by only constructing new lines and substations.
      Therefore, grid infrastructure needs a major transformation to fulfill the ever-increasing electricity
      demand. To achieve high amount of renewable energy generation, the current grid system should
      convert to a smart autonomic system. Moreover, the challenges of Transmission and Distribution
      losses can be minimized with the introduction of smart grids [51].
            Pakistan needs to deploy its intrinsic energy sources as a long-term solution to energy problems.
      Renewable energy sources especially solar energy has the ability to eliminate the existing energy
      crises of the country. Energy shortage problems can be reduced by efficiently utilizing this clean
      and affordable energy source [52]. Solar energy has a lot of opportunities particularly in rural areas
      and areas far off from national grid. Government has taken serious steps to utilize this natural asset
      properly in the country. AEDB has started a “solar power electricity program” to electrify rural
      areas. According to this program, solar systems will be installed in 100 villages of Sindh province
      and 400 villages of Baluchistan province. Villagers took great interest in this program and 3000 solar
      home solutions have been installed in Sindh province [53]. NEPRA declared a net metering policy and
      tariff regulations in 2015 to benefit consumers who use solar PV. A special meter has been provided to
      consumers which have the capability to record both in and out flow of electricity. According to this
Sustainability 2019, 11, 1206                                                                                             12 of 18

      policy, users will be charged for their net electricity consumption. Domestic and commercial users
      have been inspired to install their own solar systems after the implementation of this policy. It is
      expected that this policy will improve the energy crises in the country [54].

      8. Solar Energy Applications in Pakistan

      8.1. Solar PV
             In the past, the use of solar PV was only limited to individual purposes and there was no
      utilization of solar energy in the grid. With a growing electricity demand gap and continuous power
      shutdowns, government has made quick action plans to connect solar energy with the national grid.
      In 2010, the first solar grid plant was installed at the Planning Commission and Pakistan Engineering
      Council (PEC) building. The plant has total installed capacity of 178.08 kW which not only fulfills its
      own needs but can also sell surplus electricity to the Islamabad Electric Supply Company (IESCO).
      Similarly, the Pakistan national assembly installed a 2 MW solar system on its building and became
      the world’s first parliament which is completely functional on solar energy. The extra electricity of this
      plant is also transferred to the national grid plant [55].
             With the technical assistance of the Japan International Cooperation Agency (JICA), the country
      built another solar energy project, with a total generating capacity of 365 kW. Investors have taken
      great interest in solar energy projects after the success of the above-mentioned projects. Meanwhile,
      AEDB has given a Letter of Intent (LoI) to 28 companies, having total capacity of 956.52 MW.
      Quaid-e-Azam Solar Park is a mega project which has been constructed at Bahawalpur city with
      the assistance of China. It became functional in 2016 with a total capacity of 100 MW. Another three
      projects at the same site will become functional at the end of 2018, having a total capacity of 300
      MW [46]. AEDB has given LoI to a further 17 independent power producers (IPPs) with a cumulative
      capacity of 484 MW. With the completion of all these projects, the installed capacity of PV available
      to the grid will have reached 1556 MW in 2018. The year wise grid connected solar power capacity
      in Pakistan2019,
      Sustainability has11,
                         been   shown
                            x FOR      in Figure 12. Still, many solar energy projects are under construction
                                  PEER REVIEW                                                                 at
                                                                                                        13 of 19
      different locations in Pakistan as shown in Table 7 [43].

                                                 1800

                                                 1600
                                                                                                                      1556
                      Cumulative capacity (MW)

                                                 1400

                                                 1200

                                                 1000

                                                 800                                                730

                                                 600
                                                                                 400
                                                 400

                                                 200          100
                                                    0
                                                              2015              2016               2017               2018
343
                                                   Figure 12. Year wise grid connected solar power capacity in Pakistan [43].
344                                               Figure 12. Year wise grid connected solar power capacity in Pakistan [43].
      8.2. Solar Thermal
345   8.2. Solar
            SolarThermal
                   thermal technology is still not fully explored in Pakistan. Solar cookers, solar water heaters
346   and solar   water
            Solar thermal pumps  are potential
                            technology           applications
                                        is still not          on theinsolar
                                                     fully explored         thermal
                                                                       Pakistan.     side.
                                                                                  Solar    AEDB solar
                                                                                        cookers,   liftedwater
                                                                                                           a tax duty on
                                                                                                                 heaters
347   importing
      and           different
           solar water        solar
                          pumps     products,
                                  are potentialtoapplications
                                                   develop solaronpower   in the
                                                                   the solar     country.
                                                                              thermal  side.AsAEDB
                                                                                               a result,  imports
                                                                                                      lifted        were
                                                                                                              a tax duty
348   on importing different solar products, to develop solar power in the country. As a result, imports
349   were increased steadily. In 2013, the government imported 14,981 solar water heaters and installed
350   them throughout the country. Similarly, the government further imported and deployed 1429 solar
351   water pumps to benefit the agriculture sector [56]. Solar pumps and solar water heaters were
352   manufactured locally after 2013 and gained popularity all over the country, especially in northern
Sustainability 2019, 11, 1206                                                                         13 of 18

increased steadily. In 2013, the government imported 14,981 solar water heaters and installed them
throughout the country. Similarly, the government further imported and deployed 1429 solar water
pumps to benefit the agriculture sector [56]. Solar pumps and solar water heaters were manufactured
locally after 2013 and gained popularity all over the country, especially in northern areas. The winter
is so cold in these mountainous areas and electricity supply is limited. Many non-government
organizations (NGOs) took interest in solar cookers and distributed in northern and rural areas of
Pakistan. Currently, 5000 solar cookers are in use in Pakistan.

                                Table 7. Under construction solar PV projects in Pakistan.

                 Sr. No           Developer           Project Capacity (MW)            Location
                   1            Asia Petroleum                  30                 Chakwal, Punjab
                   2            First Solar Ltd.                 2                  Sindh Province
                   3             Act Solar Ltd.                 50                Noori Abad, Sindh
                   4            Jafri Associates                50                Noori Abad, Sindh
                   5            Solar Blue Ltd.                 50                 Punjab Province
                   6            Adamjee Power                   10                   Thatta, Sindh
                   7             ET Solar Ltd.                  25                  Attock, Punjab
                   8             ET Solar Ltd.                  50                  Sialkot, Punjab
                   9            Crystal Energy                   2                   Thatta, Sindh
                   10               Forshine                    50                   Thatta, Sindh

9. Barriers to Solar Energy Development
     Although, there is a huge potential for solar energy in Pakistan, there are certain barriers which
must be overcome to utilize this technology efficiently and effectively. One of the important barriers is
the high initial cost, as solar energy projects require a long time to materialize their monetary benefits.
More specifically, these barriers are summarized as follows.

9.1. Economical Barriers
     Solar energy projects are capital intensive and have low economies of scale. It requires a long time
for payback.

(1)    Unawareness about market potential.
(2)    Initial costs are too high to start a new solar energy project.
(3)    Limited government subsidies, banks are not willing to give loans for big projects.
(4)    There are always risks associated with solar energy projects regarding their performance.

9.2. Policy Barriers
(1)    Confusing policies regarding the participation of private investors.
(2)    Feeble environmental structure.
(3)    No feed-in tariff system.
(4)    High priority to traditional sources of energy and lack of structural regulations for
       renewable energy.
(5)    More subsidies are available for fossil fuels as compared to solar energy and other
       renewable technologies.

9.3. Technological Barriers
(1)    Unreliable local technology.
(2)    Local production is limited and there is no production facility of solar cells at national level.
(3)    Dependence on foreign technology for key parts and equipment.
(4)    Unauthentic solar maps to check the solar radiation intensity.
Sustainability 2019, 11, 1206                                                                      14 of 18

(5)    Dependence on foreign personnel to install and operate large solar energy projects.

9.4. Information and Human Resource Barriers
(1)    Limited information about energy efficiency to make effective policies for mobilizing society.
(2)    Limited marketing and business management skills.
(3)    Limited knowledge about modern solar technology, specialized equipment, suppliers and
       potential financers.
(4)    Lack of experts and limited human resource potential for the operation and maintenance of large
       solar energy projects.
(5)    Limitation on collecting solar energy data and the inefficiency of project development.

9.5. Social Barriers
(1)   Lack of awareness about solar energy especially in rural areas.
(2)   Lack of social acceptance and participation. People still stick to traditional means of electricity
      which is a big hurdle for new solar energy projects.
(3)   Some solar energy projects often come with strong opposition from local communities like the
      installation of solar water heaters on high roofs.
(4)   If some problem suddenly occurs, residents do not have any practical knowledge about how to
      fix it on their own.

10. Policy Recommendations
    The following policy recommendations are advised for Pakistani government to overcome above
mentioned solar energy barriers.

(1)    There is a need to educate the masses about the harms and disadvantages associated with
       traditional sources of energy and make them aware about the benefits related with the utilization
       of solar energy. This can be achieved by launching environmental awareness campaigns to
       highlight the importance of energy conservation and reducing greenhouse gas emissions.
(2)    All stakeholders, government and NGOs should work in an integrated and coherent way to
       further increase the demand of solar energy in the country.
(3)    To utilize solar energy properly at the domestic level, it is necessary that householders should be
       given subsidies and loans to purchase solar energy solutions according to their needs.
(4)    Huge costs are required for the distribution and transmission networks for areas, far away
       from the national grid. Therefore, there is a need to develop microfinance institutions for these
       areas. i.e., northern mountainous areas in Gilgit Baltistan and Khyber Pakhtunkhwa, and rural
       areas in Sindh and Baluchistan. This task can be assigned to banks to ensure the availability of
       microfinance which can substantially contribute to the development of off-grid solutions.
(5)    Rural dwellers and people related with agricultural professions, should be encouraged to buy
       solar water pumps and solar tube wells by demonstration projects at the community level. For this
       purpose, adequate funds should be provided for quick results.
(6)    As solar energy projects are capital intensive. Only the public sector cannot cope with such huge
       investments. Renewable policies should be made in such a way that it should motivate both
       local and foreign investors to invest in solar energy projects. Incentives such as exemptions from
       import duties and tax reductions will be great initiatives in this regard.
(7)    Policy structure should be reformed by giving more priority to renewable energy sources instead
       of conventional energy.
(8)    Management and marketing skills should be increased to explore new markets, suppliers and
       modern solar technology.
(9)    There is a need to cultivate local professionals from countries expert in solar energy technology.
Sustainability 2019, 11, 1206                                                                          15 of 18

(10) There is a need to lessen the burden on fossil fuels by increasing the share of solar energy in total
     energy mix of the country. This can be achieved by adopting Feed-in Tariffs (FIT) and Renewable
     Portfolio Standards (RPS). These incentives will motivate power producers to invest more in
     solar energy projects.
(11) Local developers should be given monetary benefits, as the startup cost of new solar energy
     projects is very high.
(12) The government should develop a national energy research program. Ample funding should
     be provided for R&D to prepare home based, energy efficient solar energy equipment. Research
     activities should be carried out by university students and research organizations to develop
     modern and cost-effective solar energy devices for residents and commercial users.
(13) Regional and international cooperation should be enhanced to transfer technology, knowledge
     management mechanisms, train local manpower, improve the manufacturing of key parts and to
     learn from each other’s experiences.

11. Conclusions
     Energy is vital for the socioeconomic progress of a country. Pakistan, like many other under
developed countries solely relies1 on traditional fossil fuels to meet its energy requirements. Due to its
massive population and recent industrial development, there is a huge demand for energy. Meanwhile,
fossil fuel prices have increased recently, and the country has no other means to produce energy,
resulting in energy short-falls. The electricity demand and supply gap has been increased tremendously.
Due to the increasing energy gap, all sectors of life have been affected severely. Policy makers all
over the world are looking for alternate ways of energy to solve energy scarcity problems. Different
sources of alternate and renewable energy are being explored in Pakistan as well. We have compared
different renewable energy sources i.e., solar and wind, based on price, average life span, emission of
hazardous gases, consumption of fuel, operation and maintenance costs. We found that solar energy
has emerged as a best source of renewable energy to tackle all the energy challenges as it is cheaper,
does not require operation or maintenance costs and have a greater average life span than wind energy.
Moreover, good wind speed is only available for 5 to 6 months of the year, while solar radiation is
present all through the year in the country. Solar energy can lessen the pressure on the national budget
which is being used for importing expensive fossil fuels, especially oil. The use of solar energy is
only limited to solar PV, solar water heaters, solar geysers, solar cookers and solar pumps in Pakistan.
Though, with the construction of the Quaid-e-Azam solar park and similar projects, the awareness of
solar energy and its associated benefits have been increased among people. But until now, it’s share in
the total energy mix of the country is negligible. Pakistan’s topography and climatic conditions are
ideal for the utilization of solar energy at its maximum level. Finally, we have provided some policy
implications to address the barriers in the way of solar energy, make people aware about the current
energy problems of the country, by supporting and promoting solar energy practices and attract local
and foreign investors to invest in solar power projects. To conclude, solar energy has the potential to
solve Pakistan’s energy crises in a short time period.

Author Contributions: Conceptualization, M.I.; Data curation, M.I. and M.A.; Formal analysis, M.I. and Z.-Y.Z.;
Funding acquisition, Z.-Y.Z.; Writing—original draft, M.I.; Writing—review & editing, M.A. and M.C.M..
Funding: This study was supported by “The Fundamental Research Funds for the Central Universities
(2018ZD14).”
Conflicts of Interest: The authors declare no potential conflicts of interest.
You can also read