Solar photovoltaic electricity empowering the world 2011 - pvtrin
←
→
Page content transcription
If your browser does not render page correctly, please read the page content below
Solar photovoltaic electricity empowering the world 2011
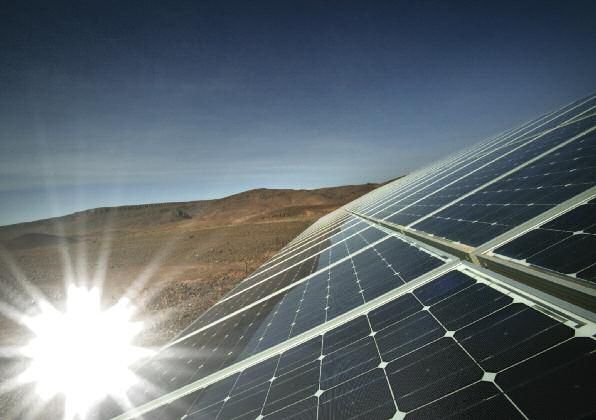
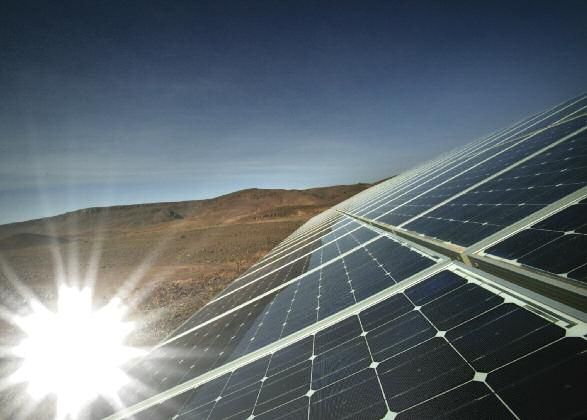
Solar generation 6
Solar photovoltaic electricity
empowering the world
2011

 foreword
 The European Photovoltaic This report aims to provide a clear
 Industry Association and and understandable description of
 Greenpeace International are the current status of developing
 pleased to present this 6th edition Photovoltaic power generation
 of the report “Solar Generation: worldwide, and also of its
 Solar Photovoltaic Electricity untapped potentials and growth
 Empowering the World”. prospects in the coming years.

 During 2010, the Photovoltaic (PV) The most impressive result is however The strong growth in PV installations
 market has shown unprecedented the number of installations and is currently driven in particular by
 growth and wide-spread use of this therefore of individuals, companies, European countries, accounting for
 environmentally friendly and and public entities participating in this some 70% of the global market, and
 distributed source of power development: nearly 2 million single accompanied by the promising key
 generation. On a global basis, new PV installations produce photovoltaic markets of North America, Japan,
 PV installations of approximately power already today. China and Australia. At the same
 15,000 MW have been added time, the PV arena has importantly
 The cumulative electrical energy
 during 2010, taking the entire PV widened its number of participating
 produced from global PV installations
 capacity to almost 40,000 MW. This countries and also increased their
 in 2010 equals more than half of the
 result is even above the optimistic specific weight. Major new areas for
 electricity demand in Greece, or the
 forecast contained in the report, and development lie also in the Sunbelt
 entire electricity demand in ten
 it also translates into investments of region, with Africa, Middle East and
 central African countries.*
 over 50 bn€ in 2010, again ahead South America just starting to
 of the report’s forecast. create new growth opportunities,
 * Angola, Benin, Botswana, Cameroon, almost always dedicated to covering
 Congo, Cote d’Ivoire, Eritrea, Ethiopia,
 Gabon and Ghana.
 local demand.
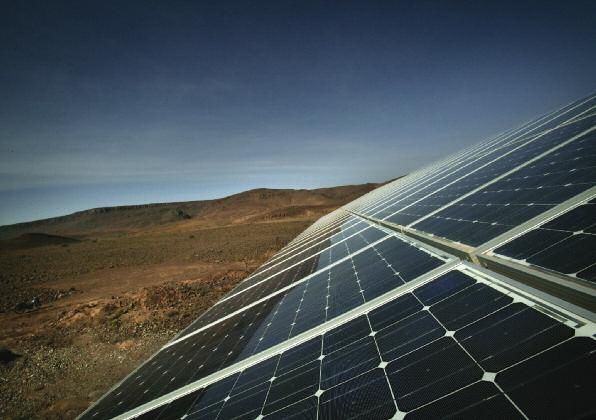
foreword

 epia
 Ingmar Wilhelm
 President European Photovoltaic
 Industry Association (EPIA)

 greenpeace
 Sven Teske
 Renewables Director
 Greenpeace International

 Installing thin film modules.

The major competitive advantages of comparable industries such as emissions reduction, are also
PV technology lie in its versatility, i.e. semiconductors and TV screens. worked out. With PV becoming a
the wide range of sizes and sites, Adding the important feature of cost competitive solution for
resulting into proximity to electricity integrated PV solutions in particular producing power, it will open up an
demand, in the value of its production in building architecture, the potential increasing variety of new markets
profile concentrated during peak-load of further growth is simply enormous. and contribute more and more
hours, and in its enormous potential significantly to cover our future
 This edition of the Solar Generation
for further cost reduction. energy needs.
 report combines different growth
PV technology has reduced its unit scenarios for global PV development PV technology has all the potential to
costs to roughly one third of where it and electricity demand until 2050. It satisfy a double digit percentage of
stood 5 years ago, thanks to is built on the results of several the electricity supply needs in all
continuous technological progress, reference market studies in order to major regions of the world. Going
production efficiency and to its wide accurately forecast PV growth in the forward, a share of over 20% of the
implementation. The trend of coming decades. In addition, the world electricity demand in 2050
decreasing unit cost will continue economic and social benefits of PV, appears feasible, and opens a bright,
also in the future, just like in such as employment and CO2 clean and sunny future to all of us.

 3
contentS

 foreword 2 2.3. The PV value chain 27
 a. Consolidation trends
 executive Summary 6
 in the solar industry 27
 Status of solar power now 6
 Imagining a future with a fair share of sun 6 3 Solar coSt
 What are the benefits? 7 and competitiveneSS:
 How can we get there? 7 towardS grid parity 29
 Learning from the pioneers 8 3.1. Price competitiveness of PV 30
 Reference for the future 8 a. PV module price 30
 b. PV system price 31
 1 Solar baSicS 9
 c. PV Electricity generation cost 32
 1.1. What does photovoltaic mean? 10
 d. Electricity price evolution 33
 1.2. Benefits of PV technology 10
 e. Market segments for PV 35
 a. Environmental footprint of PV 10
 3.2. Factors affecting PV system
 b. Improving grid efficiency 10
 cost reduction 37
 c. Making cities greener 11
 a. Technological innovation 37
 d. No limits 11
 b. Production optimisation 38
 1.3. Types of PV systems 11
 c. Economies of scale 38
 a. Grid connected systems 12
 d. Increasing the performance
 b. Stand-alone, off-grid
 ratio of PV systems 38
 and hybrid systems 13
 e. Extending the life of PV systems 39
 1.4. The Solar potential 14
 f. Development of standards
 1.5. Example: How PV can meet
 and specifications 40
 residential consumption 15
 g. Next generation technologies 40
 2 Solar technology 3.3. PV in electricity networks
 and induStry 17 and energy markets 41
 2.1. PV systems 17 a. High penetration of PV
 a. PV cells and modules 17 in the grids 41
 b. Inverters 18 b. From centralised to decentralised
 c. Batteries and charge controllers 18 energy generation 43
 2.2. Photovoltaic technologies 20
 a. Crystalline silicon technology 20
 b. Thin Films 22
 c. Concentrator photovoltaics 24
 d. Third generation photovoltaics 25
 e. Historical and future evolution 26

4
contentS

4 Solar policieS 45 a. Global scenario 72
 4.1. Policy drivers for the development b. Regional development 74
 of solar PV 46 c. Employment and investment 77
 a. Feed-in Tariffs: Key driver d. CO2 reduction 78
 of solar success 46
 6 Solar benefitS
 b. Other drivers of a successful PV
 and SuStainability 79
 market development 50
 6.1. Economic benefits 80
 4.2. Policies in the top ten markets 53
 6.2. Environmental factors 82
 4.3. Developing a world-wide PV
 a. Climate change mitigation 82
 policy outlook 57
 b. Energy payback time (EPBT) 84
 a. The European Union:
 c. Water consumption 85
 A driver of PV development
 d. Recycling 85
 in Europe and the world 57
 6.3. Social aspects 86
 b. The desert is a perfect place
 a. Employment 86
 to develop PV energy 58
 b. Skilled labour and education 86
 c. PV in the Sunbelt region:
 6.4. Rural electrification 87
 Ongoing policy developments 59
 d. Smart cities 59 liSt of acronymS 91

5 Solar power market 62 referenceS 93
 5.1. History of PV markets 63
 liSt of figureS & tableS 94
 a. Europe at the forefront
 of PV development 63 image creditS 96
 b. Japan and USA lead
 outside Europe 63
 c. Distribution of the world PV
 market in 2009 64
 d. Root causes of PV
 market development 64
 e. Future PV markets:
 The Sunbelt region 65
 f. A bright future for PV 65
 5.2. The Greenpeace/EPIA
 Solar Generation Scenarios 68
 a. Methodology and assumptions 68
 b. Scenario assumptions 69
 5.3. Key results 72

 5
executive Summary

 Status of solar power today • The energy pay time back the electricity it took
 to create them in one to three years. The most
 At the end of 2009 the world was running 23 GW
 cutting-edge technologies have reduced this to
 of photovoltaic (PV) electricity, the equivalent of 15
 six months depending on the geographies and
 coal-fired power plants. At the end of 2010, this
 solar irradiation, while the average life of
 number should reach more than 35 GW. We have
 modules is more than 25 years.
 known for decades that just a portion of the energy
 hitting the Earth’s surface from the Sun every day
 could power all our cities several times over. Imagining a future with a fair share of Sun

“Solar can Solar can and must be a part of the solution to The European Photovoltaic Industry Association
and must combat climate change, helping us shift towards (EPIA) and Greenpeace commissioned updated
be a part a green economy. It is also a potentially modelling into how much solar power the world
of the prosperous industry sector in its own right. Some could reasonably see in the world by 2030. The
solution industry indicators show just how far photovoltaic model shows that with a Paradigm Shift scenario
to climate energy has already come. towards solar power, where real technical and
change, commercial capacity is backed-up by strong
 • The cost to produce solar power has dropped
helping political will, photovoltaics could provide:
 by around 22% each time world-wide
us shift
 production capacity has doubled reaching an • 688 GW by 2020 and 1,845 GW by 2030.
away from
 average generation cost of 15c€/KWh in EU.
fossil fuel • Up to 12% of electricity demand in European
dependence.” • Average efficiencies of solar modules have countries by 2020 and in many Sunbelt
 improved a couple percentage points per year. countries (including China and India) by 2030.
 The most efficient crystalline silicon modules, Around 9% of the world’s electricity needs
 go to 19.5% in 2010 with a target of 23% in 2030.
 efficiency by 2020, which will lower prices
 Under an Accelerated scenario, which follows the
 further. That increase in efficiencies is seen in
 expansion pattern of the industry to date and
 all PV technologies.
 includes moderate political support, photovoltaics
 • Solar power booms in countries where the could provide:
 boundary conditions are right.
 • 345 GW by 2020 and 1,081 GW by 2030
 • Over 1,000 companies are involved in the
 • Around 4% of the world’s electricity needs
 manufacturing of the established crystalline
 in 2020.
 silicon technology and already more than 30
 produce Thin Film technologies.

6

executive
 Summary

What are the benefits? Assessing PV investment profitability on a
 regular basis and adapting FiT levels
The benefits of a Paradigm Shift towards solar
 accordingly. A fair level of FiT can help the market
electricity as described in this model include:
 take-off and avoid over heated markets.
• Provide clean and sustainable electricity
 Assessing profitability through IRR
 to the world.
 calculations. All aspects of a support scheme
• Regional development, by creation of local including FiT, tax rebates and investment subsidies
 jobs. New employment levels in the sector – as must be considered when calculating the internal
 many as 1.62 million jobs as early as 2015, rate of return (IRR) of a PV investment.
 rising to 3.62 million in 2020 and 4.64 million
 Controlling the market with the upgraded
 in 2030.
 “corridor” concept. The corridor is a market
• Clean electricity that contributes to international control mechanism that allows to adjust FiT levels
 targets to cut emissions and mitigate to accelerate or slow the PV market in a country.
 climate change. The FiT level can be increased or decreased
 regularly in relation to how much PV is in the
• Avoiding up to 4,047 million tonnes of CO2
 market against predefined thresholds at regular
 equivalent every year by 2050. The cumulative
 intervals (for example, annually).
 total of avoided CO2 emissions from 2020 to
 2050 would be 65 billion tonnes. Refining FiT policies for additional benefits.
 The way a scheme is designed can encourage
 specific aspects of PV power. For example,
How can we get there?
 systems that are integrated into buildings and
A Paradigm Shift for solar is possible. While the PV substitute building components.
sector is committed to improve efficiency of
 Drawing a national roadmap to grid parity.
products and reduce costs, these aspects are not
 Financial incentives can be progressively phased-out
the major issues either. In fact, solar power is due to
 as installed PV system costs are decreased and
reach grid parity in a number of countries, some as
 conventional electricity prices are increasing.
early as 2015. Lessons from real examples show
there are some key approaches to getting it right in
solar power support schemes. These include:
Using Feed-in Tariffs (FiT) that guarantee
investment for 15 to 20 years. FiT schemes
have been proven to be the most efficient support
mechanisms with a long, proven ability to develop
the market world-wide.

 7

Learning from the pioneers Reference for the future
 Some nations have taken a lead with support This publication is the sixth edition of the reference
 schemes that encourage market creation and global solar scenarios that have been established
 industry growth. by the European Photovoltaic Industry Association
 and Greenpeace jointly for almost ten years. They
 Germany: The first country to introduce a FiT, has
 provide well documented scenarios establishing
 shown the rest of the world how countries can
 the PV deployment potential World-wide by 2050.
 achieve environmental and industrial development
 at the same time. The first edition of Solar Generation was published
 in 2001. Since then, each year, the actual global
 Japan: More than 2.6 GW of solar power were
 PV market has grown faster that the industry and
 installed in 2009, almost 99% of which were grid-
“The solar PV Greenpeace had predicted (see table 1).
 connected thanks to incentives administered by
market has the Ministry of Economy, Trade and Industry.
outpaced
‘Solar Italy: Uses a FiT with higher rates for building
Generation’ integrated systems (guaranteed for 20 years)
predictions accompanied with net metering to encourage
by nine solar power.
years.” USA: Allows a tax credit of 30% for commercial
 and residential PV systems that can be used by
 utilities. Several States offer very attractive
 schemes and incentives.
 China: The world’s largest PV manufacturer with
 unlocked its PV market potential. The country is
 discussing FiT to meet a goal of 20 GW of solar
 power installed by 2020, 5 GW of this by
 2015 which is of course negligible considering its
 huge potential.

 TABLE 1
 ANNUAL PV INSTALLED CAPACITY
 MW

 Year 2001 2002 2003 2004 2005 2006 2007 2008 2009 2010

 Market Result MW 334 439 594 1,052 1,320 1,467 2,392 6,090 7,203

 SG I 2001 331 408 518 659 838 1,060 1,340 1,700 2,150 2,810

 SG II 2004 985 1,283 1,675 2,190 2,877 3,634

 SG III 2006 1,883 2,540 3,420 4,630 5,550

 SG IV 2007 2,179 3,129 4,339 5,650

 SG V 2008 4,175 5,160 6,950

 SG VI 2011 13,625

8

Solar baSicS 1

 9

FIGURE 2
 1 Solar baSicS EXAMPLE OF THE
 PHOTOVOLTAIC EFFECT
 1.1. What does photovoltaic mean?
 Photovoltaic systems contain cells that convert
 sunlight into electricity. Inside each cell there are
 layers of a semi-conducting material. Light falling
 on the cell creates an electric field across the
 layers, causing electricity to flow. The intensity of
 the light determines the amount of electrical power
 each cell generates.

“PV FIGURE 1
technology THE MEANING OF THE
 WORD “PHOTOVOLTAIC”
exploits a

 LOAD
 CURRENT
virtually
limitless JUNCTION
source of PHOTON = LIGHT VOLT = UNIT OF
 ELECTRIC
free power POTENTIAL
from the
 PHOTONS ELECTRON FLOW
sun.”
 – – N-TYPE SILICON
 source: EPIA.
 + + P-TYPE SILICON

 ‘HOLE’ FLOW

 source: EPIA.

 A photovoltaic system does not need bright sunlight a. Environmental footprint of PV
 in order to operate. It can also generate electricity
 The energy it takes to make a solar power system
 on cloudy and rainy days from reflected sunlight.
 is usually recouped by the energy costs saved
 over one to three years. Some new generation
 1.2. Benefits of PV technology technologies can even recover the cost of the
 energy used to produce them within six months,
 PV technology exploits the most abundant source
 depending on their location. PV systems have a
 of free power from the Sun and has the potential
 typical life of at least 25 years, ensuring that each
 to meet almost all of mankind’s energy needs.
 panel generates many times more energy than it
 Unlike other sources of energy, PV has a negligible
 costs to produce.
 environmental footprint, can be deployed almost
 anywhere and utilises existing technologies and
 manufacturing processes, making it cheap and b. Improving grid efficiency
 efficient to implement.
 PV systems can be placed at the centre of an
 energy generation network or used in a
 decentralised way. Small PV generators can be
 spread throughout the network, connecting directly
 into the grid. In areas that are too remote or
 expensive to connect to the grid, PV systems can
 be connected to batteries.

10
1
 Solar baSicS

c. Making cities greener dioxide is emitted during the burning of oil, coal and
 gas to generate electricity. The European Photovoltaic
With a total ground floor area over 22,000 km2,
 Industry Association has been actively working for the
40% of all building roofs and 15% of all facades in
 past 25 years to promote a self-sustaining PV industry.
EU 27 are suited for PV applications. This means
that over 1,500 GWp of PV could technically be
installed in Europe which would generate annually 1.3. Types of PV systems
about 1,400TWh, representing 40% of the total
 PV systems can provide clean power for small
electricity demand by 2020. PV can seamlessly
 or large applications. They are already installed
integrate into the densest urban environments. City
 and generating energy around the world on
buildings running lights, air-conditioning and
 individual homes, housing developments, offices
equipment are responsible for large amounts of
 and public buildings. “There are no
greenhouse gas emissions, if the power supply is
not renewable. Solar power will have to become Today, fully functioning solar PV installations operate substantial
an integral and fundamental part of tomorrow’s in both built environments and remote areas where limits to the
positive energy buildings. it is difficult to connect to the grid or where there is deployment
 no energy infrastructure. PV installations that of PV.”
 operate in isolated locations are known as stand-
d. No limits
 alone systems. In built areas, PV systems can be
There are no substantial limits to the massive mounted on top of roofs (known as Building
deployment of PV. Material and industrial capability Adapted PV systems – or BAPV) or can be
are plentiful and the industry has demonstrated an integrated into the roof or building facade (known
ability to increase production very quickly to meet as Building Integrated PV systems – or BIPV).
growing demands. This has been demonstrated in
 Modern PV systems are not restricted to square
countries such as Germany and Japan which have
 and flat panel arrays. They can be curved, flexible
implemented proactive PV policies.
 and shaped to the building’s design. Innovative
Greenpeace has supported solar power as a clean architects and engineers are constantly finding
way to produce power for 20 years. This is mainly new ways to integrate PV into their designs,
because it avoids the harmful impact on the creating buildings that are dynamic, beautiful and
environment caused by carbon dioxide. Carbon provide free, clean energy throughout their life.

 Why solar ticks all the boxes:
 ☑ Free energy direct from the Sun
 ☑ No noise, harmful emissions or gases are produced
 ☑ Safety and reliability are proven
 ☑ Each module lasts around at least 25 years
 ☑ Systems can be recycled at the end of their life and the materials re-used
 ☑ PV is easy to install and has very low maintenance requirements
 ☑ Power can be generated in remote areas that are not connected to the grid
 ☑ Solar panels can be incorporated into the architecture of a building
 ☑ The energy used to create a PV system can be recouped quickly (between six months
 and three years) and that timeframe is constantly decreasing as technology improves
 ☑ Solar power can create thousands of jobs
 ☑ Solar contribute to the security of energy supply in every country.

 11
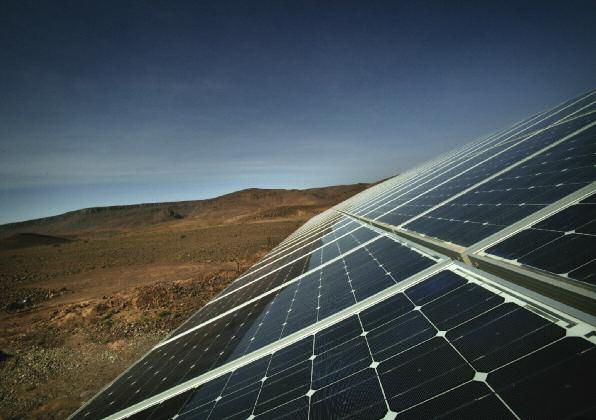
a. Grid connected systems Industrial and utility-scale power plants
 When a PV system is connected to the local Large industrial PV systems can produce
 electricity network, any excess power that is enormous quantities of electricity at a single point
 generated can be fed back into the electricity grid. respectful of the environment. These types of
 Under a FiT regime, the owner of the PV system is electricity generation plants can produce from
 paid according the law for the power generated by many hundreds of kilowatts (kW) to several
 the local electricity provider. This type of PV system megawatts (MW).
 is referred to as being ‘on-grid’.
 The solar panels for industrial systems are usually
 mounted on frames on the ground. However, they
 Residential and commercial systems can also be installed on large industrial buildings
 such as warehouses, airport terminals or railway
 Most solar PV systems are installed on homes and
 stations. The system can make double-use of an
 businesses in developed areas. By connecting to
 urban space and put electricity into the grid where
 the local electricity network, owners can sell their
 energy-intensive consumers are located.
 excess power, feeding clean energy back into the
 grid. When solar energy is not available, electricity
 can be drawn from the grid.
 Solar systems generate direct current (DC) while
 most household appliances utilise alternating
 current (AC). An inverter is installed in the system
 to convert DC to AC.

 grid-connected BIPV system Large ground-mounted
 on the roof and façade of a system in Germany.
 commercial building.

 TABLE 2
 TYPICAL TYPE AND SIZE OF APPLICATIONS PER MARKET SEGMENT

 Type of application Market segment

 Residential Commercial Industrial Utility scale
 < 10 kWp* 10kWp - 100kWp 100kWp - 1MWp >1MWp

 Ground-mounted ✓ ✓

 Roof-top ✓ ✓ ✓

 Integrated to facade/roof ✓ ✓
 * Wp : Watt-peak, a measure of the nominal power of a
 photovoltaic solar energy device.

12
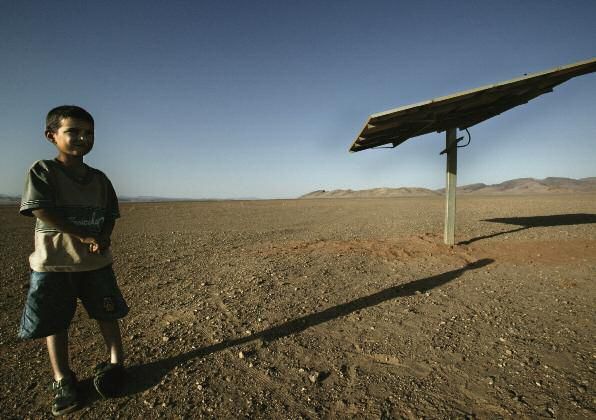
1
 Solar baSicS

b. Stand-alone, off-grid and hybrid systems Off-grid systems for rural electrification
Off-grid PV systems have no connection to an Typical off-grid installations bring electricity to
electricity grid. An off-grid system is usually remote areas or developing countries. They can be
equipped with batteries, so power can still be used small home systems which cover a household’s
at night or after several days of low Irradiation. An basic electricity needs, or larger solar mini-grids
inverter is needed to convert the DC power which provide enough power for several homes, a
generated into AC power for use in appliances. community or small business use.
Most standalone PV systems fall into one of three
main groups:
• Off-grid industrial applications
 “Off-grid
• Off-grid systems for the electrification systems
 of rural areas provide a
• Consumer goods. cost-effective
 way to bring
 power to
Off-grid industrial applications remote
Off-grid industrial systems are used in remote areas.”
areas to power repeater stations for mobile Rural electrification
telephones (enabling communications), traffic system in an
 African village.
signals, marine navigational aids, remote lighting,
highway signs and water treatment plants among
others. Both full PV and hybrid systems are used.
Hybrid systems are powered by the Sun when it is Consumer goods
available and by other fuel sources during the night
 PV cells are now found in many everyday electrical
and extended cloudy periods.
 appliances such as watches, calculators, toys,
Off-grid industrial systems provide a cost-effective and battery chargers (as for instance embedded
way to bring power to areas that are very remote in clothes and bags). Services such as water
from existing grids. The high cost of installing cabling sprinklers, road signs, lighting and telephone
makes off-grid solar power an economical choice. boxes also often rely on individual PV systems.

Off-grid industrial Public lights in Berlin.
application.

 13
1.4. The Solar potential FIGURE 3
 SOLAR IRRADIATION
 There is more than enough solar irradiation VERSUS ESTABLISHED
 available to satisfy the world’s energy demands. GLOBAL ENERGY
 On average, each square metre of land on Earth RESOURCES
 is exposed to enough sunlight to generate 1,700
 kWh of energy every year using currently available
 ANNUAL SOLAR
 technology. The total solar energy that reaches the IRRADIATION
 TO THE EARTH
 Earth’s surface could meet existing global energy
 needs 10,000 times over.
 A large amount of statistical data on solar energy
“The total availability is collected globally. For example, the
solar energy US National Solar Radiation database has 30
that reaches years of solar irradiation and meteorological data
the Earth’s from 237 sites in the USA. The European Joint
surface could Research Centre (JRC) also collects and publishes
meet existing European solar irradiation data from 566 sites1. GLOBAL ANNUAL
 ENERGY CONSUMPTION
global energy Where there is more Sun, more power can be
needs 10,000 generated. The sub-tropical areas of the world
times over.” offer some of the best locations for solar power SOLAR (CONTINENTS) COAL
 WIND GAS
 generation. The average energy received in Europe
 BIOMASS OIL
 is about 1,200 kWh/m2 per year. This compares
 GEOTHERMAL NUCLEAR
 with 1,800 to 2,300 kWh/m2 per year in the OCEAN & WAVE PRIMARY ENERGY
 Middle East. HYDRO
 CONSUMPTION

 While only a certain part of solar irradiation can be FOSSIL FUELS ARE EXPRESSED WITH REGARD
 TO THEIR TOTAL RESERVES WHILE RENEWABLE ENERGIES
 used to generate electricity, this ‘efficiency loss’ TO THEIR YEARLY POTENTIAL.
 does not actually waste a finite resource, as it does source: DLR, IEA WEO, EPIA’s own calculations.
 when burning fossil fuels for power. Efficiency losses
 do, however, impact on the cost of the PV systems.
 This is explained further in Part 3 of this report. FIGURE 4
 SOLAR IRRADIATION
 EPIA has calculated that Europe’s entire electricity AROUND THE WORLD
 consumption could be met if just 0.34% of the
 European land mass was covered with 2500
 photovoltaic modules (an area equivalent to the
 Netherlands). International Energy Agency (IEA)
 50
 calculations show that if 4% of the world’s very dry 2000
 desert areas were used for PV installations, the
 [kWh / (m2)]

 world’s total primary energy demand could be met. 0
 1500
 There is already enormous untapped potential.
 Vast areas such as roofs, building surfaces, fallow -50
 land and desert could be used to support solar 1000
 power generation. For example, 40% of the -150 -100 -50 0 50 100 150
 European Union’s total electricity demand in 2020
 could be met if all suitable roofs and facades were source: Gregor Czisch, ISET, Kassel, Germany.
 covered with solar panels2.

14
1
 Solar baSicS

1.5. Example: How PV can meet TABLE 3
residential consumption POTENTIAL FOR SOLAR POWER
 IN THE EU-27 IN 2020
Electricity produced by a PV installation on a house
over a year can generally cover the demands of a
typical family. The graph in Figure 5 shows the daily European population 497,659,814
electricity needs for a household of 2-3 people, Total ground floor area 22,621 km2
compared to the electricity generated from a 20
m² PV installation in a sunny region (about 1200 Building-integrated solar 12,193 km2 or
kWh/kWp). Electricity demand is largely met and potential (roofs and facades) 1,425 TWh/a
exceeded during spring and summer. In winter Expected electricity demand 3,525 TWh/a
more electricity is used for lighting and heating,
and there is a shorter daytime period. In this period Potential share of electricity 40% “Electricity
the house can draw additional power from the grid. demand covered by building- demand is
 integrated PV largely met
The model assumes that the PV system uses and
modules with efficiency of 14%, and that it is installed source: Sunrise project/EPIA.
 exceeded
on a roof at the optimum inclination angle. The Sunrise during spring
Project toolbox has been used for calculations. and
 FIGURE 5 summer.”
 COMPARISON OF THE AVERAGE DAILY
 ELECTRICITY NEEDS OF A 2-3 PEOPLE
 HOUSEHOLD WITH THE ELECTRICITY
 OUTPUT OF A 20M² PV SYSTEM.
 kWh/day

 16

 14

 12

 10

 8

 6

 4

 2

 0
 Daily output Daily output Daily output Daily output
 in March in July in September in December

 DAILY PV ELECTRICITY OUTPUT
 ELECTRICAL APPLIANCES CONSUMPTION

 source: Sunrise project/EPIA.

 15
Table 3 shows the electricity demand of typical For solar energy to be truly effective, it must be
 households in nine different countries. The table implemented together with responsible energy
 also shows the area that would need to be covered consumption and energy efficiency. Measures
 in PV modules to cater to this demand. The such as improved insulation and double glazing will
 numbers are averages, so large deviations are significantly improve energy consumption. Better
 possible for individual households. These depend energy efficiency makes it possible to meet
 on factors such as the energy efficiency of the electricity demand with sustainable solar power,
 dwelling, the number of household appliance, and using significantly lower coverage areas than those
 the level of insulation against heat loss and intrusion. shown in Table 4.
 Depending on solar irradiation levels in each city
 and the electricity consumption pattern of a typical
“Solar energy home, the required area for solar power ranges
must be from 14 m² in Rome, to 45 m² in New York. The
implemented amount of roof space available for solar power
together with generation varies by country. The average rooftop
responsible area needed per household in Tokyo or Seoul is
energy significantly lower than that in Munich.
consumption
and energy TABLE 4
efficiency.” AVERAGE HOUSEHOLD
 CONSUMPTION AND PV COVERAGE
 AREA NEEDED TO MEET DEMAND
 IN NINE COUNTRIES

 City, Country Annual Area of PV
 Consumption modules
 (kWh) needed (m²)

 Copenhagen, Denmark 4,400 33

 Kuala Lumpur, Malaysia 3,700 15

 London, UK (2008) 3,300 24

 Munich, Germany (2008) 4,000 25

 New York, USA 11,000 45

 Rome, Italy 2,700 14

 Seoul, South-Korea 3,600 16

 Sydney, Australia 8,000 30

 Tokyo, Japan 3,500 20

 source: EPIA, IEA PVPS.

16
Solar technology and induStry 2

 17
2 Solar technology a. PV cells and modules

 and induStry The solar cell is the basic unit of a PV system.
 PV cells are generally made either from:
 2.1. PV systems • crystalline silicon, sliced from ingots
 The key parts of a solar energy generation or castings,
 system are: • from grown ribbons or
 • Photovoltaic modules to collect sunlight • from alternative semiconductor materials
 • An inverter to transform direct current (DC) to deposited in thin layers on a low-cost backing
 alternate current (AC) (Thin Film).

 • A set of batteries for stand-alone PV systems Cells are connected together to form larger units
 called modules. Thin sheets of EVA* or PVB** are
 • Support structures to orient the PV modules used to bind cells together and to provide weather
 toward the Sun. protection. The modules are normally enclosed
 The system components, excluding the PV between a transparent cover (usually glass) and a
 modules, are referred to as the balance of system weatherproof backing sheet (typically made from a
 (BOS) components. thin polymer). Modules can be framed for extra
 mechanical strength and durability. Thin Film
 modules are usually encapsulated between two
 FIGURE 6
 sheets of glass, so a frame is not needed.
 DIFFERENT CONFIGURATIONS
 OF SOLAR POWER SYSTEMS

 GRID-CONNECTED PV SYSTEM CONFIGURATION OFF-GRID PV SYSTEM CONFIGURATION

 PHOTOVOLTAIC PHOTOVOLTAIC
 MODULES MODULES

POWER GRID ELECTRICAL
 ELECTRICAL
 APPLIANCE APPLIANCE

 INVERTER CHARGE CONTROLLER

 INVERTER

 ELECTRICITY ELECTRICAL ELECTRICAL
 METER APPLIANCE APPLIANCE
 + – + –
 BATTERIES

 source: EPIA.

 * Ethyl Vinyl Acetate.
 ** Polyvinyl Butyral.

18
2
 Solar
 technology
 and induStry

Modules can be connected to each other in series b. Inverters
(known as an array) to increase the total voltage
 Inverters convert the DC power generated by a PV
produced by the system. The arrays are connected
 module to AC power. This makes the system
in parallel to increase the system current.
 compatible with the electricity distribution network
The power generated by PV modules varies from and most common electrical appliances. An
a few watts (typically 20 to 60 Wp) up to 300 to inverter is essential for grid-connected PV
350 Wp depending on module size and the systems. Inverters are offered in a wide range of
technology used. Low wattage modules are power classes ranging from a few hundred watts
typically used for stand-alone applications where (normally for stand-alone systems), to several kW
power demand is generally low. (the most frequently used range) and even up to
 2,000 kW central inverters for large-scale systems.
Standard crystalline silicon modules contain about
60 to 72 solar cells and have a nominal power
ranging from 120 to 300 Wp depending on size c. Batteries and charge controllers
and efficiency. Standard Thin Film modules have
 Stand-alone PV systems require a battery to store
lower nominal power (60 to 120 Wp) and their size
 energy for future use. Lead acid batteries are
is generally smaller. Modules can be sized
 typically used. New high-quality batteries, designed
according to the site where they will be placed and
 specifically for solar applications and with a life of
installed quickly. They are robust, reliable and
 up to 15 years, are now available. The actual
weatherproof. Module producers usually guarantee
 lifetime of a battery depends on how it is managed.
a power output of 80% of the Wp, even after 20 to
25 years of use. Module lifetime is typically Batteries are connected to the PV array via a
considered of 25 years, although it can easily charge controller. The charge controller protects
reach over 30 years. the battery from overcharging or discharging. It can
 also provide information about the state of the
 system or enable metering and payment for the
 electricity used.

 PV modules integrated
 into flat roof.

 Antireflection coating
 based on nitride to
 optimize light penetration
 into solar cell.

 19
2.2. Photovoltaic technologies Manufacturing process
 PV technologies are classified as first, second or The manufacturing process of c-Si modules takes
 third generation. First generation technology is the five steps (see Figure 8).
 basic crystalline silicon (c-Si). Second generation
 includes Thin Film technologies, while third
 generation includes concentrator photovoltaics, FIGURE 7
 CRYSTALLINE SILICON CELLS
 organics, and other technologies that have not yet
 been commercialised at large scale.

 a. Crystalline silicon technology
 Crystalline silicon cells are made from thin slices
 (wafers) cut from a single crystal or a block of silicon.
 The type of crystalline cell produced depends on
 how the wafers are made. The main types of
 crystalline cells are:
 • Mono crystalline (mc-Si):
 • Polycrystalline or multi crystalline (pc-Si)
 Polycrystalline silicon
 PV cell.
 • Ribbon and sheet-defined film growth
 (ribbon/sheet c-Si).
 The single crystal method provides higher
 efficiency, and therefore higher power generation.
 Crystalline silicon is the most common and mature
 technology representing about 80% of the market
 today. Cells turn between 14 and 22% of the
 sunlight that reaches them into electricity. For c-Si
 modules, efficiency ranges between 12 and 19%
 (see Table 7).
 Individual solar cells range from 1 to 15 cm across
 (0.4 to 6 inches). However, the most common cells
 are 12.7 x 12.7 cm (5 x 5 inches) or 15 x 15 cm Monocrystalline
 solar cell.
 (6 x 6 inches) and produce 3 to 4.5 W – a very
 small amount of power. A standard c-Si module is
 made up of about 60 to 72 solar cells and has a
 nominal power ranging from 120 to 300 Wp
 depending on size and efficiency.
 The typical module size is 1.4 to 1.7 m² although
 larger modules are also manufactured (up to 2.5
 m²). These are typically utilised for BIPV applications.

20
2
 Solar
 technology
 and induStry

FIGURE 8
CRYSTALLINE SILICON
MANUFACTURING PROCESS

 SILICON INGOTS WAFER CELL MODULE

 1 2 3 4 5
The steps, in detail are: b. Creation of the potential difference (p-n)
 junction: A potential difference between
1. Convert the metallurgical silicon into high purity “Silicon is the
 two points gives rise to an electromotive
 polysilicon (known as solar grade silicon). second most
 force that pushes electrons from one
 abundant
 Silicon is the second most abundant element point to the other. A solar wafer needs to
 element in
 in the Earth's crust after oxygen. It is found in have a p-n between the surface and the
 the earth’s
 quartz or sand. Metallurgical silicon is 98 to bottom of the cell. This step takes place
 crust after
 99% pure. The polysilicon required for solar in a diffusion oven.
 oxygen.”
 cells can be up to 99.999999% pure. The most
 c. Deposition of an anti-reflective coating:
 common process for converting raw silicon into
 The coating enables the cell to absorb
 solar grade silicon is the Siemens process.
 the maximum amount of light. It also
2. Form the ingots. gives cells their typical blue colour.
 The polysilicon is melted in large quartz d. Metallisation: Metal contacts (usually
 crucibles, and then cooled to form a long solid silver) are added to the cell so the
 block called an ingot. The type of wafer that will electrons can be transported to the
 be cut from the ingot depends on the process external circuit. A thin metal grid, known
 used to form the ingot. Monocrystalline wafers as a finger, is attached to the front surface
 have a regular, perfectly-ordered crystal of the cell. Wider metal strips, known as
 structure, while multicrystalline wafers have an busbars, are connected to the front and
 unstructured group of crystals. The level of back surfaces of the cell.
 structure affects how electrons move over the
 The fingers collect the current generated
 surface of the cell.
 by the cell, while the busbars connect the
3. Slice the ingot or block into wafers. fingers and provide external connection
 points to other cells. The entire back
 A wire saw is used to slice the wafer from the
 surface of the cell is coated with aluminium
 ingot or block. The saw is about the same
 to create a reflective inner surface.
 thickness as the wafer. This method of slicing
 produces significant wastage – up to 40% of 5. Connect and coat the cells to form a module.
 the silicon (known as kerf loss). Using a laser
 The cells are effectively sandwiched between
 cutter reduces kerf loss; however, this can only
 layers of coating material to protect them from
 be done on ingots formed by string ribbon or
 the environment and breakage. Transparent
 sheet/edge-defined film growth.
 glass is used for the front, while a weatherproof
4. Transform the wafer into a solar cell. backing (typically a thin polymer) is applied to the
 back of the module. The cover is attached using
 The cell is the unit that produces the electricity.
 thin sheets of EVA or PVB. Frames can be placed
 It is created using four main steps:
 around the modules to increase their strength.
 a. Surface treatment: The wafer’s top layer For some specific applications, such as
 is removed to make it perfectly flat. integration into a building, the back of the module
 is also made of glass to allow light through.

 21
Alternative cell manufacturing technologies b. Thin Films
 Advances and alternatives in cell manufacturing
 Thin Film modules are constructed by depositing
 methods are producing cells with higher levels of
 extremely thin layers of photosensitive material on
 efficiency. Some of the most promising emerging
 to a low-cost backing such as glass, stainless steel
 technologies include:
 or plastic. Once the deposited material is attached
 • Buried contacts: to the backing, it is laser-cut into multiple thin cells.
 Instead of placing the fingers and busbars on Thin Film modules are normally enclosed between
 the front of the cell, they are buried in a laser- two layers of glass and are frameless. If the
 cut groove inside the solar cell. The change photosensitive material has been deposited on a thin
 makes the cell surface area larger, enabling it plastic film, the module is flexible. This creates
 to absorb more sunlight. opportunities to integrate solar power generation into
 the fabric of a building or end-consumer applications.
 • Back contact cells:
 Four types of Thin Film modules are
 The front contact of the cell is moved to the
 commercially available:
 back. The cell’s surface area is increased and
 shadowing losses are reduced. This technology 1. Amorphous silicon (a-Si)
 currently provides the highest commercial cell-
 The semiconductor layer is only about 1 µm
 efficiency available on the market.
 thick. Amorphous silicon can absorb more
 • Pluto™: sunlight than c-Si structures. However, a lower
 flow of electrons is generated which leads to
 Developed by Suntech, Pluto™ features a
 efficiencies that are currently in the range of 4
 unique texturing process that improves sunlight
 to 8%. With this technology the absorption
 absorption, even in low and indirect light.
 material can be deposited onto very large
 • HIT™ (Heterojunction with Intrinsic Thin Layer): substrates (up to 5.7 m² on glass), reducing
 manufacturing costs. An increasing number of
 Developed by Sanyo Electrics, the HIT™ cell
 companies are developing light, flexible a-Si
 consists of a thin, single-crystal wafer
 modules perfectly suitable for flat and curved
 sandwiched between ultra-thin amorphous
 industrial roofs.
 silicon (a-Si) layers. Using both amorphous and
 single crystal silicon improves efficiency. 2. Multi-junction thin silicon film (a-Si/µc-Si)
 This consists of an a-Si cell with additional layers
 TABLE 5 of a-Si and micro-crystalline silicon (µc-Si)
 COMMERCIALISED CELL applied onto the substrate. The µc-Si layer
 EFFICIENCY RECORDS absorbs more light from the red and near-
 infrared part of the light spectrum. This increases
 Technology Commercialised efficiency by up to 10%. The thickness of the µc-
 cell efficiency Si layer is in the order of 3 µm, making the cells
 record thicker but also more stable. The current
 maximum substrate size for this technology is
 Mono (back contact) 22%
 1.4 m² which avoids instability.
 HIT™ 19.8%

 Mono (Pluto™) 19%

 Nanoparticle ink 18.9%

 Mono 18.5%

 source: Greentech Media, July 2010.

22
2
 Solar
 technology
 and induStry

3. Cadmium telluride (CdTe) FIGURE 9
 THIN FILM MODULE
 CdTe Thin Films cost less to manufacture and
 have a module efficiency of up to 11%. This
 makes it the most economical Thin Film
 technology currently available.
 The two main raw materials are cadmium and
 tellurium. Cadmium is a by-product of zinc
 mining. Tellurium is a by-product of copper
 processing. It is produced in far lower quantities
 than cadmium. Availability in the long-term may
 depend on whether the copper industry can
 optimise extraction, refining and recycling yields.
4. Copper, indium, gallium, (di)selenide/
 (di)sulphide (CIGS) and copper, indium,
 (di)selenide/(di)sulphide (CIS)
 CIGS and CIS offer the highest efficiencies of
 all Thin Film technologies. Efficiencies of 20%
 have been achieved in the laboratory, close to
 the levels achieved with c-Si cells. The
 Thin Film CdTe Module.
 manufacturing process is more complex and
 less standardised than for other types of cells.
 This tends to increase manufacturing costs.
 Current module efficiencies are in the range
 of 7 to 12%. TABLE 6
 SUMMARY OF RECORD
 There are no long-term availability issues for EFFICIENCIES OF THIN
 selenium and gallium, Indium is available in FILM TECHNOLOGIES
 limited quantities but they are no signs of an
 incoming shortage. While there is a lot of indium
 Thin Film Record Record Lab
 in tin and tungsten ores, extracting it could drive
 technology commercial efficiency
 the prices higher. A number of industries
 module efficiency
 compete for the indium resources: the liquid
 crystal display (LCD) industry currently accounts a-Si 7.1% 10.4%
 for 85% of demand. It is highly likely that indium
 a-Si/µ-Si 10% 13.2%
 prices will remain high in the coming years.
 CdTe 11.2% 16.5%

 CIGS/CIS 12.1% 20.3%
Typical module power ranges from 60 to 350 W
depending on the substrate size and efficiency. source: A. Green et al., 20103, Lux Research Inc4,
 EPIA research
There is no common industry agreement on
optimal module size for Thin-Film technologies. As
a result they vary from 0.6 to 1.0 m² for CIGS and
CdTe, to 1.4 to 5.7 m² for silicon-based Thin Films.
Very large modules are of great interest to the
building sector as they offer efficiencies in terms of
handling and price.

 23
FIGURE 10
 STEPS IN MAKING THIN
 FILM SOLAR CELLS
 SUBSTRATE TYPE e.g. CiS

 FRONT TCO ABSORBER BACK BACK
 COVER CONTACT COVER
 1 2 3 4 5
 SUPERSTRATE TYPE e.g. a-Si / -Si /CdTe

 Thin Film manufacturing processes is to collect as much sunlight as possible. CPV
 cells can be based on silicon or III-V compounds
 Thin Films are manufactured in five common steps:
 (generally gallium arsenide or GaA).
 1. A large sheet of substrate is produced. Typically
 CPV systems use only direct irradiation.* They are
 this is made of glass although other materials
 most efficient in very sunny areas which have high
 such as flexible steel, plastic or aluminium are
 amounts of direct irradiation.
 also utilised.
 The concentrating intensity ranges from a factor of 2
 2. The substrate is coated with a transparent
 to 100 suns (low concentration) up to 1000 suns
 conducting layer (TCO).
 (high concentration). Commercial module efficiencies
 3. Semiconductor material (absorber) is deposited of 20 to 25% have been obtained for silicon based
 onto the substrate or superstrate. This layer can cells. Efficiencies of 25 to 30% have been achieved
 be deposited using many different techniques. with GaAs, although cell efficiencies well above 40%
 Chemical and physical vapour depositions are have been achieved in the laboratory.
 the most common. For some technologies
 The modules have precise and accurate sets of
 (usually CIGS, CIS and CdTe), a cadmium
 lenses which need to be permanently oriented
 sulphide (CdS) layer is also applied to the
 towards the Sun. This is achieved through the use
 substrate to increase light absorption.
 of a double-axis tracking system. Low concentration
 4. The metallic contact strips on the back are PV can be also used with one single-axis tracking
 applied using laser scribing or traditional system and a less complex set of lenses.
 screen-printing techniques. The back contact
 strips enable the modules to be connected. FIGURE 11
 CONCENTRATOR PV
 5. The entire module is enclosed in a glass- MODULES
 polymer casing.
 For flexible substrates, the manufacturing process uses
 the roll-to-roll (R2R) technique. R2R enables
 manufacturers to create solar cells on a roll of flexible
 plastic or metal foil. Using R2R has the potential to
 reduce production time, and both manufacturing and
 transport costs. R2R can be used at much lower
 temperatures in smaller, non-sterile production facilities.

 c. Concentrator photovoltaics
 Concentrator photovoltaics (CPV) utilise lenses to
 focus sunlight on to solar cells. The cells are made Concentrator Photovoltaics
 from very small amounts of highly efficient, but installed on trackers to follow
 the sun.
 expensive, semi-conducting PV material. The aim * Sunlight consists of both direct and diffuse irradiation. Diffuse
 irradiation occurs because of the reflection and refraction of
 sunlight when it comes into contact with the Earth’s atmosphere,
 clouds and the ground.
24
2
 Solar
 technology
 and induStry

d. Third generation photovoltaics • Advanced inorganic Thin Films such as spherical
 CIS and Thin-Film polycrystalline silicon solar cells.
After more than 20 years of research and
development, third generation solar devices are • Organic solar cells which include both fully
beginning to emerge in the marketplace. organic and hybrid dye-sensitised solar cells.
Many of the new technologies are very promising. • Thermo-photovoltaic (TPV) low band-gap cells
One exciting development is organic PV cells. which can be used in combined heat and
These include both fully organic PV (OPV) solar cells power (CHP) systems.
and the hybrid dye-sensitised solar cells (DSSC).
 Third generation PV products have a significant
Suppliers of OPV produced 5 MW of solar cells in competitive advantage in consumer applications
2009. They are moving towards full because of the substrate flexibility and ability to
commercialisation and have announced plans to perform in dim or variable lighting conditions. Possible “Third
increase production to more than 1 GW by 2012. application areas include low-power consumer generation
Current cell efficiencies are about 6% for very small electronics (such as mobile phone rechargers, solar devices
areas and below 4% for larger areas. lighting applications and self-powered displays), are beginning
 outdoor recreational applications, and BIPV. to emerge in
Manufacturers of DSSC produced about 30 MW of the market-
solar cells in 2009. By 2012, 200 MW are expected In addition to the emerging third generation place.”
to be produced. In 2009, some low-power PV technologies mentioned, a number of novel
applications were already commercially available. technologies are also under development:
Efficiencies achieved at the lab across a very small
 • Active layers can be created by introducing
area are in the range of 8 to 12%. Commercial
 quantum dots or nanotechnology particles.
applications still have efficiency below 4%.
 This technology is likely to be used in
For both technologies, manufacturing costs is concentrator devices.
constantly decreasing and is expected to reach
 • Tailoring the solar spectrum to wavelengths with
0.50€/W by 2020. This is enabled by the use of
 maximum collection efficiency or increasing the
the R2R manufacturing process and standard
 absorption level of the solar cell. These
printing technologies. The major challenges for this
 adjustments can be applied to all existing solar
sector are the low device efficiency and their
 cell technologies.
instability in the long-term.
 Table 7 shows the efficiency ranges of currently
Third generation technologies that are beginning to
 available commercial technologies. The area
reach the market are called “emerging” and can be
 that needs to be covered to generate 1 kWp is
classified as:
 also shown.

TABLE 7
OVERVIEW OF COMMERCIAL
PV TECHNOLOGIES

Commercial Module Efficiency

Technology Thin Film Crystalline Silicon CPV

 (a-Si) (CdTe) CI(G)S a-Si/µc-Si Dye s. Mono Multi III-V Multi-
 cells junction

Cell efficiency 16-22% 14-18% 30-38%
 4-8% 10-11% 7-12% 7-9% 2-4%
Module efficiency 13-19% 11-15% ~25%

Area needed per ~15m2 ~10m2 ~10m2 ~12m2 ~7m2 ~8m2
KW (for modules)
source: EPIA 2010. Photon international, March 2010, EPIA analysis. Efficiency based on Standard Test conditions.

 25
e. Historical and future evolution FIGURE 12
 HISTORICAL EVOLUTION OF
 Crystalline silicon technologies have dominated the TECHNOLOGY MARKET SHARE
 market for the last 30 years. Amorphous silicon (a- AND FUTURE TRENDS
 %
 Si) has been the technology most used for
 consumer applications (e.g. calculators, solar
 watches) due to its lower manufacturing cost while 100

 c-Si technologies have been used mainly in both 90
 stand-alone and on-grid systems. 80

 Within the c-Si technologies, mono- and multi- 70

 crystalline cells are produced in fairly equal 60

 proportion. However, multi-crystalline cells are 50

 gaining market share. Ribbon c-Si represents less 40
 than 5% of the market. 30

 While a-Si has been the preferred clear Thin-Film 20

 technology used over the past three decades, its 10

 market share has decreased significantly 0

 1980

 1985

 1990

 1995

 2000

 2005

 2010

 2015

 2020
 compared to more advanced and competitive
 technologies. For example, CdTe has grown from
 a 2% market share in 2005 to 13% in 2010. EMERGING & CPV
 CIGS
 Technologies such as Concentrator PV (CPV),
 CdTe
 organics and dye-sensitised solar cells are a-Si
 beginning to enter the market. They are expected c-Si
 to achieve significant market share in the next few
 source: Historical data (until 2009) based
 years, capturing around 5% of the market by 2020. on Navigant Consulting. Estimations based
 on EPIA analysis.

 EPIA expects that by 2020 silicon wafer-based
 technologies will account for about 61% of sales,
 while Thin Films will account for around 33%. CPV
 and emerging technologies will account for the
 remaining 6%.

26
2
 Solar
 technology
 and induStry

2.3. The PV value chain • In the case of Thin Film module manufacturing,
 about 160 companies are active. About 130 of
The PV value chain is typically divided into a
 these companies produce silicon-based Thin
number of upstream and downstream activities.
 Films. Around 30 produce CIGS/CIS Thin Films,
 while a handful of companies are active in CdTe.
a. The upstream part of the value chain
 • There are currently more than 50 companies
Upstream activities include all steps from the that offer turnkey c-Si production lines. Less
manufacturing of equipment and materials to the than 30 manufacturers provide the PV industry
production of modules, inverters and other balance with Thin Film production lines6.
of system (BOS) elements. Supply of certain
materials and equipment is concentrated in the
hands of a few very large players. For example:
 TABLE 8
• About 75 companies are active in polysilicon NUMBER OF COMPANIES
 production. However, in 2009, more than 90% WORLD-WIDE IN THE THIN
 FILM VALUE CHAIN
 of the total supply was manufactured by seven
 major players from Europe, the USA and
 Japan. Nowadays many Chinese companies CdTe a-Si a-Si/µ-Si CI(G)S
 are ramping-up capacity and are expected to Number of 4 131 30
 account for a larger share of the polysilicon companies
 market over the next few years5. (as of 2009)
• The market is more segmented and Production 1,100 < 300 < 400 < 200
 competitive in the area of wafer and cell in 2009 MW MW MW MW
 manufacturing. More than 200 companies are
 active in this sector. Around 1,000 companies source: Energy Focus, Photon, JRC and EPIA.

 produced c-Si modules in 2010.
• Also with respect to inverter production, the top ten
 companies produce more than 80% of the
 inverters sold on the market, even though there are
 more than 300 companies active in this segment.

TABLE 9
NUMBER OF COMPANIES
WORLD-WIDE IN THE CRYSTALLINE
SILICON VALUE CHAIN
2009

 SILICON INGOTS WAFERS CELLS MODULES

2009

Number of
companies: 75 208 239 988

Production 130,000
capacity: TONNES 15,000 MW 18,000 MW 19,000 MW

Effective 90,000
production: TONNES 10,000 MW 9,000 MW 7,000 MW

source: ENergy Focus, Photon, JRC and EPIA.

 27
b. The downstream part of the value chain companies are known as “pure players”. However,
 there has been an increasing tendency to integrate
 The downstream part of the value chain includes:
 additional production steps into the same
 • Wholesalers who function as intermediaries company. Known as “integrated players”, these
 between the manufacturers and the installer or companies cover a number of activities ranging
 end customer. from silicon to module production. Companies that
 cover all steps in the process are known as “fully
 • System developers who offer their services in
 integrated players”. Both approaches present
 building turnkey PV installations.
 benefits and drawbacks. On the one hand, the
 • Owners of PV installations that sell their power “pure players” may be more competitive in their
 to the grid. core activity, but they can be highly dependent on
“The standardisation efforts and their suppliers. The
 Many small to medium enterprises (SMEs) are
consolidation “integrated players” on the other hand have more
 involved in these activities and most are locally
of the PV security over their supply chain and are generally
 organised. As such, this part of the value chain is
sector is more flexible financially. However, their research
 very fragmented and difficult to track.
likely to end and development expenditure cannot be affected
the current The engineering, procurement and construction to one specific part of the value chain.
fragmentation (EPC) companies involved in the development of
 While some of the top polysilicon producers are
and facilitate PV systems are experienced in obtaining finance,
 still pure players, many are also moving into the
the emergence selecting the correct components and advising on
 wafer production business. Most cell
of larger a suitable location and system design. Most are
 manufacturers secure sales through the
industry familiar with local legal, administrative and grid
 production of modules. Today, many large c-Si PV
players.” connection requirements. They can guide the PV
 companies are integrated players and some have,
 system owner through the different types of support
 or intend to, become fully integrated. The Thin Film
 mechanisms. EPC companies also physically install
 manufacturing sector is not segmented to the
 the PV system using either internal personnel or
 same extent as the entire manufacturing process
 qualified subcontractors. As a result of the latest
 is normally carried out at a single facility.
 technological developments in BIPV and CPV,
 some developers have developed specific Integration does not only occur in the upstream part
 expertise and are now specialising in these areas. of the value chain. About 30% of module
 manufacturers are currently active in the
 PV systems have a typical lifespan of at least 25
 development of complete PV systems.* Moreover,
 years. At the end of its life, the system is
 some system developers are also starting to own
 decommissioned and the modules are recycled. In
 systems and sell electricity to grid operators. This is
 Europe, the PV CYCLE association established a
 known as the utility concept and the business model
 voluntary take back scheme with established already
 is gaining support. This is especially true in the US,
 a large number of collection points in different EU
 where an increasing number of module producers
 countries where PV modules are collected are sent
 are entering the electricity generation market.
 to specialised PV recycling facilities for recycling. The
 recycled materials (such as glass, aluminium, In recent years there have been a number of
 semiconductor materials, ...) can then be re-used mergers and acquisitions amongst PV companies.
 for the production of PV or other products. For more A total of 61 such transactions were reported in
 information about PV CYCLE, see Solar benefits and the solar industry between July 2008 and March
 sustainability in part 67. 20098. This consolidation is likely to end the
 current fragmentation of the solar PV market and
 facilitate the emergence of larger industry players.
 c. Consolidation trends in the solar industry
 Companies having large production capacities at
 For many years, most companies have grown by their disposal will benefit from the consequent
 specialising in a single activity within the value chain economies of scale. This will result into a further
 (especially in the case of c-Si technologies). These decrease of the manufacturing costs.

 * This calculation is based on the membership of EPIA, which can
 be considered is a representative sample of all the players in the
28 PV industry.
You can also read