SONAR, A HIGHLY RESPONSIVE NAD+/NADH SENSOR, ALLOWS HIGH-THROUGHPUT METABOLIC SCREENING OF ANTI-TUMOR AGENTS
←
→
Page content transcription
If your browser does not render page correctly, please read the page content below
Resource
SoNar, a Highly Responsive NAD+/NADH Sensor,
Allows High-Throughput Metabolic Screening of
Anti-tumor Agents
Graphical Abstract Authors
Yuzheng Zhao, Qingxun Hu, ...,
Joseph Loscalzo, Yi Yang
Correspondence
yiyang@ecust.edu.cn
In Brief
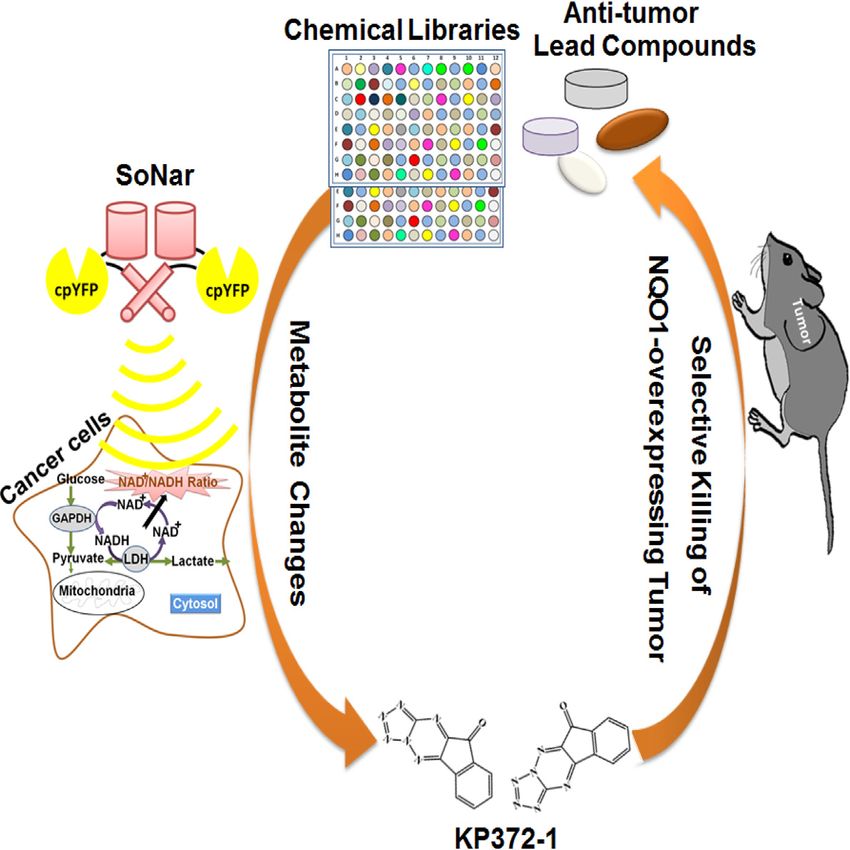
Zhao et al. report the development of
‘‘SoNar,’’ an intensely fluorescent, rapidly
responsive, pH-resistant sensor for
cytosolic NAD+ and NADH redox states
in vivo. High-throughput metabolic
screening of anticancer compounds
identified KP372-1 as a potent redox
cycling anti-tumor agent.
Highlights
d SoNar sensor is capable of tracking subtle changes in NAD+/
NADH in vitro and in vivo
d SoNar enables high-throughput screening for new agents
targeting tumor metabolism
d KP372-1 is identified as a potent NQO1-dependent redox
cycling anti-tumor agent
Zhao et al., 2015, Cell Metabolism 21, 777–789
May 5, 2015 ª2015 Elsevier Inc.
http://dx.doi.org/10.1016/j.cmet.2015.04.009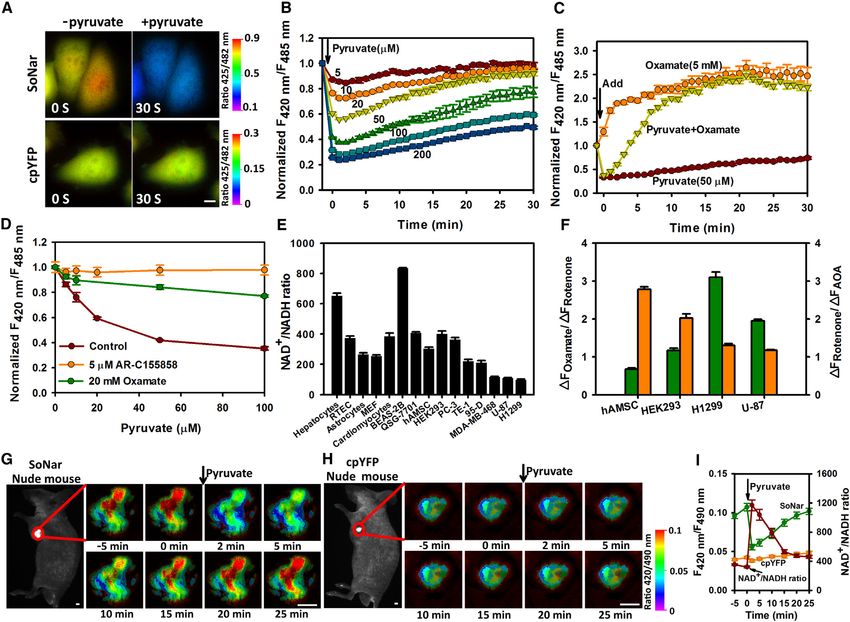
Cell Metabolism

Resource

SoNar, a Highly Responsive NAD+/NADH Sensor,
Allows High-Throughput Metabolic Screening
of Anti-tumor Agents
Yuzheng Zhao,1,2,3,4 Qingxun Hu,1 Feixiong Cheng,4 Ni Su,1,2,4 Aoxue Wang,1,2,4 Yejun Zou,1,2,4 Hanyang Hu,1
Xianjun Chen,1,2,4 Hai-Meng Zhou,5 Xinzhi Huang,6 Kai Yang,6 Qian Zhu,1,2 Xue Wang,1 Jing Yi,6 Linyong Zhu,7
Xuhong Qian,8 Lixin Chen,9 Yun Tang,4 Joseph Loscalzo,10 and Yi Yang1,2,3,4,*
1Synthetic Biology and Biotechnology Laboratory, State Key Laboratory of Bioreactor Engineering, Shanghai Collaborative Innovation Center

for Biomanufacturing Technology
2Optogenetics & Molecular Imaging Interdisciplinary Research Center, CAS Center for Excellence in Brain Science
3Collaborative Innovation Center of Genetics and Development
4Shanghai Key Laboratory of New Drug Design, School of Pharmacy

East China University of Science and Technology, 130 Mei Long Road, Shanghai 200237, China
5Zhejiang Provincial Key Laboratory of Applied Enzymology, Yangtze Delta Region Institute of Tsinghua University, Jiaxing 314006, China
6Department of Biochemistry and Molecular Cell Biology, Key Laboratory of the Education Ministry for Cell Differentiation and Apoptosis,

Institutes of Medical Sciences, Shanghai Jiao Tong University School of Medicine, 280 S. Chongqing Road, Shanghai 200025, China
7Key Laboratory for Advanced Materials, Institute of Fine Chemicals
8Shanghai Key Laboratory of Chemical Biology

East China University of Science and Technology, 130 Mei Long Road, Shanghai 200237, China
9Shanghai Laboratory Animal Center, Chinese Academy of Sciences, Shanghai 201615, China
10Department of Medicine, Brigham and Women’s Hospital, Harvard Medical School, Boston, MA 02115, USA

*Correspondence: yiyang@ecust.edu.cn
http://dx.doi.org/10.1016/j.cmet.2015.04.009

SUMMARY                                                               cally reprogrammed to support energy demand and increased
                                                                      biosynthesis of macromolecules for rapid cell proliferation,
The altered metabolism of tumor cells confers a se-                   which has attracted many efforts to target it as a selective
lective advantage for survival and proliferation, and                 anticancer strategy (Cairns et al., 2011; Vander Heiden, 2011;
studies have shown that targeting such metabolic                      Vander Heiden et al., 2009). Biochemical methods, including
shifts may be a useful therapeutic strategy. We                       enzymatic cycling assays, chromatography, mass spectrometry,
developed an intensely fluorescent, rapidly respon-                   and nuclear magnetic resonance spectroscopy, can be used to
                                                                      assess cellular metabolism and search for new cancer-targeting
sive, pH-resistant, genetically encoded sensor of
                                                                      agents. Most of these methods require cell lysis, are time inten-
wide dynamic range, denoted SoNar, for tracking
                                                                      sive, and, therefore, are not suitable for quantitative, real-
cytosolic NAD+ and NADH redox states in living cells                  time high-throughput screening. High-throughput screening of
and in vivo. SoNar responds to subtle perturbations                   such agents in cells or in vivo is much more difficult and rarely re-
of various pathways of energy metabolism in real                      ported. The use of genetically encoded fluorescent sensors may
time, and allowed high-throughput screening for                       be a more suitable approach for metabolic chemical screening.
new agents targeting tumor metabolism. Among >                        To date, these sensors have been developed for single-cell
5,500 unique compounds, we identified KP372-1 as                      real-time monitoring of several key metabolites (Zhao and
a potent NQO1-mediated redox cycling agent that                       Yang, 2015). Among these metabolites, NAD+ and its reduced
produced extreme oxidative stress, selectively                        form, NADH, are the most important cofactors involved in energy
induced cancer cell apoptosis, and effectively                        metabolism. Recently, Yellen’s group and our group indepen-
                                                                      dently developed genetically encoded NADH sensors that allow
decreased tumor growth in vivo. This study demon-
                                                                      specific monitoring of dynamic changes in NADH levels in
strates that genetically encoded sensor-based meta-
                                                                      cytosol or mitochondria as affected by different metabolic states
bolic screening could serve as a valuable approach                    (Hung et al., 2011; Zhao et al., 2011). These Frex sensors (Zhao
for drug discovery.                                                   et al., 2011) specifically report NADH levels over a large dynamic
                                                                      range; however, they do not adapt an optimal tertiary structure in
                                                                      some cells, and their fluorescence is pH sensitive. Peredox sen-
INTRODUCTION                                                          sors (Hung et al., 2011) are much more pH resistant and partially
                                                                      reflect the more physiologically relevant NAD+/NADH ratio; how-
In recent years, there is renewed attention paid to Otto War-         ever, they have a limited dynamic range, and their affinity
burg’s observation in 1924 that cancer cells shift energy meta-       appears too high to be useful under physiological conditions.
bolism from mitochondrial oxidative phosphorylation to aerobic        Importantly, neither Frex nor Peredox sensors show obvious
glycolysis (Warburg, 1956). Cancer cell metabolism is dramati-        fluorescence response to NAD+. Such limitations make it difficult

                                                                     Cell Metabolism 21, 777–789, May 5, 2015 ª2015 Elsevier Inc. 777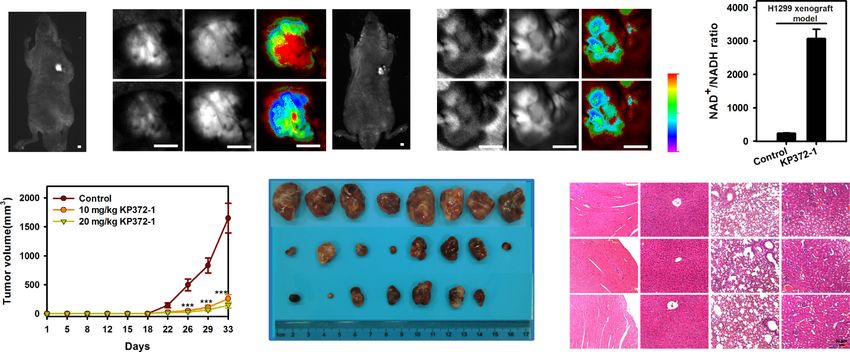
Figure 1. Genetically Encoded Sensor for NAD+, NADH, and Their Ratio
(A) Design of SoNar, which is a fusion of cpYFP and the NADH-binding domain of T-Rex. Binding of NAD+ or NADH induces changes in protein conformation and
fluorescence.
(B) Excitation spectra of purified SoNar in the control condition (black), and after addition of 20 mM NAD+ (green) or 20 mM NADH (orange), normalized to the peak
intensity in the control condition. Emission was measured at 530 nm.
(C) Normalized ratio of fluorescence intensities excited at 420 nm and 485 nm (F420 nm/F485 nm) in the presence of different concentrations of NADH and its
analogs.
(D) Fluorescence ratios plotted against the NAD+/NADH ratio at the indicated total nicotinamide adenine dinucleotide concentration. Fluorescence ratios were
normalized to the control condition in the absence of nucleotides.
(E) Fluorescence excited at 420 nm plotted against the NAD+/NADH ratio at the indicated pH. Fluorescence was normalized to the control condition in the
absence of pyridine nucleotides at pH 7.4.
(F) Kinetics of fluorescence response of purified SoNar, Peredox, and cpYFP protein to sequential addition of 0.2 mM NADH and 2 mM NAD+. In (C)–(F) error bars
represent SEM. See also Figure S1 and Table S1.

to use these sensors for measuring metabolic states in vivo and                   Rex protein from Thermus aquaticus (T-Rex), or between amino
in high-throughput screening.                                                     acid residues located on surface loops of T-Rex (Figure S1A).
   Herein, we report the development of an intensely fluorescent,                 Among them, the chimera with cpYFP inserted after Phe189 of
rapidly responsive, pH-resistant, genetically encoded sensor of                   T-Rex showed a 300% increase in the ratio of fluorescence
wide dynamic range, denoted SoNar, for the detection of cyto-                     when excited at 420 nm and 485 nm upon NADH addition (Fig-
solic NAD+ and NADH redox states in living cells and in vivo.                     ure S1B). We then created a series of truncated variants of this
This sensor of superior properties allowed high-throughput                        protein, either with or without the DNA-binding domain of T-
metabolic screening of > 5,500 unique compounds in cancer                         Rex, targeting residues involved in the linker between Rex and
cell lines. We found that many compounds that increased the                       cpYFP (Figures S1C and S1D), and found the D2-C2N0 variant
NAD+/NADH ratio exhibited marked cancer cell cytotoxicity.                        to manifest the most dramatic increase in the fluorescence ratio
Among them, KP372-1, the most potent in increasing NAD+/                          when excited at 420 and 485 nm in the presence of NADH (Fig-
NADH ratio and cancer cell killing, also effectively decreases tu-                ures 1A, 1B, and S1D–S1G). Intriguingly, in the presence of
mor growth in vivo. Further studies revealed that KP372-1 is an                   saturating NAD+, D2-C2N0 exhibited marked increase in fluores-
NQO1-catalyzed, NAD(P)H-consuming redox cycling agent                             cence when excited at 485 nm (Figures 1B and S1G).
that produces extreme oxidative stress in cancer cells.                              Fluorescence titration studies showed that D2-C2N0 had an
                                                                                  apparent dissociation constant (Kd) 5.0 mM and 0.2 mM,
RESULTS                                                                           respectively, for NAD+ and NADH at pH 7.4 (Figure 1C), far
                                                                                  below the total intracellular pool of NAD+ and NADH in the
Generation of a Genetically Encoded Fluorescent                                   range of hundreds micromolar (Yamada et al., 2006; Yang
Sensor for Detection of NAD+, NADH, and Their Ratio                               et al., 2007). Intracellularly, the sensor would be occupied
A total of 15 chimeric proteins were designed, in which cpYFP                     by either NAD+ or NADH molecules, and its steady-state
was inserted between two complete or truncated subunits of                        fluorescence would report the NAD+/NADH ratio rather than

778 Cell Metabolism 21, 777–789, May 5, 2015 ª2015 Elsevier Inc.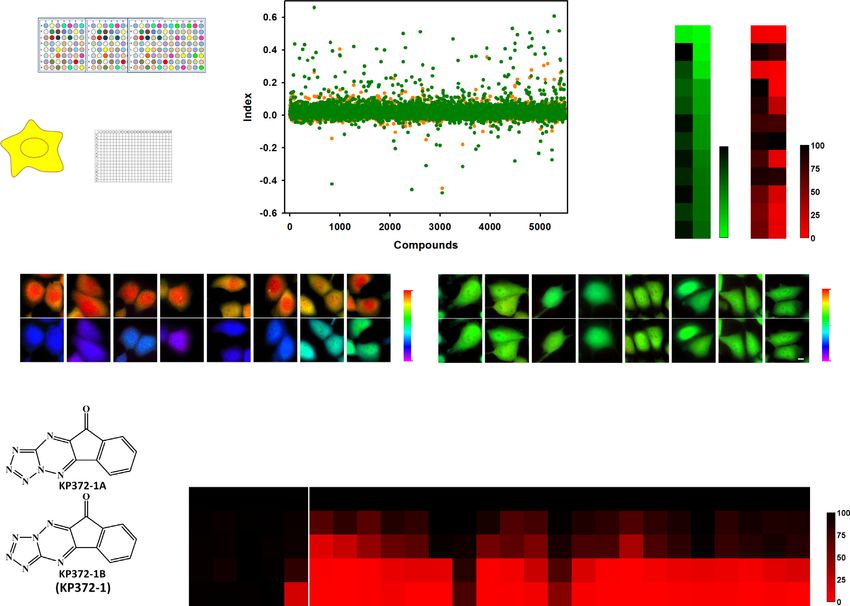
the absolute concentrations of the two nucleotides (Figure 1D).          We then quantified the cytosolic NAD+/NADH ratio utilizing
We find that D2-C2N0 has an apparent KNAD+/NADH of 40, the           SoNar’s fluorescence (Figures 2E, S2F, and S2G). The results
ratio of NAD+ and NADH at which the response is half-maximal,         showed heterogeneity among both cancer cells and non-cancer
and is analogous to the Kd of a ‘‘receptor’’ for the redox couple.    cells. H1299 and several other cancer cell lines showed signifi-
The sensor has high selectivity toward the NAD+/NADH ratio,           cantly lower NAD+/NADH ratios. In these cells, the LDH inhibitor
showing no apparent fluorescence changes toward or in the             was more potent than mitochondrial NADH oxidase inhibition
presence of analogs like NADP+, NADPH, ATP, or ADP (Figures           in reducing the NAD+/NADH ratio, whereas in non-cancer cells,
1C and S1H–S1J). The opposing directional changes of D2-              a malate-aspartate shuttle inhibitor was less potent than the mito-
C2N0 fluorescence in the presence of NAD+ and NADH                    chondrial NADH oxidase inhibitor in decreasing the NAD+/NADH
rendered a 15-fold dynamic range, making the sensor among             ratio (Figure 2F). These results suggest that H1299 cells are highly
the most responsive genetically encoded sensors available to          dependent on glycolysis; mitochondrial respiration is sufficiently
date (Figure 1D). D2-C2N0 fluorescence excited at 420 nm              functional to oxidize NADH derived from glycolysis, but not
was much less sensitive to pH, allowing the measurement of            NADH derived from the TCA cycle. Further studies showed that
NADH levels when modest pH fluctuations occur (Figure 1E).            inhibition of glycolysis with 3-bromopyruvate (3-BrPA) markedly
By contrast, D2-C2N0 fluorescence when excited at 485 nm              increased, whereas glucose supplementation decreased, the
was sensitive to pH, but its dynamic range and KR are more            intracellular NAD+/NADH ratio (Figures S2H–S2J). The glucose
pH resistant (Figures S1K and S1L). Thus, the pH effects can          concentration for the half-maximal SoNar fluorescence response
be alternatively corrected by measuring D2-C2N0’s and                 is 0.26 mM in H1299 cells and 1.4 mM in HEK293 cells (Fig-
cpYFP’s fluorescence in parallel, owing to their very similar         ure S2J), again suggesting that these cancer cells had higher
pH responses (Figures S1L and S1M). Furthermore, kinetic              glycolytic activity utilizing lower concentrations of glucose and
studies showed that the fluorescence of D2-C2N0 responded             thereby maintaining their cytosolic NAD+/NADH ratio.
immediately to sequential addition of NADH and NAD+ (Fig-                The intense fluorescence of the SoNar sensor allows imaging
ure 1F), suggesting its usefulness in real-time measurements.         of cellular redox states in vivo. To this end, nude mice were
Collectively, these data show that D2-C2N0 is highly sensitive        subcutaneously (s.c.) inoculated with H1299 cells stably ex-
and selective for NAD+ and NADH, has rapid responses and              pressing SoNar or cpYFP, and imaged when the tumor reached
a large dynamic range, and is an effective ratiometric sensor         0.6–1.2 cm. When the mice received an intravenous injection of
for NAD+, NADH, and their ratio with its uniquely designed            110 mg/kg sodium pyruvate, with excitation at 420 and 490 nm,
structure. We therefore termed it SoNar (sensor of NAD(H)             the ratio of SoNar fluorescence in the tumor decreased immedi-
redox), and used it for all subsequent experiments.                   ately and then gradually recovered over 25 min (Figures 2G and
                                                                      2I), suggesting that pyruvate in the blood stream significantly
Select Tumor Cell Lines Exhibit Decreased NAD+/NADH                   affected the NAD(H) redox state in the tumor tissue. In contrast,
Redox State                                                           tumor tissue expressing cpYFP instead of SoNar showed no
In H1299 human lung cancer cells, SoNar demonstrated much             obvious fluorescence changes upon pyruvate injection, thereby
more intense fluorescence compared to the Frex sensor and to          excluding the possibility of interference of the sensor’s fluores-
a palette of other genetically encoded sensors (Figure S2A),          cence due to pH variations (Figures 2H and 2I). Taken together,
owing to its robust folding and short coding sequence. In             these data indicate that the SoNar sensor displays a superior
cytosol, pyruvate and lactate are generally believed to be in equi-   response, fluorescence intensity, and large dynamic range,
librium with free NAD+ and NADH through the catalytic action of       and is very useful for the real-time tracking of subtle differences
lactate dehydrogenase (LDH). In cells stably expressing SoNar,        in cellular metabolic and redox states in vitro and in vivo.
exogenous pyruvate induced an instantaneous, up to 3-fold
decrease in the ratio of fluorescence with excitation at 420 and      SoNar-Based High-Throughput Screening for
485 nm, which then recovered slowly (Figures 2A, 2B, and              Compounds Affecting Cancer Cell Metabolism
S2B). Such effects of pyruvate were almost completely inhibited       To identify drugs that selectively target cancer cell metabolism,
by the monocarboxylate transporter inhibitor AR-C155858 or            we screened 23 libraries of > 5,500 unique compounds from
LDH inhibitor oxamate (Figure 2D). In control experiments,            commercial libraries according to their effects on the intracellular
fluorescence changes were significantly smaller for Frex and          NAD+/NADH redox state of H1299 cells reported by the SoNar
Peredox sensors, and occurred much more slowly for the Pere-          sensor (Figures 3A, 3B, and S3A; Table S2). An index was estab-
dox sensor (Figures S2B and S2C). The more rapid responses of         lished to describe the intracellular metabolic variation induced by
SoNar were due to the faster dissociation rate of the SoNar-          different compounds. While the majority of these compounds
NADH complex (Figure 1F). The LDH inhibitor oxamate                   have close to zero index and, therefore, minimal impact on
increased the ratio of SoNar’s fluorescence more effectively          SoNar fluorescence and the cellular NAD+/NADH redox state,
than lactate (Figures 2C, S2D, and S2E). When cells were treated      we did identify 78 compounds that significantly decreased
with pyruvate and oxamate simultaneously, the ratio of SoNar’s        the NAD+/NADH ratio in H1299 cells (index > 0.2, 1.4% of
fluorescence rapidly decreased initially, and then gradually          total library) and 12 compounds that significantly increased
increased similarly to that caused by oxamate alone (Figure 2C).      the NAD+/NADH ratio in H1299 cells (Figures 3B, 3C, and S3B;
These data suggest that pyruvate immediately increases the            Table S2). The majority of the compounds that increased (8 of
cellular NAD+/NADH ratio, while inhibition of LDH blocked             12) the NAD+/NADH ratio exhibited obvious H1299 cell toxicity
NAD+ recycling and gradually decreased the cellular NAD+/             (Figures 3C–3E, S3D, and S3E), while only a small fraction of
NADH ratio, consistent with previous reports (Le et al., 2010).       the compounds that decreased (9 of 78) the NAD+/NADH ratio

                                                                      Cell Metabolism 21, 777–789, May 5, 2015 ª2015 Elsevier Inc. 779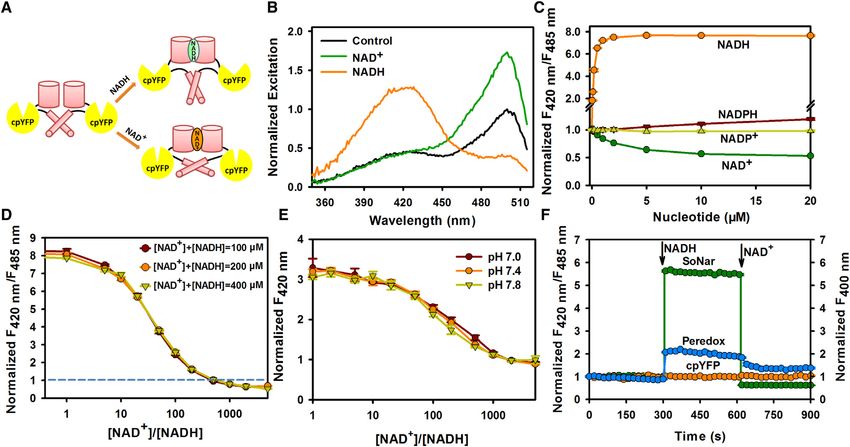
Figure 2. Imaging and Quantifying the NAD+/NADH Ratio in Living Cells and In Vivo
(A) Fluorescence images of SoNar or cpYFP-expressing cells before and immediately after incubation with 1 mM pyruvate. Images were pseudocolored with the
ratio of fluorescence excited at 425 nm and 482 nm. Scale bar, 10 mm.
(B) Kinetics of SoNar fluorescence responses in H1299 cells treated with exogenous pyruvate.
(C) Kinetics of SoNar fluorescence responses in H1299 cells treated with pyruvate, oxamate, or pyruvate and oxamate. Data were obtained with a fluorescence
plate reader.
(D) SoNar fluorescence responses in H1299 cells treated with pyruvate were blocked by AR-C155858 or oxamate. Data were normalized to samples without
pyruvate addition.
(E) NAD+/NADH ratio in different primary cell cultures and cell lines quantified according to SoNar fluorescence.
(F) Effect of oxamate, rotenone, and AOA on fluorescence ratios of different cells expressing SoNar. Cells were treated with inhibitors for 10 min. Green,
DFOxamate/DFRotenone; orange, DFRotenone/DFAOA.
(G and H) In vivo fluorescence imaging of H1299 xenografts expressing SoNar or cpYFP in response to intravenously administered pyruvate. Sequential frames of
fluorescence images of SoNar (G) or cpYFP (H) pseudocolored to the fluorescence ratio. Scale bar, 2 mm.
(I) Quantification of the NAD+/NADH ratio in H1299 xenografts according to the SoNar fluorescence data in (G) and (H); error bars represent SD. All experiments
performed in H1299 cells, and error bars represent SEM unless otherwise indicated. See also Figure S2.

exhibited obvious cell toxicity (Figures S3B and S3C). It is inter-              potent cancer cell cytotoxic compound, which decreased the
esting that three of eight of these compounds—b-lapachone,                       viability of a wide range of cancer cells of different origin at con-
shikonin, and fascaplysin—were potent, widely studied anti-                      centrations as low as 100 nM. Importantly, and by contrast, the
tumor agents. b-lapachone was known to affect cell metabolism                    compound showed low toxicity toward various primary cells
by redox cycling and consuming NAD(P)H (Pink et al., 2000),                      (Figures 3B, 3C, and 3G).
while shikonin was reported to inhibit pyruvate kinase M2
(Chen et al., 2011); however, as far as we are aware, the other                  KP372-1 Affects Tumor Metabolism and Suppresses
compounds have never been directly linked to energy meta-                        Tumor Growth In Vivo
bolism. Of particular note is the Akt inhibitor, also known as                   We then proceeded to study the effect of KP372-1 on tumor
KP372-1 (Figure 3F). This compound is not only the most potent                   metabolism in vivo. Pharmacokinetic studies after a single intra-
agent in increasing the NAD+/NADH ratio, but also the most                       venous or intragastric dose (Figure S4A) demonstrated that

780 Cell Metabolism 21, 777–789, May 5, 2015 ª2015 Elsevier Inc.
A                                               B                                                              C

D                                                                               E

 F                            G

Figure 3. SoNar-Based High-Throughput Screen for Compounds Affecting Cancer Cell Metabolism
(A) Schematic of the drug screen. H1299 cells expressing SoNar were incubated with compounds in 384-well plates for 4 min and fluorescence measured.
(B) Effects of 5,501 compounds on the index ratio, (ZCompound ZControl)/(ZOxamate ZPyruvate). The mean value and SD of the experimental population screened is
expressed as ZScores. Orange, low concentration; green, high concentration.
(C) The 12 lowest indexed hits that increase intracellular NAD+/NADH ratio and their effects on cell viability.
(D and E) Fluorescence images of H1299 cells expressing SoNar (D) or cpYFP (E) before and 4 min after treatment with different hit compounds (10 mM). Images
were pseudocolored with the ratio of fluorescence excited at 425 nm and 482 nm. Scale bar, 10 mm.
(F) Chemical structure of KP372-1.
(G) Effects of different concentrations of KP372-1 on the viability of 5 primary cell cultures and 21 cancer cells. All experiments were performed in H1299 cells
unless otherwise indicated. See also Figure S3 and Table S2.

KP372-1 has good bioavailability with relatively low clearance,                   versus vehicle (Figures 4D, 4E, and S4C). Staining sections of
a long half-life, and good volume of distribution (Table S3). In                  harvested xenografts revealed that KP372-1 reduced prolifera-
tumor-bearing mice in which H1299 cells stably expressing                         tion (Ki67 staining), increased caspase-3 activity, and induced
SoNar were s.c. implanted, administration of KP372-1 by tail                      apoptosis (TUNEL staining) (Figure S4D), consistent with in vitro
vein injection significantly decreased the ratio of SoNar fluores-                studies showing that KP372-1 increases apoptosis and cas-
cence with excitation at 420 and 490 nm in the tumor (Figures                     pase-3 activation in H1299 cells (Figures S4E–S4G). KP372-1-
4A and S4B), an effect that did not recover during the 1-hr time                  treated H1299 cells showed significant mitochondrial membrane
course of observation. As a control, minimal changes of fluores-                  permeabilization and enhanced Bax localization in mitochondria,
cence were observed in cpYFP-expressing tumor tissues with                        suggesting apoptosis occurred through a mitochondrial pathway
KP372-1 treatment (Figures 4B and S4B). These results suggest                     (Figures S4H and S4I). These characteristics of mitochondrial
that KP372-1 readily enters tumor tissue and induces persistent                   apoptosis also occurred in KP372-1-treated A549 cells, another
oxidation of NADH in cancer cells (Figure 4C).                                    non-small-cell lung cancer (NSCLC) cell line (Figures S4J–S4M).
  We next observed that KP372-1 profoundly suppressed the                            No toxic effects or other indicators of illness, including signif-
growth of the H1299 xenografts implanted s.c. into nude mice                      icant weight loss (Figure S4N) or tissue damage (macroscopic or

                                                                                 Cell Metabolism 21, 777–789, May 5, 2015 ª2015 Elsevier Inc. 781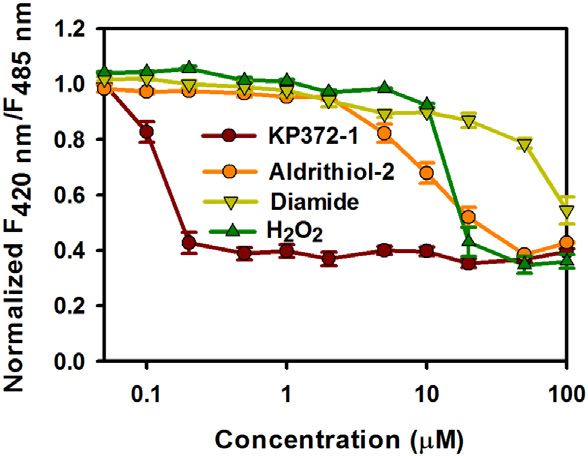
A                                                           B                                                                    C

D                                           E                                                      F

Figure 4. KP372-1 Induces NADH Oxidation and Impairs Tumor Growth In Vivo without Apparent Toxicity
(A and B) In vivo ratiometric fluorescence imaging of H1299 xenografts expressing SoNar (A) or cpYFP (B) in response to KP372-1. Images were pseudocolored
with the ratio of fluorescence excited at 420 nm and 490 nm. Scale bar, 2 mm.
(C) Quantification of the NAD+/NADH ratio in H1299 xenografts according to SoNar fluorescence. Error bars represent SD.
(D) H1299 tumor-growth curves of untreated or KP372-1-treated mice. Error bars denote SEM (n = 8 in each group).
(E) Photographs of tumors after dissection at day 33.
(F) H&E staining for the indicated tissues in animals treated with vehicle, 10 mg/kg KP372-1, or 20 mg/kg KP372-1 daily for 33 days. See also Figure S4 and
Table S3.

microscopic), were observed in these mice. Pathological review                 tive effects over time. Metabolomic studies validated the
of sections and an apoptosis assay of heart, liver, lung, and kid-             decrease of NADH level and increase of NAD+ level. KP372-1
ney also showed no signs of cytotoxicity (Figures 4F and S4P).                 also markedly lowered glutathione (GSH) levels and elevated
The results of blood, liver, and kidney function tests were also               NADP+ and oxidized GSH (GSSG) levels (Figures 5B and
normal (Figure S4O). These studies suggest the safety of                       S5G). Although NADPH was not identified in the metabolomic
KP372-1 for use as anticancer therapy.                                         analysis, conventional biochemical assay showed that cellular
                                                                               NADPH levels decreased 4.5-fold, whereas NADP+ levels
KP372-1 Induces Significant Oxidative Stress and                               increased 4.5-fold after 5 min of KP372-1 treatment (Figures
Activates the Pentose Phosphate Pathway                                        5C and 5D).
We performed metabolomic analysis to gain insight into how                        The dose-dependent effects of KP372-1 on intracellular
KP372-1 affected cancer cell metabolism, and identified 269                    NADH, H2O2, and disulfide redox state were further explored
metabolites of known identity (Figures 5A and S5A; Table S4).                  by genetically encoded sensors, including SoNar, Hyper (Belou-
Most prominently, many intermediates in the pentose phos-                      sov et al., 2006), and roGFP1 (Dooley et al., 2004). KP372-1
phate pathway (PPP) increased 7- to 8-fold at 5 min and sus-                   induced significant oxidative stress via oxidizing NADH, gener-
tained these elevations at 60 min in response to KP372-1                       ating H2O2, and oxidizing thiols to disulfides, respectively, two
(Figure 5A; Table S4). There were minimal changes in the levels                to three orders of magnitude more efficiently than H2O2 or thiol
of glycolytic metabolites, including lactate, in response to                   oxidants, such as aldrithiol-2 and diamide (Figures 5E–5G,
KP372-1, with the exception of a precipitous decrease of fruc-                 S5H–S5J, S5L, and S5M). In controls, none of these compounds
tose-1,6-diphosphate (Figure 5A; Table S4). Biochemical anal-                  affected the fluorescence of cpYFP-expressing cells (Fig-
ysis of cell culture medium and cell lysate indicated that both                ure S5K). Kinetic studies showed that the decrease of NADH
intracellular and extracellular lactate production remained                    occurred immediately after KP372-1 addition, followed by
constant (Figures S5C and S5F), again suggesting that direct                   H2O2 production and then thiol oxidation (Figure S5N). Overall,
perturbation of glycolysis was not significant. Biochemical anal-              these results suggest that KP372-1 has a prominent impact on
ysis showed that both intracellular and extracellular pyruvate                 cellular redox state with NAD(P)H oxidation being the vanguard
increased significantly in response to KP372-1 treatment (Fig-                 event. Oxidative stress is necessary for KP372-1-induced cell
ures S5B and S5E), consistent with the increased cytosolic                     death, which was largely blocked by overexpressing catalase
NAD+/NADH ratio (Figure S5D). For metabolites involved in the                  in the cell, or by treating the cell with N-acetylcysteine, a general
TCA cycle, a-ketoglutarate and succinate increased at 5 min                    antioxidant, or Tiron, a cell-permeable superoxide scavenger
and further increased by 60 min (Figure 5A), suggesting cumula-                (Figures S5O and S5P).

782 Cell Metabolism 21, 777–789, May 5, 2015 ª2015 Elsevier Inc.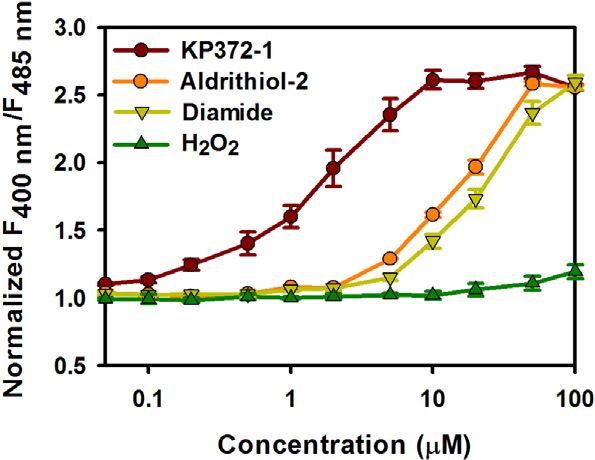
A
B C D
E F G
Figure 5. KP372-1 Induces Significant Oxidative Stress and Activates the Pentose Phosphate Pathway
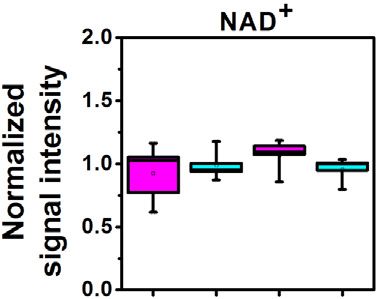
(A) Metabolite profiles of KP372-1-treated cells shown as a heatmap. Increased metabolite concentrations are shown in red, whereas decreased metabolite
concentrations are shown in green. H1299 cells were treated with 5 mM KP372-1 for 5 min and 60 min, respectively.
(B) KP372-1-induced oxidation of intracellular NADH and GSH. Data obtained by metabolomic studies as in (A) (n = 5 in each group). ***p < 0.001. NS, not
significant.
(C and D) Intracellular NADP+ (C) and NADPH (D) levels with or without 5 mM KP372-1 in H1299 cells. Data obtained by a single extraction method and in vitro
biochemical assay (n = 5 in each group). ***p < 0.001. NS, not significant.
(E–G) Fluorescence responses of cells expressing SoNar (E), Hyper (F), and roGFP1 (G) to different concentrations of KP372-1 and other oxidants. Fluorescence
was measured immediately after chemical addition and normalized to the control condition. All experiments were performed in H1299 cells; error bars represent
SEM. See also Figure S5 and Table S4.
NQO1 Catalyzes NAD(P)H-Dependent KP372-1 Redox macologic inhibitors of NAD(P)H oxidase, ENOX1, ENOX2,
Cycling and Promotes Cancer Cell Death NQO2, mitochondrial respiratory chain complex I, xanthine oxi-
We considered that KP372-1 may activate NAD(P)H-dependent dase, and nitric oxide synthase showed minimal effects on
reactive oxygen species (ROS)-generating enzymes in view of its KP372-1-induced oxidative stress and cell death (Figures 6B
potency in inducing oxidative stress, and explored the functions and S6B). Consistent with the SoNar measurement, data calcu-
of such oxidases by overexpressing them in H1299 cells (Figures lated from the measured concentrations of the pyruvate and
6A, S6A, and S6F). We found that only overexpression of NQO1 lactate, and the equilibrium constants of LDH (Williamson
boosted KP372-1’s effects on intracellular NADH oxidation, et al., 1967), also showed that cytosolic NAD+/NADH ratio was
H2O2 production, thiol oxidation, and cell death (Figures 6A, dose-dependently increased in the cells treated with KP372-1,
S6A, and S6C). NQO1 is a promising therapeutic target in cancer which is promoted by NQO1 expression (Figure S6E) or
therapy and highly expressed in many cancer cell lines (Bey repressed by the NQO1 inhibitor dicoumarol (Figure S6G). We
et al., 2007; Cullen et al., 2003; Pink et al., 2000), including the next generated isogenic, NQO1 knockout A549 cell lines using
A549 NSCLC cell line (Bey et al., 2007) (Figure S6H). In A549 the CRISPR-Cas9 system (Cong et al., 2013; Ran et al., 2013).
cells, KP372-1-induced oxidative stress and cell death were These NQO1 knockout lines, confirmed by sequencing and
largely inhibited by dicoumarol, a known inhibitor of NQO1 western blotting, were much more resistant to oxidative stress
(Pink et al., 2000) (Figures 6B, S6B, and S6D). In contrast, phar- and cell death induced by KP372-1 (Figures 6C–6G and S6I).
Cell Metabolism 21, 777–789, May 5, 2015 ª2015 Elsevier Inc. 783
(legend on next page)
784 Cell Metabolism 21, 777–789, May 5, 2015 ª2015 Elsevier Inc.
Similarly, these NQO1 knockout lines were also much more were treated with different Akt inhibitors (Figures S6Q–S6T).
resistant to oxidative stress and cell death induced by b-lapa- Surprisingly and in contradistinction to previous reports that
chone (Figure S6J), another hit compound in our screen (Figures KP372-1 inhibited Akt phosphorylation in cancer cells (Koul
3B and 3C) and an anti-tumor agent known to target to NQO1 et al., 2006; Mandal et al., 2005, 2006; Zeng et al., 2006), we
(Bey et al., 2007; Pink et al., 2000). Interestingly, the only two found that KP372-1 treatment dramatically, transiently, and
cancer cell lines resistant to KP372-1 toxicity in this study, dose-dependently increased phosphorylation of Akt in A549
MDA-MB-231 cells and H596 cells, were also NQO1 negative and H1299 cells (Figures 6G and S6U), which was not signifi-
(Figures 6H and 6I), while the killing effects of KP372-1 on other cantly affected by NQO1 inhibition or NQO1 knockout (Fig-
cancer cell lines expressing NQO1 were effectively attenuated ure 6G). Such enhanced Akt phosphorylation induced by
by dicoumarol (Figures 6H and 6I). b-lapachone showed a similar KP372-1 also occurred to varying extents in other cancer cell
cytotoxicity profile as KP372-1 and was similarly antagonized by lines irrespective of their NQO1 expression level (Figure 6H).
dicoumarol (Figure S6K). These data showed that KP372-1’s action on NAD+/NADH
It is known that a subset of NSCLC cell lines and tumors exhibit redox, oxidative stress, and viability of cancer cells was not
KEAP1 mutations which activate NRF2 (Dai et al., 2013; Singh due to the inhibition of this kinase.
et al., 2006). In these cells NRF2 then induces expression of NQO1 is a NAD(P)H-dependent oxidoreductase that cata-
NQO1, as well as a palette of antioxidant genes (Gorrini et al., lyzes the 2-electron reduction of a broad range of quinones.
2013; Sporn and Liby, 2012; Thimmulappa et al., 2002). In b-lapachone was previously reported to exert its anti-tumor
KEAP wild-type cells, there is a good correlation between the function by ‘‘bioactivation’’ by NQO1 to an unstable hydroqui-
cytotoxicity of KP372-1 and NQO1 expression (Figures S6L none that rapidly undergoes a two-step oxidation back to the
and S6M). In KEAP1 mutant cells, however, there is no clear cor- parent compound, perpetuating a futile redox cycle and gener-
relation between the cytotoxicity of KP372-1 and the KEAP ating superoxide in the process (Pink et al., 2000; Reinicke
mutation (Figures S6L and S6M), suggesting the effects of over- et al., 2005). We found that NAD(P)H was rapidly oxidized in
expressed NQO1 may be counterbalanced by the enhanced the presence of both KP372-1 and trace amounts of NQO1
antioxidant mechanism (Figures S6N and S6O). in vitro, monitored by either NAD(P)H endogenous fluorescence
The role of NQO1 in KP372-1 toxicity is further supported by (Figures 6P and S6V) or SoNar (Figure S6W). The oxidation of
in vivo data, which showed that the growth of the A549 xeno- NADH was accompanied by oxygen consumption (Figure 6Q)
grafts was significantly suppressed by KP372-1 compared with and generation of superoxide and hydrogen peroxide (Figures
vehicle (Figures 6J and 6K). In contrast, the growth of NQO1 6R and S6X). In these studies, greater than 1,000 molar
knockout A549 xenografts was not suppressed by KP372-1 equivalents of NADH were oxidized per molar equivalent of
compared with vehicle (Figures 6L and 6M). Similarly, growth KP372-1 in 30 min (Figure 6P), suggesting that KP372-1 under-
of NQO1 knockout H1299 xenografts was much less suppressed went NQO1-dependent redox cycling. In H1299 cells, oxygen
by KP372-1 (Figures 6N, 6O, and S6P) compared to wild-type consumption also significantly increased in the presence
H1299 xenografts (Figures 4D, 4E, and S4C). of KP372-1, which further increased with overexpression of
KP372-1 is known to inhibit Akt kinase (Koul et al., 2006; Man- NQO1 (Figure S6Y). Taken together, our findings provide evi-
dal et al., 2005, 2006; Zeng et al., 2006). Interestingly, our data dence that NQO1-mediated futile redox cycling of KP372-1
showed that the effects of KP372-1 on the fluorescence of (Figure 6S) induced oxidative stress and cell death in cancer
SoNar or roGFP1 were absent when A549 and H1299 cells cells.
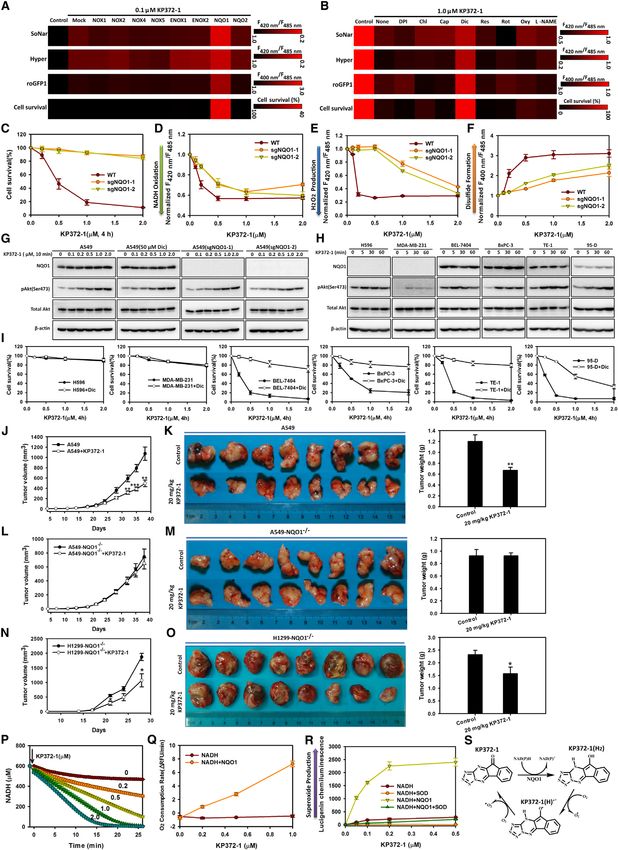
Figure 6. NQO1 Catalyzes NAD(P)H-Dependent KP372-1 Redox Cycling and Promotes Cancer Cell Death
(A) Overexpression of NQO1, but not other NAD(P)H oxidases, increases KP372-1-induced NADH oxidation, H2O2 production, thiol oxidation, and cell death in
H1299 cells.
(B) The NQO1 inhibitor dicoumarol, but not other pharmacologic inhibitors of ROS-generating enzymes, decreases KP372-1-induced NADH oxidation, H2O2
production, thiol oxidation, and cell death in A549 cells. For (A) and (B), after cells were treated with KP372-1, SoNar fluorescence was measured immediately,
while Hyper and roGFP1 fluorescence were measured after 10 min.
(C–F) Knockout of NQO1 decreased KP372-1-induced cell death (C), NADH oxidation measured by SoNar fluorescence (D), H2O2 production measured by Hyper
fluorescence (E), and thiol oxidation measured by roGFP1 fluorescence (F) in A549 cells.
(G) The effect of NQO1 inhibitor dicoumarol or NQO1 knockout on KP372-1-induced phosphorylation of Akt in A549 cells. Cells were treated with different
concentrations of KP372-1 for 10 min.
(H) Phosphorylation of Akt in different cells treated with 0.5 mM KP372-1 at the indicated times.
(I) The effect of NQO1 inhibitor dicoumarol on KP372-1-induced cell death. Cells were exposed to a 4-hr pulse of KP372-1 either with or without 50 mM dicoumarol
and then grown for 24 hr.
(J–O) The effects of KP372-1 on tumor growth of WT A549 (J and K), NQO1 knockout A549 (L and M), and NQO1 knockout H1299 (N and O) xenografts. Tumor-
growth curves (J, L, and N) were measured in untreated or KP372-1-treated mice; error bars denote SEM (n = 8 in each group). Xenografts were dissected at day
38 (K and M) or day 28 (O), photographed (left), and weighted (right). Error bars indicate SEM.
(P) NQO1-catalyzed NADH oxidation in the presence of different concentrations of KP372-1. NADH was measured by its endogenous fluorescence. The con-
centrations of KP372-1 are indicated adjacent to each curve.
(Q) Oxygen consumption of NADH solution (600 mM) in the presence or absence of 1 mg/ml NQO1 and different concentrations of KP372-1. Oxygen levels were
measured with a BD Oxygen Biosensor System.
(R) Superoxide production by a lucigenin chemiluminescence assay in an assay solution containing 600 mM NADH and KP372-1, in the presence or absence of
1 mg/ml NQO1 and/or 30 U/ml superoxide dismutase.
(S) Hypothetical model for KP372-1-mediated redox cycling. Error bars represent SEM. See also Figure S6.
Cell Metabolism 21, 777–789, May 5, 2015 ª2015 Elsevier Inc. 785DISCUSSION NAD+/NADH ratio had not been rigorously quantified due to
lack of appropriate quantitative non-invasive methodology. By
The SoNar sensor described herein represents a substantial monitoring SoNar’s fluorescence, we provide direct evidence
improvement for live cell NAD+/NADH measurement over exist- that the cytosolic NAD+/NADH ratio is significantly reduced in
ing reporters. First, SoNar fluorescence is intrinsically ratiometric certain cancer cell lines, such as H1299, U87, and MDA-MB-
with two excitation wavelengths having opposing responses to 468. Further dissection of the metabolic pathways governing
NAD+ and NADH, allowing quantitative determination of NAD+ this ratio using enzyme inhibitors showed that these cancer cells
or NADH separately as well as ratiometrically. To our knowledge, were able to utilize low levels of glucose and exhibit high glyco-
such a dual-response property is unprecedented among genet- lytic activity, consistent with a previous report that H1299 cells
ically encoded sensors developed to date. In addition to its role overexpress pyruvate kinase M2 and display high rates of glycol-
in energy metabolism, NAD+ also participates in a wide range of ysis (Christofk et al., 2008). For reference, we attach a diagram
cellular processes, acting as precursor of signaling molecules that explains the central role NAD+/NADH plays in relevant
such as cADPR and ADPR, and as a co-substrate of regulatory metabolic pathways in this study (Figure S2K).
enzymes of significant importance, such as mono- or poly- The intense fluorescence and large dynamic range of SoNar
ADP-ribose polymerases and Sirt family deacylases. Many of enabled its usage in robust high-throughput and real-time
these enzymes are also important targets for drug discovery. screening assays of small-molecule libraries that may affect
SoNar is capable of reporting NAD+ levels directly in vitro inde- cellular metabolism, which may be useful as probes for meta-
pendent of NADH, and can be utilized in simple, continuous bolic studies and as lead compounds for drug discovery. In
enzymatic assays, which may be amenable to high-throughput contrast to many other high-throughput assays in drug discovery
screening. Second, SoNar is an authentic reporter of the that target a single protein or enzyme, SoNar is multi-targeted as
NAD+/NADH ratio under physiological conditions. SoNar had it is capable of reporting subtle perturbations in many pathways
an apparent Kd of 5.0 mM for NAD+, much lower than intracel- affecting energy metabolism, including glycolysis and mito-
lular NAD+ concentration, allowing the sensor to report the chondrial respiration. Furthermore, the rapid response and
NAD+/NADH ratio under physiological conditions accurately un- high sensitivity greatly reduce the costs of and time needed for
affected by the total NAD(H) pool. By contrast, the Frex sensor screening. Most of the compounds that we screened did not
reports only NADH levels, while Peredox reports the cytosolic affect intracellular NAD+ redox states; however, protein kinase
NADH level, partly compensated by the NAD+ level, rather than inhibitor and phosphokinase inhibitor libraries had a significant
the precise NAD+/NADH ratio (Hung et al., 2011). Third, SoNar percentage of hits, highlighting the regulatory roles of protein
displays a superior rapid response and large dynamic range, phosphorylation in cell metabolism. It is interesting that quite a
and is very useful for the real-time tracking of subtle differences few compounds among FDA-approved drugs and the NIH clin-
in cellular metabolic states. SoNar displays a 1,500% fluores- ical collection also affect cellular metabolism. Further analysis
cence change under different NAD+/NADH ratios in vitro, almost may help to identify whether the effects of these drugs on meta-
10-fold greater than that of Peredox and 2-fold greater than that bolism are related to their anti-tumor mechanism and efficacy.
of Frex, making it one of the most responsive genetic-encoded It is also interesting that only a small fraction of compounds
sensors currently available. SoNar responded well to conven- that decrease the NAD+/NADH ratio exhibited obvious cytotox-
tional metabolic perturbations such as extraneous glucose, py- icity, whereas the majority of the compounds that increase the
ruvate, and lactate supplementation, or inhibition of energy NAD+/NADH ratio exhibited obvious cancer cell toxicity, among
metabolism pathways such as mitochondrial respiration, the which b-lapachone, shikonin, and fascaplysin were potent,
mitochondrial NADH shuttle, glycolysis, and LDH. In live cell widely studied anti-tumor agents. Consistent with their effects
studies, the sensor displayed an 8-fold dynamic range, and on their NAD+/NADH ratio as reported by the SoNar sensor,
was able to detect the response to added pyruvate as low as b-lapachone is known to be reduced by NQO1, which then en-
5 mM, substantially outperforming either Frex or Peredox sen- ters into futile cycling, consumes NAD(P)H, and generates
sors. SoNar also performed nicely in in vivo imaging studies, ex- superoxide, while shikonin inhibits cancer cell glycolysis by tar-
hibiting intense fluorescence and the ability to detect increases geting tumor pyruvate kinase M2 (Chen et al., 2011). The other
or decreases in NAD+/NADH levels within normal physiological compounds identified were not previously linked to cellular
conditions. Our study showed that Peredox was not able to metabolism. The most potent compound that increases the
detect the decrease in the NAD+/NADH ratio when cells were NAD+/NADH ratio and the most potent selective cancer-killing
treated with lactate or an LDH inhibitor, as it was almost fully compound, KP372-1, was previously reported to exert inhibitory
saturated by NADH in cells in the presence of 1 mM glucose effects on PDK1/Akt signaling pathways, suppressing cell prolif-
(Hung et al., 2011). This deficiency complicates Peredox’s usage eration and inducing/sensitizing cells to apoptosis (Koul et al.,
for in vivo imaging, considering the normal range of blood 2006; Mandal et al., 2005, 2006; Zeng et al., 2006). Intriguingly,
glucose concentration. we found that the compound actually enhanced Akt phosphory-
Various studies suggested that the intracellular NAD+/NADH lation, contradictory to previous reports, and that various spe-
pool is greatly reduced in many cancer cells compared to non- cific Akt inhibitors had no significant impact on the NAD+/
cancer cells, inferred by the lower lifetime of NADH endogenous NADH redox level. KP372-1 induced significant oxidative stress
fluorescence and increased mitochondrial free NADH, or lower as shown by NAD(P)H depletion, H2O2 generation, and thiol
ratio of the fluorescence intensity of FAD-to-NADH (Ostrander oxidation. The PPP was activated to replenish NADPH for antiox-
et al., 2010; Pradhan et al., 1995; Skala et al., 2007; Yu and idant enzyme catalysis. Further genetic and chemical screening
Heikal, 2009); however, to our knowledge, the intracellular showed that KP372-1 was reduced by NQO1 in the presence of
786 Cell Metabolism 21, 777–789, May 5, 2015 ª2015 Elsevier Inc.NAD(P)H, which enters into a futile redox cycle and generates inhibitor. Further studies on KP372-1 and its analogs might
superoxide; its anti-tumor activity was blocked by a specific lead to therapeutic options for drug-resistant cancers. With the
NQO1 inhibitor or in isogenic NQO1 knockout cells. These data help of the SoNar sensor, we also identified many other com-
show that KP372-1’s action on NAD+/NADH redox, oxidative pounds, including clinically used drugs that affect cellular
stress, and viability of cancer cells was due to NQO1-mediated metabolism. Although not investigated in this study owing to
futile redox cycling, and not the inhibition of Akt signaling. Kinase practical considerations of time, effort, and compound availabil-
inhibitors have been very popular for dissecting signal transduc- ity, it is possible that the clinical benefits of these drugs are less
tion pathways and drug discovery. Although investigators are attributable to their reported targets or mechanism of action
aware that inhibition of an off-target kinase may contribute to and, perhaps, more likely a consequence of effects on cellular
the observed biological effects of these inhibitors, the results re- metabolism.
ported here provide an interesting example that a distinct redox
enzyme and mechanism are responsible for the selective cancer EXPERIMENTAL PROCEDURES
cell-killing effects of a well-known kinase inhibitor, rather than
kinase inhibition itself. NQO1 was highly expressed in numerous Please see the Supplemental Experimental Procedures for additional details.
All procedures involving animals were approved by the Institutional Animal
cancer cells (Bey et al., 2007; Cullen et al., 2003; Pink et al.,
Care and Use Committee of Shanghai.
2000). b-lapachone, an anti-tumor agent containing the quinone
pharmacophore, can kill cancer cells overexpressing NQO1 Gene Construction and Protein Characterization
regardless of cell cycle phase or p53 status. The quinone phar- Gene construction and characterization of SoNar in vitro are described in
macophore is particularly common in anti-tumor drugs, such Supplemental Experimental Procedures.
as mitomycin C, b-lapachone, and 17-N-allylamino-17-deme-
thoxygeldanamycin 17-AAG (Siegel et al., 2012). Unlike these Live Cell Fluorescence Measurement Using Microplate Reader
Cells were harvested by trypsinization and counted by hemocytometer. Cells
compounds, KP372-1 does not contain a quinone pharmaco-
were washed and suspended in PBS (HyClone), and aliquots of cells were
phore. In view of the NQO1-catalyzed redox cycling of b-lapa- incubated at 37 C with different compounds during the measurement. Dual-
chone (Pink et al., 2000; Reinicke et al., 2005), we speculate excitation ratios were obtained by a Synergy 2 Multi-Mode Microplate Reader
the possible reaction mechanism of KP372-1, NAD(P)H, and (BioTek). Detailed procedures can be found in the Supplemental Experimental
NQO1 as follows (Figure 6S): KP372-1 contains a quinone mimic Procedures.
and can be reduced to the ‘‘hydro’’ form by NAD(P)H via a
2-electron reduction catalyzed by NQO1. The hydro form is pre- Fluorescence Microscopy
For fluorescence microscopy, H1299-SoNar-, H1299-cpYFP-, H1299-Hyper-,
sumably unstable and spontaneously auto-oxidizes to its original
and H1299-roGFP1-expressing cells were plated on a 35-mm glass-bottom
parent form, probably through an intermediate (KP372-1(H).-), dish with phenol red-free growth medium. Images were acquired using a
which consumes oxygen and generates superoxide. This redox high-performance fluorescent microscopy system equipped with Nikon
cycling causes rapid and profound oxidation of NAD(P)H. Eclipse Ti-E automatic microscope, monochrome cooled digital camera
Most current NQO1 substrates developed for cancer therapy head DS-Qi1 Mc-U2, and the highly stable Sutter Lambda XL light source.
have problems in pharmacokinetics, tolerability, delivery, and Raw data were exported to ImageJ software as 12-bit TIF for analysis. Detailed
procedures can be found in the Supplemental Experimental Procedures.
bioavailability. For example, b-lapachone suffers from poor
aqueous solubility and a short half-life in vivo (20 min), which
Imaging NADH Metabolism in Living Animals
necessitates the use hydroxypropyl-b-cyclodextrin (HPbCD) as H1299-SoNar- and H1299-cpYFP-expressing cells (10 3 106) suspended in
a solubility aid at the doses poorly tolerated (Bair, 2012; Blanco 0.1 ml serum-free RPMI1640 with an equal volume of BD Matrigel Matrix
et al., 2010; Huang et al., 2012). We reasoned that KP372-1 (BD Biosciences, 356237) were inoculated s.c. in the right axilla of each
could be a better candidate in future NQO1-dependent chemo- mouse. When tumor size reached 0.6–1.2 cm in diameter, mice were anesthe-
therapies, as it is one magnitude more potent than b-lapachone; tized intraperitoneally with sodium pentobarbital (100 mg/kg body weight),
placed in a holding chamber, and given an intravenous tail vein injection
is capable of being administered orally; has a long half-life, large
with 100 mM sodium pyruvate (Invitrogen) or 600 mM KP372-1 (Echelon Biosci-
volume of distribution, and excellent bioavailability; and is very ences) suspended in 0.9% NaCl in a total volume of 0.3 ml. The dual-excitation
well tolerated by mice at the doses required to detect a signifi- ratio imaging in tumor tissues expressing SoNar or cpYFP was obtained by a
cant anticancer effect. By in vivo imaging of tumor metabolism Kodak Multispectral FX imaging system (Carestream Molecular Imaging) with
using the SoNar sensor, we also demonstrated that KP372-1 excitation filters 420 BP 20 nm and 490 BP 20 nm, and an emission filter 535
enters the tumor rapidly. Furthermore, identification of a non- BP 50 nm (for both excitation wavelengths).
quinone redox cycling agent like KP372-1 expands our scope
Chemical Screen and Analysis
and understanding of NQO1 and redox cycling agents. These
All screened compounds were purchased from the National Compounds
compounds and their analogs can be further modified and inves- Resource Center (China) as stock solutions in DMSO. The majority of the com-
tigated to develop better anti-tumor drugs. pounds were arrayed in 96-well plates and diluted to 3 mM or 30 mM with PBS
In summary, we report that SoNar is a superior tool for tracking containing 25 mM glucose. We then transferred 25-ml chemical solutions from
the intracellular NAD+/NADH redox state and, therefore, subtle 96-well plates into black 384-well flat-bottom plates (Greiner Bio-One,
changes in cell metabolic status, as it is intensely fluorescent, Germany) using an eight-channel pipette and then immediately added 50 ml
is intrinsically ratiometric, and has a large dynamic range. These H1299-SoNar-expressing cell suspensions into each well using an eight-chan-
nel electronic pipette (50–1,250 ml), resulting in 1-mM and 10-mM final concen-
properties make it an ideal reagent for metabolic studies and
trations for most compounds. Each plate contained the following control wells:
drug discovery in cells or animals. Interestingly, we identified a four to eight wells DMSO-only control, two to four wells controls with 1 mM
potent NQO1-activated redox cycling and anti-tumor agent, pyruvate, and two to four wells controls with 5 mM oxamate. Fluorescence
KP372-1, which was previously used as (believed to be) an Akt intensity was measured immediately by a Synergy 2 Multi-Mode Microplate
Cell Metabolism 21, 777–789, May 5, 2015 ª2015 Elsevier Inc. 787Reader (BioTek) with 420-nm or 485-nm excitation and 528-nm emission Belousov, V.V., Fradkov, A.F., Lukyanov, K.A., Staroverov, D.B., Shakhbazov,
wavelengths. Analysis of screening data is described in Supplemental Exper- K.S., Terskikh, A.V., and Lukyanov, S. (2006). Genetically encoded fluorescent
imental Procedures. The I value for every compound performed in our screen indicator for intracellular hydrogen peroxide. Nat. Methods 3, 281–286.
can be found in Table S2. Bey, E.A., Bentle, M.S., Reinicke, K.E., Dong, Y., Yang, C.R., Girard, L., Minna,
J.D., Bornmann, W.G., Gao, J., and Boothman, D.A. (2007). An NQO1- and
Metabolomics Analysis PARP-1-mediated cell death pathway induced in non-small-cell lung cancer
The metabolomic analysis was performed by Metabolon (Durham). Detailed cells by beta-lapachone. Proc. Natl. Acad. Sci. USA 104, 11832–11837.
procedures can be found in the Supplemental Experimental Procedures.
Blanco, E., Bey, E.A., Khemtong, C., Yang, S.G., Setti-Guthi, J., Chen, H.,
Kessinger, C.W., Carnevale, K.A., Bornmann, W.G., Boothman, D.A., and
Xenograft Studies
Gao, J. (2010). Beta-lapachone micellar nanotherapeutics for non-small cell
To test the anti-tumor activity of KP372-1 in vivo, nude mice (nu/nu, male 6- to
lung cancer therapy. Cancer Res. 70, 3896–3904.
8-week-old, Shanghai SLAC Laboratory Animal Co.) were injected s.c. with
5 3 106 cells. Animals were divided randomly into control (vehicle), Cairns, R.A., Harris, I.S., and Mak, T.W. (2011). Regulation of cancer cell
10 mg/kg prevention, or 20 mg/kg prevention groups of eight each. Treatment metabolism. Nat. Rev. Cancer 11, 85–95.
was performed once daily by intragastric administration of KP372-1. Tumor Chen, J., Xie, J., Jiang, Z., Wang, B., Wang, Y., and Hu, X. (2011). Shikonin and
formation was assessed every 2–3 days with calipers in all the groups. After its analogs inhibit cancer cell glycolysis by targeting tumor pyruvate kinase-
4–6 weeks, the tumors were dissected and weighed. M2. Oncogene 30, 4297–4306.
Christofk, H.R., Vander Heiden, M.G., Harris, M.H., Ramanathan, A., Gerszten,
Statistical Analysis R.E., Wei, R., Fleming, M.D., Schreiber, S.L., and Cantley, L.C. (2008). The M2
Data are presented either as a representative example of a single experi- splice isoform of pyruvate kinase is important for cancer metabolism and
ment repeated at least in triplicate or as three or more experiments. Data tumour growth. Nature 452, 230–233.
obtained are represented as mean values ± SD or mean values ± SEM. All Cong, L., Ran, F.A., Cox, D., Lin, S., Barretto, R., Habib, N., Hsu, P.D., Wu, X.,
p values were obtained using unpaired two-tailed Student’s t test. Values of Jiang, W., Marraffini, L.A., and Zhang, F. (2013). Multiplex genome engineering
p < 0.05 were considered statistically significant (*p < 0.05, **p < 0.01, and using CRISPR/Cas systems. Science 339, 819–823.
***p < 0.001).
Cullen, J.J., Hinkhouse, M.M., Grady, M., Gaut, A.W., Liu, J., Zhang, Y.P.,
Weydert, C.J., Domann, F.E., and Oberley, L.W. (2003). Dicumarol inhibition
SUPPLEMENTAL INFORMATION
of NADPH:quinone oxidoreductase induces growth inhibition of pancreatic
cancer via a superoxide-mediated mechanism. Cancer Res. 63, 5513–5520.
Supplemental Information includes six figures, four tables, and Supplemental
Experimental Procedures and can be found with this article online at http://dx. Dai, B., Yoo, S.Y., Bartholomeusz, G., Graham, R.A., Majidi, M., Yan, S., Meng,
doi.org/10.1016/j.cmet.2015.04.009. J., Ji, L., Coombes, K., Minna, J.D., et al. (2013). KEAP1-dependent synthetic
lethality induced by AKT and TXNRD1 inhibitors in lung cancer. Cancer Res.
73, 5532–5543.
AUTHOR CONTRIBUTIONS
Dooley, C.T., Dore, T.M., Hanson, G.T., Jackson, W.C., Remington, S.J., and
Y.Y. and Q.H. designed the sensor, and Y.Y. and Y. Zhao designed the in vitro Tsien, R.Y. (2004). Imaging dynamic redox changes in mammalian cells with
and in vivo imaging, metabolic screening, and target identification experi- green fluorescent protein indicators. J. Biol. Chem. 279, 22284–22293.
ments. Y. Zhao, Q.H., N.S., A.W., and Y. Zou performed experiments. F.C., Gorrini, C., Harris, I.S., and Mak, T.W. (2013). Modulation of oxidative stress as
H.H., X.C., H.-M.Z., X.H., K.Y., Q.Z., X.W., J.Y., L.Z., X.Q., L.C., and Y.T. an anticancer strategy. Nat. Rev. Drug Discov. 12, 931–947.
gave technical support and conceptual advice. Y.Y., Y. Zhao, and J.L. Huang, X., Dong, Y., Bey, E.A., Kilgore, J.A., Bair, J.S., Li, L.S., Patel, M.,
analyzed the data and wrote the manuscript. Parkinson, E.I., Wang, Y., Williams, N.S., et al. (2012). An NQO1 substrate
with potent antitumor activity that selectively kills by PARP1-induced pro-
ACKNOWLEDGMENTS grammed necrosis. Cancer Res. 72, 3038–3047.
Hung, Y.P., Albeck, J.G., Tantama, M., and Yellen, G. (2011). Imaging cytosolic
We thank Gary Yellen for the Peredox vector; Jim Remington for the roGFP
NADH-NAD(+) redox state with a genetically encoded fluorescent biosensor.
vector; Jiahuai Han for the cDNA of Enox and Nox families; Hongbin Ji,
Cell Metab. 14, 545–554.
Jianwen Liu, Jing Zheng, Ping Shi, Xuni Cao, Zhaoyang Ye, and Jia Yu for
different cell lines; Guiping Li, Qiongyu Yan, Chunyuan Zhou, Qiuning Lin, Koul, D., Shen, R., Bergh, S., Sheng, X., Shishodia, S., Lafortune, T.A., Lu, Y.,
Lei Xu, Rongkun Tao, Jianhua Wang, Zhengda Chen, and Wei Wang for de Groot, J.F., Mills, G.B., and Yung, W.K. (2006). Inhibition of Akt survival
technical assistance; and Stephanie Tribuna for secretarial assistance. This pathway by a small-molecule inhibitor in human glioblastoma. Mol. Cancer
work was supported by the 973 Program (2013CB531200), NSFC Ther. 5, 637–644.
(91313301, 31225008, 31071260, 31170815, 31470833, and 91013012), Le, A., Cooper, C.R., Gouw, A.M., Dinavahi, R., Maitra, A., Deck, L.M., Royer,
Specialized Research Fund for the Doctoral Program of Higher Education R.E., Vander Jagt, D.L., Semenza, G.L., and Dang, C.V. (2010). Inhibition of
(20100074110010), Shanghai Science and Technology Commission lactate dehydrogenase A induces oxidative stress and inhibits tumor progres-
(12JC1402900, 11DZ2260600, 15YF1402600), Dawn Program of the Shanghai sion. Proc. Natl. Acad. Sci. USA 107, 2037–2042.
Education Commission (11SG31), State Key Laboratory of Bioreactor Engi- Mandal, M., Kim, S., Younes, M.N., Jasser, S.A., El-Naggar, A.K., Mills, G.B.,
neering, the 111 Project (B07023), and the Fundamental Research Funds for and Myers, J.N. (2005). The Akt inhibitor KP372-1 suppresses Akt activity and
the Central Universities, as well as NIH grants (to J.L.) HL061795, cell proliferation and induces apoptosis in thyroid cancer cells. Br. J. Cancer
HL048743, and HL108630. 92, 1899–1905.
Mandal, M., Younes, M., Swan, E.A., Jasser, S.A., Doan, D., Yigitbasi, O.,
Received: October 23, 2014
McMurphey, A., Ludwick, J., El-Naggar, A.K., Bucana, C., et al. (2006). The
Revised: February 26, 2015
Akt inhibitor KP372-1 inhibits proliferation and induces apoptosis and anoikis
Accepted: April 3, 2015
in squamous cell carcinoma of the head and neck. Oral Oncol. 42, 430–439.
Published: May 5, 2015
Ostrander, J.H., McMahon, C.M., Lem, S., Millon, S.R., Brown, J.Q., Seewaldt,
REFERENCES V.L., and Ramanujam, N. (2010). Optical redox ratio differentiates breast can-
cer cell lines based on estrogen receptor status. Cancer Res. 70, 4759–4766.
Bair, J. (2012). The development of deoxynyboquinone as a personalized anti- Pink, J.J., Planchon, S.M., Tagliarino, C., Varnes, M.E., Siegel, D., and
cancer compound. Dissertation (University of Illinois at Urbana–Champaign). Boothman, D.A. (2000). NAD(P)H:Quinone oxidoreductase activity is the
788 Cell Metabolism 21, 777–789, May 5, 2015 ª2015 Elsevier Inc.You can also read