South Africa's Renewable Energy IPP Procurement Program: Success Factors and Lessons - May 2014 Anton Eberhard, University of Cape Town Joel ...
←
→
Page content transcription
If your browser does not render page correctly, please read the page content below
May 2014

South Africa’s Renewable Energy IPP
               Procurement Program:
        Success Factors and Lessons
                         Anton Eberhard, University of Cape Town
                                  Joel Kolker, World Bank Institute
        James Leigland, Private Infrastructure Development Group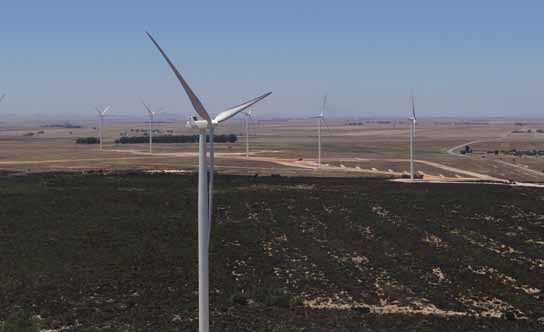
1
Larger
SEction Title
© 2014 Public-Private Infrastructure Advisory Facility (PPIAF)
1818 H Street, NW
Washington, DC 20433
www.ppiaf.org
E-mail: ppiaf@ppiaf.org
The findings, interpretations, and conclusions expressed in this report are entirely those of the authors and should not be attributed in any manner
to the Public-Private Infrastructure Advisory Facility (PPIAF) or to The World Bank Group, to its affiliated organizations, or to members of its Board
of Executive Directors or the countries they represent.
Neither PPIAF nor The World Bank Group guarantees the accuracy of the data included in this publication or accepts responsibility for any
consequence of their use. The boundaries, colors, denominations, and other information shown on any map in this report do not imply on the
part of PPIAF or The World Bank Group any judgment on the legal status of any territory or the endorsement or acceptance of such boundaries.
For questions about this publication or information about ordering more copies, please refer to the PPIAF website or contact PPIAF by email at the
address above.
Rights and Permissions
The material in this work is subject to copyright. Because PPIAF and The World Bank Group encourages dissemination of its knowledge, this work
may be reproduced, in whole or in part, for noncommercial purposes, as long as full attribution to this work is given.
Any queries on rights and licenses, including subsidiary rights, should be addressed to World Bank Publications, The World Bank Group, 1818 H
Street, NW, Washington, DC 20433, USA; fax: 202-522-2625; e-mail: pubrights@worldbank.org.
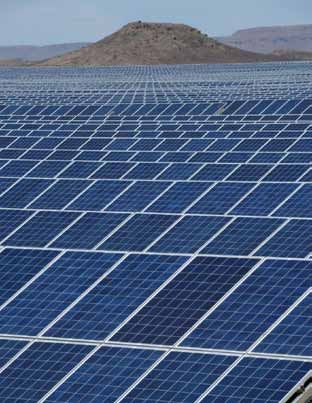
Cover photos: Left, Photograph taken during construction of Hopefield Wind Farm (66MW), Western Cape. Courtesy of Umoya Energy (RF)
(Pty) Ltd.; right, Kalkbult. Eric Miller for Scatec.
Cover design: TM Design, Inc.
21
SEction
Table of contents
Title
Acknowledgements . . . . . . . . . . . . . . . . . . . . . . . . . . . . . . . . . . . . . . . . . . . . . . . . . . . . . . . . . . . . . . . . . . . . . . . . . . . . . . . . . . . . . . . . . . . . . . . . . . . . . . . iii
Abbreviations . . . . . . . . . . . . . . . . . . . . . . . . . . . . . . . . . . . . . . . . . . . . . . . . . . . . . . . . . . . . . . . . . . . . . . . . . . . . . . . . . . . . . . . . . . . . . . . . . . . . . . . . . . . . iv
Executive Summary . . . . . . . . . . . . . . . . . . . . . . . . . . . . . . . . . . . . . . . . . . . . . . . . . . . . . . . . . . . . . . . . . . . . . . . . . . . . . . . . . . . . . . . . . . . . . . . . . . . . . . . 1
Introduction . . . . . . . . . . . . . . . . . . . . . . . . . . . . . . . . . . . . . . . . . . . . . . . . . . . . . . . . . . . . . . . . . . . . . . . . . . . . . . . . . . . . . . . . . . . . . . . . . . . . . . . . . . . . . . 4
1. From Feed-in Tariffs to Competitive Tenders . . . . . . . . . . . . . . . . . . . . . . . . . . . . . . . . . . . . . . . . . . . . . . . . . . . . . . . . . . . . . . . . . . . . . . . . . . . . . 5
1.1 South Africa’s electricity supply system . . . . . . . . . . . . . . . . . . . . . . . . . . . . . . . . . . . . . . . . . . . . . . . . . . . . . . . . . . . . . . . . . . . . . . . . . . . . . . . . . 5
1.2 Electricity planning and previous attempts to introduce IPPs . . . . . . . . . . . . . . . . . . . . . . . . . . . . . . . . . . . . . . . . . . . . . . . . . . . . . . . . . . . . . . 6
1.3 Renewable energy policy . . . . . . . . . . . . . . . . . . . . . . . . . . . . . . . . . . . . . . . . . . . . . . . . . . . . . . . . . . . . . . . . . . . . . . . . . . . . . . . . . . . . . . . . . . . . . . .6
1.4 From REFIT to REIPPPP . . . . . . . . . . . . . . . . . . . . . . . . . . . . . . . . . . . . . . . . . . . . . . . . . . . . . . . . . . . . . . . . . . . . . . . . . . . . . . . . . . . . . . . . . . . . . . . . 7
2. Government Design and Management of the REIPPPP Tender Process . . . . . . . . . . . . . . . . . . . . . . . . . . . . . . . . . . . . . . . . . . . . . . . . . . . . . . 9
2.1 Institutional setting . . . . . . . . . . . . . . . . . . . . . . . . . . . . . . . . . . . . . . . . . . . . . . . . . . . . . . . . . . . . . . . . . . . . . . . . . . . . . . . . . . . . . . . . . . . . . . . . . . . 9
2.2 The REIPPPP management team. . . . . . . . . . . . . . . . . . . . . . . . . . . . . . . . . . . . . . . . . . . . . . . . . . . . . . . . . . . . . . . . . . . . . . . . . . . . . . . . . . . . . . . . .9
2.3 Management style . . . . . . . . . . . . . . . . . . . . . . . . . . . . . . . . . . . . . . . . . . . . . . . . . . . . . . . . . . . . . . . . . . . . . . . . . . . . . . . . . . . . . . . . . . . . . . . . . . . . 9
2.4 Program resources. . . . . . . . . . . . . . . . . . . . . . . . . . . . . . . . . . . . . . . . . . . . . . . . . . . . . . . . . . . . . . . . . . . . . . . . . . . . . . . . . . . . . . . . . . . . . . . . . . . . .10
2.5 Tender design and bid process . . . . . . . . . . . . . . . . . . . . . . . . . . . . . . . . . . . . . . . . . . . . . . . . . . . . . . . . . . . . . . . . . . . . . . . . . . . . . . . . . . . . . . . . . 11
2.6 Bid evaluation . . . . . . . . . . . . . . . . . . . . . . . . . . . . . . . . . . . . . . . . . . . . . . . . . . . . . . . . . . . . . . . . . . . . . . . . . . . . . . . . . . . . . . . . . . . . . . . . . . . . . . . 13
3. Tender Outcomes. . . . . . . . . . . . . . . . . . . . . . . . . . . . . . . . . . . . . . . . . . . . . . . . . . . . . . . . . . . . . . . . . . . . . . . . . . . . . . . . . . . . . . . . . . . . . . . . . . . . . 14
3.1 Round 1 outcomes . . . . . . . . . . . . . . . . . . . . . . . . . . . . . . . . . . . . . . . . . . . . . . . . . . . . . . . . . . . . . . . . . . . . . . . . . . . . . . . . . . . . . . . . . . . . . . . . . . . 15
3.2 Round 2 outcomes . . . . . . . . . . . . . . . . . . . . . . . . . . . . . . . . . . . . . . . . . . . . . . . . . . . . . . . . . . . . . . . . . . . . . . . . . . . . . . . . . . . . . . . . . . . . . . . . . . . 16
3.3 Round 3 outcomes . . . . . . . . . . . . . . . . . . . . . . . . . . . . . . . . . . . . . . . . . . . . . . . . . . . . . . . . . . . . . . . . . . . . . . . . . . . . . . . . . . . . . . . . . . . . . . . . . . . 16
3.4 Plans for Round 4 . . . . . . . . . . . . . . . . . . . . . . . . . . . . . . . . . . . . . . . . . . . . . . . . . . . . . . . . . . . . . . . . . . . . . . . . . . . . . . . . . . . . . . . . . . . . . . . . . . . . 17
3.5 Rounds 1-3: Competition and pricing . . . . . . . . . . . . . . . . . . . . . . . . . . . . . . . . . . . . . . . . . . . . . . . . . . . . . . . . . . . . . . . . . . . . . . . . . . . . . . . . . . . 17
4. Key Private Sector Actors . . . . . . . . . . . . . . . . . . . . . . . . . . . . . . . . . . . . . . . . . . . . . . . . . . . . . . . . . . . . . . . . . . . . . . . . . . . . . . . . . . . . . . . . . . . . . 19
4.1 Project sponsors . . . . . . . . . . . . . . . . . . . . . . . . . . . . . . . . . . . . . . . . . . . . . . . . . . . . . . . . . . . . . . . . . . . . . . . . . . . . . . . . . . . . . . . . . . . . . . . . . . . . . 19
4.2 Financiers . . . . . . . . . . . . . . . . . . . . . . . . . . . . . . . . . . . . . . . . . . . . . . . . . . . . . . . . . . . . . . . . . . . . . . . . . . . . . . . . . . . . . . . . . . . . . . . . . . . . . . . . . . . 19
4.3 Engineering, Procurement and Construction (EPC) contractors and equipment suppliers . . . . . . . . . . . . . . . . . . . . . . . . . . . . . . . . . . . 22
5. Trade-offs Between Prices and Economic Development Outcomes . . . . . . . . . . . . . . . . . . . . . . . . . . . . . . . . . . . . . . . . . . . . . . . . . . . . . . . . 24
5.1 Economic development requirements . . . . . . . . . . . . . . . . . . . . . . . . . . . . . . . . . . . . . . . . . . . . . . . . . . . . . . . . . . . . . . . . . . . . . . . . . . . . . . . . . . 24
5.2 Economic development: criticism and controversy. . . . . . . . . . . . . . . . . . . . . . . . . . . . . . . . . . . . . . . . . . . . . . . . . . . . . . . . . . . . . . . . . . . . . . . 28
5.1.1 Job creation . . . . . . . . . . . . . . . . . . . . . . . . . . . . . . . . . . . . . . . . . . . . . . . . . . . . . . . . . . . . . . . . . . . . . . . . . . . . . . . . . . . . . . . . . . . . . . . . . . . 28
5.2.2 Ownership/jobs vs. capacity building. . . . . . . . . . . . . . . . . . . . . . . . . . . . . . . . . . . . . . . . . . . . . . . . . . . . . . . . . . . . . . . . . . . . . . . . . . . . . 28
5.2.3 Manufacturing. . . . . . . . . . . . . . . . . . . . . . . . . . . . . . . . . . . . . . . . . . . . . . . . . . . . . . . . . . . . . . . . . . . . . . . . . . . . . . . . . . . . . . . . . . . . . . . . . 28
5.2.4 Enterprise and socio-economic development. . . . . . . . . . . . . . . . . . . . . . . . . . . . . . . . . . . . . . . . . . . . . . . . . . . . . . . . . . . . . . . . . . . . . 29
6. Key Success Factors, Shortcomings and Risks . . . . . . . . . . . . . . . . . . . . . . . . . . . . . . . . . . . . . . . . . . . . . . . . . . . . . . . . . . . . . . . . . . . . . . . . . . . 30
6.1 Program management factors . . . . . . . . . . . . . . . . . . . . . . . . . . . . . . . . . . . . . . . . . . . . . . . . . . . . . . . . . . . . . . . . . . . . . . . . . . . . . . . . . . . . . . . . . 30
6.1.1 Political support . . . . . . . . . . . . . . . . . . . . . . . . . . . . . . . . . . . . . . . . . . . . . . . . . . . . . . . . . . . . . . . . . . . . . . . . . . . . . . . . . . . . . . . . . . . . . . . 30
6.1.2 Institutional setting. . . . . . . . . . . . . . . . . . . . . . . . . . . . . . . . . . . . . . . . . . . . . . . . . . . . . . . . . . . . . . . . . . . . . . . . . . . . . . . . . . . . . . . . . . . . . 30
6.1.3 The REIPPPP management team . . . . . . . . . . . . . . . . . . . . . . . . . . . . . . . . . . . . . . . . . . . . . . . . . . . . . . . . . . . . . . . . . . . . . . . . . . . . . . . . . 30
6.1.4 Management style .. . . . . . . . . . . . . .. . . . . . . . . . . . . . . . . . . . . . . . . . . . . . . . . . . . . . . . . . . . . . . . . . . . . . . . . . . . . . . . . . . . . . . . . . . . . . . 31
6.1.5 Program resources. . . . . . . . . . . . . . . . . . . . . . . . . . . . . . . . . . . . . . . . . . . . . . . . . . . . . . . . . . . . . . . . . . . . . . . . . . . . . . . . . . . . . . . . . . . . . . 31
6.1.6 Quality of transaction advice. . . . . . . . .. . . . . . . . . . . . . . . . . . . . . . . . . . . . . . . . . . . . . . . . . . . . . . . . . . . . . . . . . . . . . . . . . . . . . . . . . . . . 31
6.1.7 Program management shortcomings . . . . . . . . . . . . . . . . . . . . . . . . . . . . . . . . . . . . . . . . . . . . . . . . . . . . . . . . . . . . . . . . . . . . . . . . . . . . . 31
6.1.8 Program management risks going forward. . . . . . . . . . . . . . . . . . . . . . . . . . . . . . . . . . . . . . . . . . . . . . . . . . . . . . . . . . . . . . . . . . . . . . . . 31
6.2 Program design factors. . . . . . . . . . . . . . . . . . . . . . . . . . . . . . . . . . . . . . . . . . . . . . . . . . . . . . . . . . . . . . . . . . . . . . . . . . . . . . . . . . . . . . . . . . . . . . . 32
6.2.1 Accelerated roll-out of new generating capacity . . . . . . . . . . . . . . . . . . . . . . . . . . . . . . . . . . . . . . . . . . . . . . . . . . . . . . . . . . . . . . . . . . .32
6.2.2 Program size. . . . . . . . . . . . . . . . . . . . . . . .. . . . . . . . . . . . . . . . . . . . . . . . . . . . . . . . . . . . . . . . . . . . . . . . . . . . . . . . . . . . . . . . . . . . . . . . . . . . 32
6.2.3 Potential project profitability. . . . . . . . . . . . . . . . . . . . . . . . . . . . . . . . . . . . . . . . . . . . . . . . . . . . . . . . . . . . . . . . . . . . . . . . . . . . . . . . . . . . 32
6.2.4 The shift from FITs to competitive tenders . . . .. . . . . . . . . . . . . . . . . . . . . . . . . . . . . . . . . . . . . . . . . . . . . . . . . . . . . . . . . . . . . . . . . . . . 32
6.2.5 Multiple bidding rounds . . . . . . . . . . . . . . . . . . . . . . . . . . . . . . . . . . . . . . . . . . . . . . . . . . . . . . . . . . . . . . . . . . . . . . . . . . . . . . . . . . . . . . . . 32
TABLE OF CONTENTS iTable of contents
6.2.6 Exemption from PPP regulations . . . . . . . . . . . . . . . . . . . . . . . . . . . . . . . . . . . . . . . . . . . . . . . . . . . . . . . . . . . . . . . . . . . . . . . . . . . . . . . . . 33
6.2.7 Non-negotiable program characteristics . . . . . . . . . . . . . . . . . . . . . . . . . . . . . . . . . . . . . . . . . . . . . . . . . . . . . . . . . . . . . . . . . . . . . . . . . . 33
6.2.8 Economic development requirements. . . . . . . . . . . . . . . . . . . . . . . . . . . . . . . . . . . . . . . . . . . . . . . . . . . . . . . . . . . . . . . . . . . . . . . . . . . . . 33
6.2.9 Sovereign guarantee . . . . . . . . . . . . . . . . . . . . . . . . . . . . . . . . . . . . . . . . . . . . . . . . . . . . . . . . . . . . . . . . . . . . . . . . . . . . . . . . . . . . . . . . . . . . 33
6.2.10 Program design shortcomings. . . . . . . . . . . . . . . . . . . . . . . . . . . . . . . . . . . . . . . . . . . . . . . . . . . . . . . . . . . . . . . . . . . . . . . . . . . . . . . . . . .34
6.211 Program design risks going forward . . . . . . . . . . . . . . . . . . . . . . . . . . . . . . . . . . . . . . . . . . . . . . . . . . . . . . . . . . . . . . . . . . . . . . . . . . . . . . . 34
6.3 Market factors . . . . . . . . . . . . . . . . . . . . . . . . . . . . . . . . . . . . . . . . . . . . . . . . . . . . . . . . . . . . . . . . . . . . . . . . . . . . . . . . . . . . . . . . . . . . . . . . . . . . . . . 35
6.3.1 Global supply and demand of renewable energy. . . . . . . . . . . . . . . . . . . . . . . . . . . . . . . . . . . . . . . . . . . . . . . . . . . . . . . . . . . . . . . . . . . . 35
6.3.2 Donor and Multilateral Development Bank support for renewables. . . . . . . . . . . . . . . . . . . . . . . . . . . . . . . . . . . . . . . . . . . . . . . . . . . 35
6.3.3 The South African banking sector . . . . . . . . . . . . . . . . . . . . . . . . . . . . . . . . . . . . . . . . . . . . . . . . . . . . . . . . . . . . . . . . . . . . . . . . . . . . . . . . 36
6.3.4 Other advisory services . . . . . . . . . . . . . . . . . . . . . . . . . . . . . . . . . . . . . . . . . . . . . . . . . . . . . . . . . . . . . . . . . . . . . . . . . . . . . . . . . . . . . . . . . 36
6.3.5 Market shortcomings. . . . . . . . . . . . . . . . . . . . . . . . . . . . . . . . . . . . . . . . . . . . . . . . . . . . . . . . . . . . . . . . . . . . . . . . . . . . . . . . . . . . . . . . . . . . 36
6.3.6 Market risks going forward . . . . . . . . . . . . . . . . . . . . . . . . . . . . . . . . . . . . . . . . . . . . . . . . . . . . . . . . . . . . . . . . . . . . . . . . . . . . . . . . . . . . . . 37
7. Lessons for Other developing countries . . . . . . . . . . . . . . . . . . . . . . . . . . . . . . . . . . . . . . . . . . . . . . . . . . . . . . . . . . . . . . . . . . . . . . . . . . . . . . . . 38
7.1 Adopt a business-friendly approach . . . . . . . . . . . . . . . . . . . . . . . . . . . . . . . . . . . . . . . . . . . . . . . . . . . . . . . . . . . . . . . . . . . . . . . . . . . . . . . . . . . 38
7.2 Take advantage of external sources of funding. . . . . . . . . . . . . . . . . . . . . . . . . . . . . . . . . . . . . . . . . . . . . . . . . . . . . . . . . . . . . . . . . . . . . . . . . . . 38
7.3 Make a case for renewable energy (…and keep making it) . . . . . . . . . . . . . . . . . . . . . . . . . . . . . . . . . . . . . . . . . . . . . . . . . . . . . . . . . . . . . . . . 39
7.4 Find a program champion . . . . . . . . . . . . . . . . . . . . . . . . . . . . . . . . . . . . . . . . . . . . . . . . . . . . . . . . . . . . . . . . . . . . . . . . . . . . . . . . . . . . . . . . . . . . . 39
7.5 Identify a program design that suits country circumstances . . . . . . . . . . . . . . . . . . . . . . . . . . . . . . . . . . . . . . . . . . . . . . . . . . . . . . . . . . . . . .39
7.6 Ensure quality procurement and contracting documentation and processes are in place. . . . . . . . . . . . . . . . . . . . . . . . . . . . . . . . . . . . . 40
8. References . . . . . . . . . . . . . . . . . . . . . . . . . . . . . . . . . . . . . . . . . . . . . . . . . . . . . . . . . . . . . . . . . . . . . . . . . . . . . . . . . . . . . . . . . . . . . . . . . . . . . . . . . . . 41
Appendices. . . . . . . . . . . . . . . . . . . . . . . . . . . . . . . . . . . . . . . . . . . . . . . . . . . . . . . . . . . . . . . . . . . . . . . . . . . . . . . . . . . . . . . . . . . . . . . . . . . . . . . . . . . . . . 42
Appendix 1: Eskom’s power stations . . . . . . . . . . . . . . . . . . . . . . . . . . . . . . . . . . . . . . . . . . . . . . . . . . . . . . . . . . . . . . . . . . . . . . . . . . . . . . . . . . . . . . . . . . . 42
Appendix 2: South African Integrated Resource Plan 2010-30 . . . . . . . . . . . . . . . . . . . . . . . . . . . . . . . . . . . . . . . . . . . . . . . . . . . . . . . . . . . . . . . . . . 43
Appendix 3: REIPPPP Economic Development Objectives. . . . . . . . . . . . . . . . . . . . . . . . . . . . . . . . . . . . . . . . . . . . . . . . . . . . . . . . . . . . . . . . . . . . . . . 44
Appendix 4: REIPPPP Economic Development Scoring Categories . . . . . . . . . . . . . . . . . . . . . . . . . . . . . . . . . . . . . . . . . . . . . . . . . . . . . . . . . . . . . . . . 45
Appendix 5: REIPPPP Projects . . . . . . . . . . . . . . . . . . . . . . . . . . . . . . . . . . . . . . . . . . . . . . . . . . . . . . . . . . . . . . . . . . . . . . . . . . . . . . . . . . . . . . . . . . . . . . . . . 46
Boxes
Box 1: REIPPPP Evaluation Consultants. . . . . . . . . . . . . . . . . . . . . . . . . . . . . . . . . . . . . . . . . . . . . . . . . . . . . . . . . . . . . . . . . . . . . . . . . . . . . . . . . . . . . . . . . .10
Figures
Figure 1: Average Nominal and Real Eskom Electricity Prices (Usc/Kwh) (Exchange Rate ZAR10/ USD). . . . . . . . . . . . . . . . . . . . . . . . . . . . . . . . 5
Figure 2: Prominent Shareholders in REIPPPP Windows 1, 2 & 3 . . . . . . . . . . . . . . . . . . . . . . . . . . . . . . . . . . . . . . . . . . . . . . . . . . . . . . . . . . . . . . . . . . . 19
Figure 3: Share of Debt Financing in REIPPPP Rounds 1, 2 & 3 . . . . . . . . . . . . . . . . . . . . . . . . . . . . . . . . . . . . . . . . . . . . . . . . . . . . . . . . . . . . . . . . . . . . 20
Figure 4: Share of Initial Debt Providers in REIPPPP . . . . . . . . . . . . . . . . . . . . . . . . . . . . . . . . . . . . . . . . . . . . . . . . . . . . . . . . . . . . . . . . . . . . . . . . . . . . . . .21
Figure 5: Major Debt Providers in REIPPPP Rounds 1, 2 & 3 . . . . . . . . . . . . . . . . . . . . . . . . . . . . . . . . . . . . . . . . . . . . . . . . . . . . . . . . . . . . . . . . . . . . . . . 22
Figure 6: Main Wind and PV Equipment Suppliers in REIPPPP Rounds 1, 2 & 3 . . . . . . . . . . . . . . . . . . . . . . . . . . . . . . . . . . . . . . . . . . . . . . . . . . . . . 23
Tables
Table 1: REFIT and REIPPPP prices . . . . . . . . . . . . . . . . . . . . . . . . . . . . . . . . . . . . . . . . . . . . . . . . . . . . . . . . . . . . . . . . . . . . . . . . . . . . . . . . . . . . . . . . . . . . . . .8
Table 2: Summarized Results for REIPPPP Windows 1, 2, and 3 . . . . . . . . . . . . . . . . . . . . . . . . . . . . . . . . . . . . . . . . . . . . . . . . . . . . . . . . . . . . . . . . . . . 14
Table 3: REIPPPP Average Bid Prices (2011 SAc/kW) . . . . . . . . . . . . . . . . . . . . . . . . . . . . . . . . . . . . . . . . . . . . . . . . . . . . . . . . . . . . . . . . . . . . . . . . . . . . 17
Table 4: REIPPPP Local Content Scoring Requirements and Results . . . . . . . . . . . . . . . . . . . . . . . . . . . . . . . . . . . . . . . . . . . . . . . . . . . . . . . . . . . . . . . 26
Table 5: REIPPPP Economic Development Outcomes . . . . . . . . . . . . . . . . . . . . . . . . . . . . . . . . . . . . . . . . . . . . . . . . . . . . . . . . . . . . . . . . . . . . . . . . . . . . 27
ii Table of ContentsACKNOWLEDGEMENTS Acknowledgements The authors are indebted to the DOE IPP team for providing detailed background and access to substantial amounts of information. The team, led by Karen Breytenbach, dedicated hours to extensive interviews and queries. The South Africa Department of Energy and the National Treasury also provided valuable inputs. A number of private sector players, financiers and operators also shared their insights and views on the REIPPPP program. Several World Bank colleagues provided peer reviews, including Luiz Maurer, International Finance Corporation; Karan Capoor, Africa Energy Unit; and Satheesh Sundarajan, Public Private Infrastructure Advisory Facility (PPIAF). PPIAF also generously provided financial support for the study. Mark Pickering, Andrew Donaldson, Katharine Gratwick, Rosalind Thomas, Holle Linnea Wolkas, Sarah Stands, Mike Fitzpatrick and Paul Wroblicki provided insights and reviews. Finally, any errors contained in the document are solely the responsibly of the authors. Acknowledgements iii
abbreviations

                     BEE Black Economic Empowerment

                 BBBEE Broad-Based Black Economic Empowerment Act of 2003

                   COD Commercial Operation Date

                     COP Conference of Parties

                     CSP Concentrated Solar Power

                      DA Direct Agreement

                  DBSA Development Bank of Southern Africa

                     DFI Development Finance Institution

                     DOE Department of Energy

                      EIB European Investment Bank

                     FITs Feed-in Tariffs

                      IA Implementation Agreement

                      IFC International Finance Corporation

                     IPPs Independent Power Producers

                   MDB Multilateral Development Banks

                  MOA Memorandum of Agreement

                     MW Megawatt

                 NERSA National Energy Regulator of South Africa

                  OECD Organization of Economic Cooperation and Development

                   OPIC Overseas Private Investment Corporation

                     PPA Power Purchase Agreement

                     PPP Public-Private Partnerships

                 PPPFA Preferential Procurement Policy Framework Act

                      PV Photovoltaic

                  REFIT Renewable Energy Feed-in Tariffs

                REIPPPP Renewable Energy Independent Power Project Procurement Program

                     RFP Request for Proposals

                     VfM Value for Money

iv                                                                                       abbreviations
executive
summary
Executive Summary
Overview
South Africa occupies a central position in the global debate regarding the most effective policy instruments to accelerate and sustain
private investment in renewable energy. In 2009, the government began exploring feed-in tariffs (FITs) for renewable energy, but these were
later rejected in favor of competitive tenders. The resulting program, now known as the Renewable Energy Independent Power Producer
Procurement Program (REIPPPP), has successfully channeled substantial private sector expertise and investment into grid-connected
renewable energy in South Africa at competitive prices.
To date, a total of 64 projects have been awarded to the private sector, and the first projects are already on line. Private sector investment
totaling US$14 billion has been committed, and these projects will generate 3922 megawatt (MW) of renewable power. Prices have dropped
over the three bidding phases with average solar photovoltaic (PV) tariffs decreasing by 68 percent and wind dropping by 42 percent, in
nominal terms. Most impressively, these achievements all occurred over a two-and-a-half year period. Finally, there have been notable
improvements in the economic development commitments, primarily benefiting rural communities. One investor characterized REIPPPP as
“the most successful public-private partnership in Africa in the last 20 years.” Important lessons can be learned for both South Africa and
other emerging markets contemplating investments in renewables and other critical infrastructure investments.
The Bidding Process and the Results
In August 2011, an initial Request for Proposals (RFP) was issued, and a compulsory bidder’s conference was held with over 300
organizations attending. By November 2011, 53 bids for 2128 MW of power generating capacity were received. Ultimately 28 preferred
bidders were selected offering 1416 MW for a total investment of close to US$6 billion. Major contractual agreements were signed on
November 5, 2012, with most projects reaching full financial close shortly thereafter. Construction on all of these projects has commenced
with the first project coming on line in November 2013.
A second round of bidding was announced in November 2011. The total amount of power to be acquired was reduced, and other changes
were made to tighten the procurement process and increase competition. Seventy-nine bids for 3233 MW were received in March 2012,
and19 bids were ultimately selected. Prices were more competitive, and bidders also offered better local content terms. Implementation,
power purchase and direct agreements were signed for all 19 projects in May 2013.
A third round of bidding commenced in May 2013, and again, the total capacity offered was restricted. In August 2013, 93 bids were received
totaling 6023 MW. Seventeen preferred bidders were notified in October 2013 totaling 1456 MW. Prices fell further in round three. Local
content again increased, and financial closure was expected in July 2014. A fourth round of bidding was set to commence in August 2014.
The first three REIPPPP bid rounds attracted a wide variety of domestic and international project developers, sponsors and equity
shareholders. The 64 successful projects involved over a 100 different shareholder entities, 46 of these in more than one project. Banks,
insurers, DFI’s and even international utilities have all participated in the program. The most common financing structure has been project
finance, although about a third of the projects in the third round used corporate financing arrangements. The majority of debt funding has
been from commercial banks (ZAR 57 bn) with the balance from Development Finance Institutions (DFIs) (ZAR 27.8 bn), and pension and
insurance funds (ZAR 4.7 bn). Eighty-six percent of debt has been raised from within South Africa, and debt tenors typically extend 15 to 17
years from Commercial Date of Operation (COD). Spreads over JIBAR are between 350 and 400 basis points.
Executive Summary 1executive
summary
Key Success Factors and Challenges
REIPPPP’s success factors, shortcomings and risks can be organized under three general headings: 1) program management factors; 2)
program design factors; and 3) market factors.
In terms of program management factors, the largely ad hoc institutional status of the Department of Energy (DOE) Independent Power
Producer (IPP) unit allowed an approach that emphasized problem solving, rather than enforcement of administrative arrangements, and did
not undermine quality or transparency. The DOE IPP management team and the team leader had extensive experience, PPP expertise, and
credibility with both public and private sector stakeholders. This team was also able to overcome some of the mistrust of private business
that sometimes restricts the public-private dialogue in South Africa and secured resources to implement a quality program. These resources
were used to appoint experienced advisors who were able to transfer international best practice into the South Africa context. Despite these
successes, the ad-hoc status of the DOE IPP unit poses some risks. For this procurement process to be sustainable, institutional capability
will need to be built within a formal institution, preferably a future independent system and market operator.
The initial design of REIPPPP was built to some extent on the lessons of an earlier, unsuccessful effort that used feed-in tariffs and has
evolved over the three rounds of bidding. REIPPPP offered a quick way to roll out new generating capacity, and the size and structure of the
bidding process meant that there would be multiple bid winners, an important incentive for the private sector to participate. REIPPP also
represented opportunities for developers to make reasonable profits due to the link to the “REFIT-like” tariff caps in Round 1. The shift to
competitive tendering subsequently helped tariffs come down sharply over the next two rounds. The rolling series of bidding with substantial
capacity allocations also helped build confidence in the program. Certain exemptions from some of the national PPP regulations, and the
provisions of the Preferential Procurement Policy Framework Act also assisted in fast-tracking the program, without negatively impacting
transparency or quality. Furthermore, the requirement that bids be fully underwritten with debt, as well as equity, effectively eliminated the
tendency of competitive tenders to incentivize under-bidding (or “low-balling”) to win contracts. While some of the program’s economic
development requirements have been controversial, they did generate critical political support for REIPPPP.
There were also some design shortcomings and the size and readiness of the local renewable energy market were initially overestimated.
This resulted in limited competition in Round 1, with bids close to the price caps that were specified in the tender. Some REIPPPP critics also
argue that the program’s significant upfront administrative requirements and high bid costs have contributed to higher prices than in other
countries, like Brazil, and also serve as a bias against Small and Medium Scale Entrepreneurs (SMEs). While the latter critique may have
some merit, it should be noted that bid costs were nevertheless tiny in relation to overall project values.
In terms of important market factors impacting the program, the global slow-down in OECD renewable energy markets meant that REIPPPP
was able to attract considerable attention from the international private sector. REIPPPP also benefited South Africa’s sophisticated capital
market, which offered long-term project finance. The array of sophisticated advisory services was also critical to the design and management
of the REIPPPP program.
2 EXECUTIVE SUMMARYexecutive
summary
Global Lessons Learned
The South African experience suggests several key lessons for successful renewable energy programs in other emerging markets. For
example, it’s evident that private sponsors and financiers are more than willing to invest in renewable energy if the procurement process is
well designed and transparent, transactions have reasonable levels of profitability, and key risks are mitigated by government. Renewable
energy costs are falling and technologies such as wind turbines are becoming competitive with alternatives. Furthermore, renewable
energy procurement programs have the potential to leverage local social and economic development. REIPPPP also highlights the need for
effective program champions with the credibility to interact convincingly with senior government officials, effectively explain the program
to stakeholders, and communicate and negotiate with the private sector. Finally, REIPPPP demonstrates that whether an FIT or competitive
tender is chosen, private sector project developers need a clear procurement framework within which to invest.
EXECUTIVE SUMMARY 3Introduction
Introduction
As grid-connected renewable energy independent power projects (IPPs) become more prevalent around the globe, debates have intensified on
the most effective policy instruments to accelerate and sustain investment by the private sector into these electricity-generating technologies.
Feed-in tariffs (FITs) have been the most widely used government support mechanism for accelerating private investment in renewable
energy generation. FITs are meant to reflect the costs of producing particular kinds of energy, as predetermined by government analysis (rather
than set as a result of competitive bidding). They are used in offers of long-term supply contracts to renewable energy producers. However,
competitive tenders or auctions have also emerged in many jurisdictions as acceptable techniques, especially in emerging economies. Tenders
have the potential to offer lower prices, while still providing adequate incentives for market entry by renewable energy suppliers.
South Africa now occupies a central position in this debate. In 2009, the government began exploring FITs for renewable energy, but they
were rejected in 2011 in favor of competitive tenders. The initial outcomes of the program, now known as the Renewable Energy Independent
Power Procurement Program (REIPPPP), have been encouraging. Beginning with its first bid round in August 2011, REIPPPP has attracted
a multitude of international and local private project developers and investors who have channeled large amounts of private expertise and
investment into grid-connected renewable energy in South Africa at competitive prices. In its second and third bid rounds, the program
has also fostered competition with consequent, and impressive, price reductions. And, it has achieved results in record time: despite some
delays, in less than three years three successful bidding rounds have been held, evaluations have been timely and transparent, all projects in
bid windows one and two have reached financial close, and many are under construction or are already in operation.
In total, REIPPPP has generated 64 new renewable energy IPPs, of different sizes at different sites. US$14 billion in investment has been
committed for the construction of 3922 MW1 of capacity in technologies like grid-connected wind, PV and concentred solar power, as well
as smaller amounts of hydro, landfill gas and biomass energy. Since 2012, South Africa has ranked among the top ten countries globally
in terms of renewable energy IPP investments.In less than three years, South Africa has signed up more investment for more independent
power generation than has been achieved across the entire African continent over the past 20 years.
This paper explores the South African experience of introducing grid-connected renewable energy by seeking answers to a number of key
questions:
1. Why and how did South Africa move from feed-in tariffs to competitive tenders for grid-connected renewable energy?
2. How did the government design and manage the program? What were the distinctive features of these competitive tenders, and how
were the bids evaluated?
3. What were the investment and price outcomes of the different bid rounds?
4. Who were the key private sector actors in the various deals? What kinds of financing institutions were involved? Who were the successful
sponsors, equipment providers, and engineering, procurement, and construction (EPC) contractors?
5. What were the impacts and trade-offs between prices and economic development outcomes (e.g., local industrial development and
employment creation)?
6. What were the key success factors, shortcomings and risks associated with the program?
7. What lessons can the South African program offer to other developing countries?
1
This is the total after financial close of bid windows 1 and 2. The RFP total is slightly lower at 3915 MW
4 INTRIDUCTIONFrom Feed-In
Tariffs To
Competitive Tenders 1
From Feed-In Tariffs To Competitive Tenders
1.1 South Africa’s electricity supply system
The South African power system is characterized by large power stations that are concentrated in the interior of the country near the
mines and industries of Gauteng province, and long transmission lines down to coastal areas. Coal supplies approximately 70 percent of
the country’s primary energy and more than 90 percent of its electricity. A publicly owned national power utility, Eskom, generates 96
percent of the country’s electricity, owns and controls the national high-voltage transmission grid, and distributes approximately 60 percent
of electricity directly to customers. Local authorities buy bulk from Eskom and distribute the balance. Direct electricity sales to mines and
industry account for more than 40 percent of Eskom’s distribution business (see Appendix 1 for a list of Eskom’s major power stations).
In the 1970s, Eskom overestimated demand growth and embarked on a massive investment program, which continued into the1980s, when
it became apparent that the utility would have significant overcapacity. By the end of the 1990s, the country’s electricity prices ranked among
the cheapest in the world. In 2007, Eskom’s average electricity sales price was as low as 2.5 USc/kWh. In effect, the utility had paid off the
capital costs for much of its existing capacity, and customer prices were close to short-run marginal costs.
However, by 2004, already, it became clear that power reserve margins were dropping sharply and would turn negative in a few years
without Eskom interventions on both the demand and supply sides. Eskom initiated a US$40 billion power plant construction program, and
a few years later the National Energy Regulator of South Africa (NERSA) began allowing sharp upward adjustments in electricity tariffs in
an effort to sustain Eskom’s financial viability.2 Figure 1 shows how electricity prices have risen in nominal and real terms. Above inflation
increases have been agreed by the regulator for the next 5 years, causing concern among Eskom’s customers.
Figure 1: Average Nominal and Real Eskom Electricity Prices (USc/kWh) (Exchange Rate ZAR10/ USD)
7.00
6.00
5.00
4.00
3.00
2.00
1.00
0.00
1996 1998 2000 2002 2004 2006 2008 2010 2012
Nominal Tariff Real 2013 values
Source: Constructed by the authors from data extracted from Eskom Annual Reports and StatsSA.
Note: Eskom average sales prices include transmission and distribution costs.
2
Eskom is currently building two massive new coal-fired plants – Medupi and Kusile – each 4800 MW, as well as a new 1300 MW pumped storage scheme,
Ingula. At the same time, it has commenced procurement of its first renewable energy power: a 100 MW wind farm, Sere, and a 100 MW concentrated solar
plant. The latter two power projects have been funded mainly by World Bank and African Development Bank loans.
From Feed-In Tariffs To Competitive Tenders 5From Feed-In
1 Tariffs To
Competitive Tenders
1.2 Electricity planning and previous attempts to introduce IPPs
The post-Apartheid South African Government no longer leaves power planning exclusively to Eskom. The formal planning system now
mandates the Department of Energy to produce an electricity plan (Integrated Resource Plan – IRP). Based on this plan, the Minister of
Energy issues periodic determinations regarding how much new power generation is needed, and from which sources. NERSA can only
licence new capacity within the bounds set by these ministerial determinations. The most recent IRP is for the period 2010-30 and was
updated in 2013. A number of different scenarios or test cases was included (Appendix 2 presents the core model output).
The government recognizes that IPPs should be allowed to enter the market to enhance the country’s power generating capacity.3 Following
the publication of the Energy Policy White Paper in 1998, a 70:30 spilt between Eskom and the private sector was accepted by the Cabinet,
and work commenced on the design of a competitive wholesale power exchange.However, with looming Eskom power shortages, the
prospective wholesale market was abandoned in 2004 in favour of the existing single-buyer model with Eskom being the off-taker. IPPs
were still expected to play a significant role in power generation, but the policy and regulatory framework for IPPs was not immediately put in
place and procurement programs run by Eskom for cogeneration and base-load IPPs were mostly unsuccessful. No IPP contracts were signed
except for a handful of short-term power purchase agreements with industrial generators, which amounted to less than 400 MW.
1.3 Renewable energy policy
South Africa’s system for energy planning system now also requires that renewable energy play a significant role in the nation’s power
generation mix. For the first time, the IRP 2010-30 incorporated a carbon emissions cap and included renewable energy options, with 17.8
GW of solar and wind energy capacity planned by 2030 (Appendix 2). More than most countries, South Africa relies heavily on coal and
also has a highly energy-intensive economy. These factors result in South Africa’s carbon emissions (on a per capita and GDP basis) being
disproportionately high (although, in total, they amount to little over one percent of global emissions). Policymakers have been mindful of
risks that these emission levels might pose to the economy’s future international competitiveness. They are also aware that the country has
considerable potential for some types of renewable energy generation.4
The government began setting renewable energy targets in 2003, with the publication of a Renewable Energy Policy White Paper that
envisioned reaching 10,000 GWh of renewable energy generation by 2013. For years, very little was done to achieve this target, and there
was a good deal of confusion regarding what this target actually meant: was it a cumulative or annual target? Did it include renewable energy
services other than electricity? The Department of Energy eventually clarified that the target would be met by a combination of bagasse (59
percent), landfill gas (6 percent), hydro (10 percent), solar water heaters (13 percent), other biomass (1 percent), and only 1 percent wind
(and intriguingly, no PV or concentrated solar power). Even these modest targets were not met by 2013.
However, while the official renewable energy policy has not been very effective in applying practical implementation strategies, policies
to mitigate climate change have had a much more profound impact. In several respects, this is surprising because as a non-Annex 1
3
In South Africa, IPPs are generally recognized as privately financed, Greenfield generation plants, supported by non-recourse or limited recourse loans, and
backed by long-term power purchase agreements (PPA) signed with Eskom, the country’s “single buyer” of electricity.
4
South Africa has one of the highest potential solar energy regimes in the world with average daily direct normal radiation in excess of 7 KWh/m2 (Fluri et al.,
2009). The most favorable areas are in the Northern Cape, at some distance from the main metropolitan areas. South Africa also has reasonable wind energy
resources with average wind speeds above 7 m/s in some coastal and escarpment regions. The country is less endowed with hydro and biomass resources.
Average rainfall across the country is 450 mm per annum compared to a global average of 860 mm). There are relatively few large rivers, and the limited
potential for large dams and associated hydroelectric schemes have mostly already been exploited. There remains some potential for small hydro along the
escarpment.
6 From Feed-In Tariffs To Competitive TendersFrom Feed-In
Tariffs To
Competitive Tenders 1
country under the Kyoto Protocol, South Africa does not face any commitments to reduce greenhouse gas emissions.55Nevertheless,
the Department of Environmental Affairs commissioned research work on Long- Term Mitigation Strategies. These strategies provided
the basis for President Zuma to make a pledge at the Copenhagen Conference of Parties (COP) in 2009 that South Africa would reduce
its CO2 emissions 34 percent below a business-as-usual scenario by 2020, and below 42 percent by 2025, provided the international
community supported South Africa with financial aid and the transfer of appropriate technology. The peak, plateau, and decline scenarios
for carbon emissions subsequently informed the development of the IRP 2010-2030. The power sector in South Africa contributes
roughly half of the country’s carbon emissions, and an effective emissions cap was set at approximately 275 Mt/annum CO2 equivalent. A
subsequent National Climate Change Response White Paper, published in 2011, provided a wider band for emission caps, but maintained
the peak, plateau and decline trajectories. At the COP17 meeting in Durban in 2011, public and private sector stakeholder representatives
agreed to 12 “commitments” aimed at achieving the government’s goal of creating 300,000 new jobs in the “green economy” of South
Africa by 2020.
1.4 From REFIT to REIPPPP
South Africa’s voluntary pledge in Copenhagen to reduce its carbon emissions from a business-as-usual scenario was the catalyst for new
procurement strategies for renewable energy. To expand renewable energy supply, South Africa first explored the option of renewable
energy feed-in tariffs (REFITs). A REFIT policy was approved in 2009 by NERSA. Tariffs were designed to cover generation costs plus a
real after tax return on equity of 17 percent and would be fully indexed for inflation (NERSA 2009). Initial published feed-in tariffs were
generally regarded as generous by developers – 15.6 US c/kWh for wind, 26 US c/kWh for concentrated solar (troughs, with 6 hours’
storage), and 49 US c/kWh for photovoltaic.6 But considerable uncertainty about the nature of the procurement and licensing process
remained. The legality of feed-in tariffs within South Africa’s public procurement framework was unclear, as was Eskom’s intention to fully
support the REFIT program by allowing timely finalization of power purchase agreements and interconnection agreements.
In March 2011, NERSA introduced a new level of uncertainty with a surprise release of a consultation paper calling for lower feed-in tariffs,
arguing that a number of parameters—such as exchange rates and the cost of debt—had changed. The new tariffs were 25 percent lower
for wind, 13 percent lower for concentrated solar, and 41 percent lower for photovoltaic (see Table 1). Moreover, the capital component
of the tariffs would no longer be fully indexed for inflation. Importantly, in its revised financial assumptions, NERSA did not change the
required real return for equity investors of 17 percent (NERSA 2011).
More policy and regulatory uncertainty was to come. Already concerned that NERSA’s FITs were still too high, the Department of Energy
and National Treasury commissioned a legal opinion that concluded that feed-in tariffs amounted to non-competitive procurement and
were therefore prohibited by the government’s public finance and procurement regulations. The Department of Energy and National
Treasury then took the lead on a reconsideration of the government’s approach. The fundamental goal of achieving large-scale renewable
energy projects with private developers and financiers remained the same. However, the structure of the transactions, including the feed-in
tariffs, was to change significantly.
5
The goal of the Kyoto Protocol is to limit emissions of greenhouse gases (GHGs). According to the treaty, in 2012, Annex I Parties who have ratified the
treaty must have fulfilled their obligations regarding GHG emission limitations established for the Kyoto Protocol’s first commitment period (2008–2012).
These emission limitation commitments are listed in Annex B of the Protocol. Non-Annex 1 countries, like South Africa, are not obligated by these caps.
6
These values are calculated at the exchange rate at the time of ZAR8/USD.
From Feed-In Tariffs To Competitive Tenders 7From Feed-In
1 Tariffs To
Competitive Tenders
Table 1: REFIT and REIPPPP Prices
REFIT REIPPPP REIPPPP
(ZAR / kWh) (ZAR/kWh) (US c/kWh)
Technology 2009 Tariff 2011 Tariff Bid Cap Round 1 Round 1
Wind 1.25 0.94 1.15 1.14 14.3
Photovoltaic 3.94 2.31 2.85 2.76 34.5
Concentrated solar
3.14 1.84 2.85 2.69 33.6
trough with storage
Source: Constructed by authors from Department of Energy sources.
Note: 8 ZAR/USD.
A series of informal consultations were held with developers, lawyers and financial institutions throughout the first half of 2011. These
meetings proved to be extremely important in terms of allaying market concerns resulting from the earlier REFIT process and providing
informal feedback from the private sector on design, legal, and technology issues.
In August 2011, the DOE announced that a competitive bidding process for renewable energy would be launched, known as the Renewable
Energy Independent Power Procurement Program (REIPPP). Subsequently, NERSA officially terminated the REFITs. Not a single megawatt of
power had been signed in the two years since the launch of the REFIT program as a practical procurement process was never implemented,
and the required contracts were never negotiated or signed. The abandonment of feed-in tariffs was met with dismay by a number of
renewable energy project developers that had secured sites and initiated resource measurements and environmental impact assessments.
But, it was these early developers who would later benefit from the first round of competitive bidding under REIPPPP.
8 From Feed-In Tariffs To Competitive TendersGovernment Design
and Management 2
Government Design and Management of the REIPPPP Tender Process
2.1 Institutional setting
REIPPPP was implemented against an historical background of institutional shortcomings in the country’s energy sector. Previous efforts to
contract IPPs had been left to Eskom, based on instructions from government.7 But all of these efforts failed, perhaps because of a lack of
capacity or (according to some critics) because of a fundamental lack of incentives for Eskom to weaken its monopoly on power generation.
REIPPP was different because the Department of Energy (DOE) took control of the program. But DOE also recognized that, like Eskom,
it had little institutional capacity to run a sophisticated, multi-project, multibillion-dollar international competitive bidding process for
renewable energy. As a consequence, DOE sought the assistance of the National Treasury’s Public-Private Partnership (PPP) Unit to manage
the process. A small team of technical staff from DOE and the PPP Unit established a project office, known as the DOE IPP unit, which
functioned effectively outside of the formal departmental structure of national government to act as a facilitator for the REIPPPP process.
2.2 The REIPPPP management team
The REIPPPP team was led by a senior manager from the National Treasury PPP Unit who had worked in there since its creation in 2000, had
helped establish Treasury’s rigorous PPP project appraisal framework, and had been involved with DOE’s efforts to promote IPPs as early as
2007. Other legal and technical experts were also brought on board and formed a small, tightknit team, which was viewed favorably by both
the public and private sectors as a professional unit with a track record of considerable expertise in closing PPP contracts and a reputation as
problem solvers and facilitators rather than regulators. This kind of credibility allowed the unit to act effectively as a champion of the REIPPPP
process.
2.3 Management style
Largely because the team was familiar with private sector infrastructure projects, as well as most of the bankers, lawyers, and consultants
involved in such projects in South Africa, the unit did not start out with the level of mistrust of private business that sometimes characterizes
other government agencies in South Africa. Dialogue with private sector counterparts on key REIPPPP design and implementation issues
began almost immediately and continued throughout the process. The program was managed from the outset in a fashion that was tailored
toward generating enthusiastic participation by private sector players. High standards were set and maintained throughout the bidding
process, including security arrangements and transparent procurement procedures. Documentation was extensive, high quality, and readily
available on a specially designed program website. Another feature of the team’s management style that impressed many private players
was the effort made to meet most of the program’s announced deadlines. The deadline for the Round 1 financial close slipped a few months
as the government finalized financial security arrangements, but other schedule delays were minor. This was a dramatic difference from
virtually all of the earlier IPP programs in the sector, and was a clear signal to many operators, investors, and advisors that this program was
focused on results.
A final, very important aspect of the program’s management style involved the extensive use of private domestic and international advisers
to design and help manage the program, review bids, and incorporate lessons learned into the program as it progressed through the bid
rounds (Box 1).
7
One exception was an earlier effort by the Department of Energy to procure open-cycle, diesel-fired turbines.
Government Design and Management of the REIPPPP Tender Process 92
Government Design
and Management
Box 1: REIPPPP Evaluation Consultants
International Reviewers
Legal: Linklaters (UK)
Technical: Tony Wheeler Consulting (UK)
Governance: Ernst & Young
Project Management
SPP Project Solutions
Legal Evaluation
Bowman Gilfillan
Edward Nathan Sonnebergs (ENSafrica)
Ledwaba Mazwai
Webber Wentzel
Technical Evaluation
Mott MacDonald
Financial Evaluation
Ernst & Young (EY)
PWC
Source: Constructed by authors from DOE presentation.
2.4 Program resources
Key factors in having access to such high quality private advisory assistance was the availability of financial resources to pay these experts, as
well as offices, a website, various databases, and one of the most sophisticated, complicated bidding processes ever seen in Africa. Funding
for the program was originally made available pursuant to a memorandum of agreement (MOA) signed by DOE, National Treasury and the
Development Bank of Southern Africa (DBSA). The latter was to provide a share of senior debt on the projects and make available R 80 million
for consultants, a project office, and capacity building. In addition, technical assistance funding was made available by various bi-lateral donor
agencies, including those representing Denmark, Germany, Spain and the UK. The World Bank had also previously facilitated a US$6 million
grant from the Global Environment Facility (GEF) for advisory services under the Renewable Energy Market Transformation Project.
By the end of 2010, a team of consultants was on board and program design was underway. When it became clear that the REFIT process
could not proceed, the external donors advised on REIPPPP’s tender process after reviewing international tender processes in India, Brazil,
Germany, France, Spain and elsewhere.
In 2011, the National Treasury made R100 million available, and some of this was used to repay the DBSA (although the DBSA still acts as
the payment agent for REIPPPP). The National Treasury money saw the program through the first round and part of the second. Subsequent
to that, the program has relied on bidder registration fees and fees paid by successful IPP project companies – on the effective date of the
Implementation Agreements, successful project companies must pay a project development fee of one percent of total project costs to a
10 Government Design and Management of the REIPPPP Tender Process2
Government Design
and Management
Project Development Fund for Renewable Energy projects managed by DOE. The fund covers current and future costs associated with DOE
procurement of renewable energy and oversight of the program. These funding arrangements have helped the program remain off the formal
government budget in subsequent bidding rounds.
2.5 Tender design and bid process
On August 3, 2011 a Request for Proposals was issued, and the next month a compulsory bidder’s conference was held to address questions
on bid requirements, documentation, power purchase agreements, etc. Some 300 organizations attended this conference. The REIPPPP
program envisioned the procurement of 3,625 MW of power over a maximum of five tender rounds. Another 100 MW was reserved for
small projects below 5 MW that wereprocured in a separate small projects IPP program. Caps were set on the total capacity to be procured
for individual technologies – the largest allocations were for wind and photovoltaics, with smaller amounts for concentrated solar, biomass,
biogas, landfill gas, and hydro (see Table 2 below). The rationale for these caps was to limit the supply to be bid out and therefore increase
the level of competition among the different technologies and potential bidders.
The tenders for different technologies were held simultaneously. Interested parties could bid for more than one project and more than one
technology. Projects had to be larger than 1 MW, and an upper limit was set on bids for different technologies—for example, 75 MW for
a photovoltaic project, 100 MW for a concentrated solar project and 140 MW for a wind project. Caps were also set on the price for each
technology (at levels not dissimilar to NERSA’s 2009 REFITs). Bids were due within three months of the release of the RFP, and financial
close was to take place within six months after the announcement of preferred bidders.
The RPF was divided into three sections detailing: 1) general requirements, 2) qualification criteria, and 3) evaluation criteria. The documents
also included a standard Power Purchase Agreement (PPA), an Implementation Agreement (IA) and Direct Agreements (DA). The PPA
was to be signed by the IPP and Eskom, the off-taker. PPAs specified that the transactions should be denominated in South Africa Rand
and that contracts would have 20-year tenures from COD. The IAs were to be signed by the IPPs and the Department of Energy (DOE)
and effectively provided a sovereign guarantee of payment to the IPPs, by requiring DOE to make good on these payments in the event of
an Eskom default. The IA also placed obligations on the IPP to deliver economic development targets. The DAs provided step-in rights for
lenders in the event of default. The PPA, IA and DA were non-negotiable contracts and were developed after an extensive review of global
best practices and consultations with numerous public and private sector actors. Despite some bidder reservations regarding the lack of
flexibility to negotiate the terms of the various agreements, the overall thoroughness and quality of the standard documents seemed to
satisfy most of the bidders participating in the three rounds.
Bids were required to contain information on the project structure, legal qualifications, land, environmental, financial, technical and economic
development qualifications. Bidders had to submit bank letters indicating that financing was locked-in – highly unusual and basically a way
to outsource due diligence to the banks. Effectively this meant that lenders took on a higher share of project development risk and this
arrangement dealt with the biggest problem with auctions – the “low-balling” that results in deals not closing.
The developers were expected to identify the sites and pay for early development costs at their own risk. A registration fee of ZAR15,000
(US$1,875) was due at the outset of the program. Bid bonds or guarantees had to be posted, equivalent to ZAR100,000 (US$12,500) per
megawatt of nameplate capacity of the proposed facilities, and the amount was doubled once preferred bidder status was announced.8 The
guarantees are to be released once the projects come on line or if the bidder was unsuccessful after the RFP evaluation stage.
8
An exchange rate of ZAR8/USD is used in the build-up to the REIPPPP and for Round 1 when the first agreements were signed. For Rounds 2 and 3, the
exchange rate at the time of signing agreements is used to calculate project prices and investment values.
Government Design and Management of the REIPPPP Tender Process 112
Government Design
and Management
Project selection was based on a 70/30 split between price and economic development considerations. REIPPPP was able to adjust the
normal government 90/10 split favoring price considerations in the procurement selection process. An exemption was obtained from the
Public Preferential Procurement Framework Act in order to maximize economic development objectives.
A regulatory review determined that the REIPPPP would not be subject to National Treasury Regulation 16 for evaluating and approving
public-private partnerships (PPPs). The PPP regulations reflect national legislation and are consistent with best practice in OECD countries.
By the same token, they require a complicated, time-consuming, and expensive review process that must be implemented by expert
consultants using specialized analytical techniques (like “public sector comparators”) to confirm value-for-money (VFM), and must
include wide ranging consultation with stakeholders, as well as frequent interaction with National Treasury’s PPP Unit. The national PPP
regulations call for 24 elaborate preparation steps, as well as four “opinions” on the process issued by National Treasury at different stages
of preparation, based on inputs from National Treasury’s PPP Unit. The process is required regardless of the size or nature of the PPP project,
and has been characterized by some private sector operators and investors as cumbersome and slow.
This PPP regulatory process was not applicable to the REIPPPP because Eskom, which signs the power purchase agreements with private
operators, is considered a state-owned enterprise rather than a government agency, and therefore its purchase of power is not subject to
National Treasury’s PPP regulations (even though the procurement program was formally the responsibility of DOE). In order for the DOE
to demonstrate value-for-money, and to fulfill the requirements of Clause 9 of the New Generation Regulations, the second bid window
requested bidders voluntarily to submit their own arguments documenting VFM.
The timing of the initial round of bidding was also advantageous for the program. The renewable energy sector is highly competitive given the
diversity of sources, the modular nature of most of the technologies, and the number of project developers. Manufacturing of components
for most renewable energy technologies involves relatively mature, existing technologies and established industries. But, for several years
these industries have been experiencing global over-capacity and intense competition that has resulted in very thin profit margins, if profits
are generated at all. As a result, the industry continues to experience consolidation, the emergence of increasingly vertically integrated
supply chains, and the steady movement of manufacturing firms into project development. Furthermore, renewable energy markets were in
decline in Europe, and developers were looking for new opportunities in emerging markets. All of this led to intense interest on the part of the
global renewable energy industry in REIPPPP and growing levels of competition as the bidding progressed.
Despite favorable market dynamics, there was still some concern among prospective bidders at the start of the bidding process. However,
the quality and detail of the bid documentation, the clarity provided during the bidder’s conference, as well as the on-going dialogue during
the first half of 2011, seemed to alleviate some of the nervousness that had developed over the previous two years. Investors and operators
also particularly liked the structure of the pricing, as the REIPPPP tariff caps were at levels similar to the earlier feed-in tariffs.
The first round of bids was received in late 2011 and the DOE IPP unit used a group of international and local experts to assess the bids.
Many of these advisors had been involved in the initial design process. Given the scale of the investments, the competition anticipated, and
the reputational risk identified, security and confidentiality surrounding the evaluation process was extremely tight with 24-hour voice and
CCTV monitoring of the venue. Approximately 130 to 150 local and international advisors were used to develop the RFP and evaluate the
bids in the first round, at a total cost of approximately US$10 million.
12 Government Design and Management of the REIPPPP Tender ProcessYou can also read