SOUTH AFRICA Social Enterprise Ecosystem Country Profile
←
→
Page content transcription
If your browser does not render page correctly, please read the page content below
Social Enterprise
Ecosystem Country Profile
     SOUTH AFRICA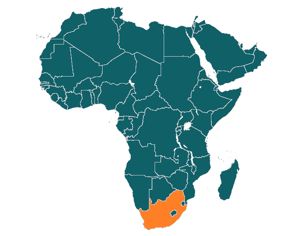
Acknowledgments
This report was prepared by Cristina Navarrete Moreno (Private Sector Development
Specialist) and Natalia Agapitova (Senior Economist). However, without the contribution
of several colleagues the report would have not reached its final form. Therefore, we
are grateful for the help of Elaine Tinsley, Belen Sanchez, Marta Milkowska, Ergun
Ertekin, Juan Carlos Guzman Hidalgo, Branislav Kralik, Niharika Hanglem, and Pallavi
Shrivastava.

The report uses data and information gathered by Endeva and BoP Learning Lab. We
wish to acknowledge the great inputs received and the particular effort of Sara Balan
(project manager, BoP Learning Lab) and Christina Tewes-Gradl (project director,
Endeva). Sharon Fisher provided editing and design support.

Copyright © April 2017. The World Bank, 1818 H Street NW, Washington, DC 20433, USA. All rights reserved.

                                                                                                            2
Overview
In Sub-Saharan Africa, with 388 million people living on less than the poverty line of USD 1.90 per day
and rapid population growth, the challenge for the public sector to deliver services will only grow in
the coming years.1 So far, traditional actors, including governments, civil society, and the private sector
have been unable to solve the problem of providing essential, quality services, such as access to water,
energy, sanitation, education, and health care.
In this context, social enterprises (SEs) have emerged as a new type of development actor with the
potential to help solve the service delivery gap. During the last decade, SEs in Africa increasingly
address service delivery gaps for the poor in novel ways, with Kenya and South Africa among the
leading countries in the SE sector.
SEs are privately owned organizations—either for-profit, non-profit, or a hybrid of the two—that use
business methods to advance their social objectives. They focus on maximizing the social and
environmental impact for their target beneficiaries in contract of maximizing the short-term profits for
their shareholders and private owners. Due to their strong presence and understanding of local
communities, SEs are often able to reach underserved populations through flexible and innovative
business models.
Although positive examples abound, SEs have not yet fully realized their potential in Africa. With
variations across sectors, many SEs struggle to scale-up and develop sustainable models. SEs face high
barriers that are often aggravated by the difficult markets they serve. Common challenges include
unconducive regulation and policy, lack of financing solutions, weak infrastructure and human capital,
and a lack of information and networks. In addition, SEs are not organized as a sector and fall between
traditionally recognized public and private organizations. The public sector often does not play a
catalytic role.
The SE ecosystem is comprised of actors, institutions, and network that support SEs in contributing to
development goals. In many developing countries, the SE sector still lacks a supportive ecosystem, or
enabling environment, which would allow these organizations to thrive and grow. Four ecosystem
dimensions capture the enabling environment for SEs: policy and regulation, financing solutions,
infrastructure and human capital, and information and networks. Where these dimensions are
improved, SEs can significantly contribute to a service delivery challenge.
In developing countries and in particular in Africa, there is limited data collected and analyzed on
existing supporting factors, challenges, and opportunities for the SE sector. This report profiles how
SEs across seven African countries—Kenya, Malawi, Rwanda, South Africa, Tanzania, Uganda, and
Zambia—address service delivery gaps for poor populations and assesses the status of their SE
ecosystems. The report targets development practitioners involved in policy design and
implementation who are interested in new ways to address service delivery challenges. These specific
examples of challenges and opportunities for SEs in Africa can highlight ways to increase the
sustainability and scale of current and future SE business models.
1
Beegle, Kathleen; Christiaensen, Luc; Dabalen, Andrew; Gaddis, Isis. 2016. Poverty in a Rising Africa. Washington, DC:
World Bank. https://openknowledge.worldbank.org/handle/10986/22575.
3Geographic
Figure 1. Focus countries in this report
The report focuses on seven African countries: Kenya,
Malawi, Rwanda, South Africa, Tanzania, Uganda, and
Zambia (Figure 1). These countries represent:
• Different levels of socio-economic development.
• Different stages of SE development and ecosystem
support.
• Two regional clusters to test for regional patterns
and potentially allow regional knowledge sharing
and learning.
n Kenya
Service Sectors n Malawi
The report covers four basic service areas: education, n Rwanda
energy, health, and water and sanitation. These basic n South Africa
services lay the foundation for alleviating poverty, n Tanzania
reducing income inequalities, and ultimately contributing n Uganda
to each country’s socio-economic development. n Zambia
Beneficiaries
The report considers target beneficiaries for SE activities as underserved, low-income populations
representing the Base of the economic Pyramid (BoP), living on less than USD 1.90 per day in 2015 (the
World Bank Group’s poverty line at the time of starting the research).
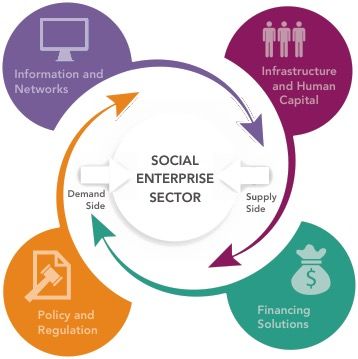
Analytical Framework
In this report, the ecosystem framework consists of four parts: demand, supply, SE situation, and
ecosystem dimensions. SEs are at the heart of the model (Figure 2).
SE opportunities for providing services depend on the Figure 2. Ecosystem framework
demand by the BoP and the existing supply situation.
The four ecosystem dimensions influence the ability of
SEs to operate effectively and scale up. The ecosystem
framework guides the analysis at all levels: country,
service sector, and service sub-sector. Table 1
describes each element in more detail.
4Table 1. Four parts of the ecosystem framework
Demand • BoP needs: What are the development challenges and unmet needs for the BoP?
• BoP market: What are the volume and dynamics of the current BoP market?
What are the main challenges related to the 4 A's: awareness, accessibility,
affordability, and acceptance?
Supply • Public supply: What is the structure and level of current public supply for the
BoP? What are supply gaps and challenges?
• Non-public supply: What is the structure and level of current non-public supply
for the BoP? For example, from NGOs or the private sector.
• Donors: What role do donors play in the sector?
SE situation • SE understanding and presence: How many SEs are there? How are they
perceived?
• Type: How big are they? How are they organized? What is their level of maturity?
• Value chain: What are typical activities in the value chain? In which service
sectors and service sub-sectors are SEs active?
Ecosystem Ecosystem dimensions capture the enabling environment for SEs. This includes
dimensions dimensions that are specific to SEs and dimensions that determine the viability of
market-based approaches more broadly.
• Policy and regulation: What are the main policy drivers or barriers for SEs?
Including policy strategy, regulation, and level of public-private collaboration.
• Financing solutions: What are the sources of funding for SEs as well as for their
clients? Including commercial funding, consumer finance, and grant funding.
• Infrastructure and human capital: What are important infrastructure issues that
affect the operations of SEs? What is the skill level available for SEs? Is the sector
able to attract relevant talent?
• Information and networks: What organizations, incubators, networks, training,
etc. are available to build awareness, knowledge, and capacity among SEs, or
advocate for SEs?
Data Collection
Endeva and BoP learning labs conducted desk and field research to map the SEs and ecosystem
dimensions. They based the SE mapping on publicly available resources and desk research, which was
supplemented with semi-structured interviews with SEs and local stakeholders representing different
parts of the ecosystem. Accordingly, the sample size for each country varies in the report.
The information is based on:
• 59 interviews with SEs
• 140 interviews with stakeholders
• Interviews with BoP service users
• A database with 271 SE examples
5Social Enterprise Ecosystem Country Profile
SOUTH AFRICA
Social enterprise (SE) products and services could help address gaps at the bottom of the pyramid (BoP) in
South Africa’s health, education, and energy sectors. The main challenges are tensions between the public
and private sectors and significant funding and skills gaps.
Policy and Regulation Infrastructure and Human
• The general policy environment is favorable to SEs. Capital
• SEs face no major regulatory barriers. In some • South Africa has the most advanced infrastructure
circumstances they can qualify for tax incentives. in Africa, but access to services for low-income
• Public-private partnerships (PPPs) are common. communities remains a challenge.
• The market for skilled professionals is highly
competitive.
Supply to the
Demand by the
SE Situation BoP
Bottom of the • Social enterprise is a label
• Public service supply has
Pyramid (BoP) with appeal but no clear
definition or rigorous use.
improved, but beneficiaries do
• Despite progress, 16.5 not feel it is adequate.
percent of South Africans still
• SEs are often home-grown, • NGOs provide a wide variety of
live in extreme poverty. including in low-income social services, including in the
• BoP market demand for communities. health and education sectors.
better service delivery is high • SEs are emerging in the Corporations contribute
for energy, medium for health health, education, and energy through corporate social
and education, and low for sectors, but their presence is responsibility programs .
water and sanitation. • Donors contribute significantly
still limited.
to service supply, especially in
the health sector.
Finance Information and Networks
• Large corporations provide grants and soft loans to • Various organizations offer educational programs,
SEs as part of the CSR strategy. funding, and business support for SEs.
• Commercial credit is available, and there is a small • Data on the BoP market are available, and a few
but active network of impact investors. specialized organizations conduct research.
• Microfinance institutions extend consumer • A small number of networks and SE communities
financing, but overindebtedness is a growing exist, though their efforts are not coordinated.
concern.
6Study background Country Facts
This profile is part of the ecosystem mapping of SEs—
nonpublic providers of services to low-income populations • Population: 54 million (2014)
based on a sustainable revenue model and a social • Number of people living on less than
mission. It identifies key elements of the SE ecosystem in USD 1.25 a day: 4.6 million (2011)
four sectors—education, energy, health, and water and • GDP per capita (purchasing power
sanitation—supplementing the individual sector profiles parity): USD 6,800 (2014)
and a report with cross-cutting analysis. • Average annual GDP growth 2010–
14: 2.5 percent
The profile is based on desk research and interviews with • Maturity level of SEs: Emergent
local experts and SEs conducted in the summer of 2015. Source: World Development Indicators.
The list of people interviewed appears at the end of the
profile.
NEED AND DEMAND FOR SERVICES Figure 3. Key indicators of access to basic services in
South Africa has a population of 54 million South Africa (Source: World Bank data)
people, almost 60 percent of whom are under
the age of 30. Extreme poverty is widespread: In Cause of death, by 48.5
2011, 4.6 million people lived on less than USD communicable diseases… 62
1.25 a day, and 13.4 million lived on less than Improved water source (% of 95.1
USD 2 a day. The incidence of poverty is much population with access), 2012 64
higher in rural areas (77 percent) than in urban
Improved sanitation facilities 74.4
areas (39 percent). (% of population with… 30
Access to electricity (% of 82.7
Although much progress has been made over population), 2010 35
the past two decades, driven largely by the
School enrollment, primary 100.8
public sector, the need for service delivery to the (% gross), 2013 100
base of the pyramid (BoP) remains high across all
four focus sectors. Access to good-quality
South Africa Sub-Saharan Africa average
healthcare and education is very limited for the
BoP. Public sector healthcare is largely free for
the poorest patients, but the system is overburdened and underresourced. The public educational
system suffers from significant structural weaknesses, including low-quality teaching and a shortage
of adequate learning materials.
With the exception of water and sanitation, which presents political challenges, there are significant
market opportunities for SEs to address these gaps and complement existing offerings. SEs could help
increase levels of access to basic services and provide more affordable services and products to
populations that already have access but are often unable to make use of it because of competing
pressures on household cash flow.
BoP market demand for better service delivery is high for energy, medium for health and education,
and low for water and sanitation. The energy sector is arguably the most promising sector for SEs, as
South Africa is grappling with an energy supply crisis in the public sector and the country is currently
one of the fastest-growing markets in the world for renewable energy. Evidence suggests that the BoP
is willing to pay for reliable products and services.
7The health sector is also promising. A small number of SEs already serve the market, and the
government, despite some reservations, has shown increasing willingness to allow SEs to complement
the provision of free health care by the public sector with market-based approaches. The success of
several user-fee models also suggests a willingness to pay for good-quality health care services at the
BoP.
The education sector also presents opportunities. A growing number of low-cost private schools are
providing affordable education and attracting investors.
Water and sanitation is a politically sensitive sector in which few, if any, for-profit enterprises are
currently willing to invest. The overwhelming perception is that water and sanitation are basic services
that should be provided by the public sector free of charge at point of use. As a result, there is almost
no willingness at the BoP to pay for such services.
SUPPLY OF SERVICES
Supply by the Public Sector
The public sector has made impressive and measurable efforts to improve access to electricity, water
and sanitation, and housing for low-income communities over the past 20 years. Almost 60 percent of
government spending goes to social services, including housing, health, and education, according to
the South African Treasury. Beneficiaries’ expectations exceed what the state can deliver, however, as
evidenced by the growing frequency of “service delivery protests” around the country.
South Africa still suffers from extremely poor education outcomes, high unemployment, and slow
economic growth (which averaged just 1–3 percent a year between 2011 and 2015). Relations between
government and business are characterized by mutual distrust and criticism, making it difficult for the
two sectors to agree on a common vision and shared objectives.
The Role of Donors
With total aid flows reaching USD 1.4 billion in 2014, international donors, including foreign
governments and NGOs, contribute significantly to service delivery at the BoP in South Africa,
especially in social services and healthcare. The Department of Health has a formal structure of
collaboration with NGOs called the Partnership for the Delivery of Primary Health Care Programme.
Supply by NGOs and Other Non-state Actors
South Africa has a strong ecosystem of private organizations that support service provision to the BoP.
NGOs and civil society organizations (CSOs) are very active. The country has an estimated 100,000
registered nonprofits, most of which focus on social services and education (Sangonet 2013).
The corporate sector also makes a significant contribution to service delivery, both by sponsoring
corporate social responsibility (CSR) programs and by developing inclusive business models. Total CSR
spending by the top 100 listed companies in South Africa in 2014 was estimated at more than USD 700
million (Trialogue 2014).
Supply by SEs
The desire in South Africa to address the country’s many socioeconomic challenges makes SE a
fashionable label. As a result, many organizations define themselves as SEs, whether they fit the
description or not. Many others that may not explicitly use the term have business models that focus
on low-income communities.
Many examples of organizations that fit the World Bank’s description of a SE (financially self-sufficient
entities with a specific social purpose) are operating in South Africa, in tourism, manufacturing,
8healthcare, energy, and financial services (table 1). One of the main distinguishing features of the SE
landscape is that it is mainly home-grown, driven by local motivation to address South Africa’s societal
and developmental challenges. Indeed, a number of SEs have emerged from low-income communities
themselves. Most SEs are small operations (1–10 employees) and have a local rather than a national
focus.
Table 2. SE activity level and examples in South Africa across the sectors
Sector Level of activity Example
Education Spark schools are a network of primary schools providing
accessible, high-quality education in the Johannesburg area. The
company plans to expand in the Western Cape in 2016.
Energy GIMAC provides off-grid, renewable energy products and services
in Gauteng Province. It plans to expand to Mpumalanga and
Limpopo provinces.
Health Iyeza Express delivers medications in the poor townships around
Cape Town via bicycles.
Water and There is no SE activity in the water and sanitation sector in South
sanitation Africa. Access to water and sanitation are legally enshrined as basic
No activity services and are considered off-limits for commercial approaches.
The sector is politically sensitive and unlikely to attract any private
sector investment under present conditions.
Social Enterprise Ecosystem
POLICY AND REGULATION
Policy strategy
Although the signals it sends out are sometimes mixed, the South African government has often
expressed an interest in working with the private sector to promote service delivery to the BoP.
The National Development Plan, the government’s key development policy framework, covers
almost every aspect of national life, including the economy, healthcare, infrastructure,
education, national security, and “nation building.” It expresses a commitment to strengthening
financial services, reducing the cost of living, and developing a culture of business innovation. It
also makes an explicit commitment to review regulations for small and medium-size enterprises,
in order to reduce the regulatory burden and streamline the business-creation process. The
National Development Plan is the object of tense internal debate within the governing alliance,
however. As a result, it is not being fully implemented, remaining largely a guiding framework
and a wish list rather than an actual set of clear policies.
The structural and institutional landscape as well as the nature of the socioeconomic challenges
South Africa faces are likely to result in the continuation of benign or even favorable policies and
regulatory environment for SEs. The tensions and lack of trust that have characterized relations
9between government and the corporate sector over the past decade may arguably strengthen
the case for SEs, which explicitly seek to combine financial and social benefits.
Regulation
SEs in South Africa face no major regulatory barriers. In some circumstances they can qualify for tax
incentives. The term SE carries is not defined in law; SEs can register as for-profits, nonprofits, or
a combination of both (a for-profit company can have a nonprofit branch or own a nonprofit
entity). The two most relevant pieces of legislation are the Companies Act of 2008 (a major
overhaul of South African company law, partly in response to the emergence of new hybrid forms
of enterprise,) and the Non-Profit Organizations Act of 1997, which governs NGOs and CSOs.
The closest South Africa has to a legal form of SE is a nonprofit company (NPC), the basic rules of which
correspond closely to the definition of SE or social business as proposed by Mohammed Yunus (2009):
a “non-loss, non-dividend company in which profits are reinvested in the business itself.” South African
law defines an NPC as “a company incorporated for public benefit or other object relating to one or
more cultural or social activities, or communal or group interest.” The income and property of such an
entity are not distributable to its members or owners and must be used to “advance the purpose for
which it was created.” The official view of NPCs as strictly nonprofit is reflected in the fact that they
register with the Department of Social Development rather than the Department of Trade and
Industry, as for-profit enterprises do.
Labor laws apply to all formally registered employers in South Africa. There are no minimum capital
requirements to start a business, and SEs are eligible for the same tax breaks or incentives as any other
businesses. Donations and grants of up to 10 percent of an enterprise's taxable income are exempt
from taxation. Some NGOs may qualify as public benefit organizations (PBOs), which gives them full
tax-exempt status as long as they derive their income purely from public funding and grants.
SEs registered as nonprofits are subject to the same rights and responsibilities as any nonprofit
organization registered in South Africa. There are few legal restrictions on NGOs (or SEs). Rules and
public practices do not prevent NGOs from developing hybrid income models.
Public-private collaboration
South has a long tradition of public-private enterprises (PPPs) and (despite tensions) collaboration
between the public and private sectors. Since 1997 an average of two new PPPs have been signed a
year (OECD 2015). A dedicated government website (www.ppp.gov.za) provides a list of past and
current PPPs, at all levels of government (local, provincial, and national). PPPs and the legislation
affecting them are explicitly defined in Treasury Regulation 16 of the Public Finance Management Act,
which established a dedicated PPP unit.
The main forum for public-private dialogue is the National Economic Development and Labour Council
(NEDLAC), formed in 1994, which brings together the government, business, and organized labor. It
appears to have lost influence in recent years and has come under fire from business for allegedly
failing in its task to foster dialogue (Business Day 2015).
PPPs in South Africa may provide opportunities for social entrepreneurs. There is no evidence,
however, that any SE has yet benefited from or been an actor in any of the PPPs listed.
10FINANCING
Grant funding
Much grant funding in South Africa comes from businesses, the largest of which spent an estimated
USD 700 million on CSR in 2014 (Trialogue 2014). Although SE-related data are not available, some of
that money may have been channeled to them. South African corporations also invest in developing
inclusive business strategies. They support South Africa on Enterprise Development, one of the
components of Broad-Based Black Economic Empowerment (BBBEE), South Africa’s general economic
framework seeking to translate political freedom into economic empowerment for South Africa’s black
majority.
The National Youth Development Agency (NYDA), a public organization, offers small grants and
business advice for entrepreneurs between the ages of 14 and 35. However, the organization has been
the object of severe criticism and allegations of mismanagement and poor results.
UnLtd South Africa is a nonprofit organization that provides financial and nonfinancial support to
individuals with innovative ideas for SEs. After completing 50 hours of training, mentoring, and access
to networks and business expertise, new SEs or SEs at the pilot stages can receive up to USD 1,600.
The organization helps projects at the early stages of development increase their impact and improve
their sustainability.
Commercial funding
Commercial credit is available in South Africa, and there is a small but active network of impact
investors. South Africa’s main commercial banks offer commercial credit to businesses, including SEs,
using the same financial criteria for all types of firms. This type of financing is available only to
registered enterprises with financial statements that show good prospects of return on investment for
the bank, however. Moreover, credit conditions for small and microenterprises have tightened over
the past few years, because of growing concerns in South Africa about rising debt and default rates.
The public sector offers some funding to nonpublic service delivery, mostly in the form of soft loans
(loans made on terms very favorable to the borrower), through various development finance
institutions and agencies aimed at small-scale entities. The Industrial Development Corporation (IDC)
and the Development Bank of Southern Africa (DBSA) are large South African development finance
institutions with mandates to provide funding to medium- or large-scale ventures across Southern
Africa. Small businesses, including SEs, can receive support and funding through the Small Enterprise
Finance Agency (SEFA), which falls under the Department of Trade and Industry.
South Africa has a small but active and growing network of impact investors who work with both small
and microenterprises and SEs. They include E2 E-square, an offshoot of Allan Gray, one of South
Africa’s largest asset managers, which provides funding and venture capital for SEs located in South
Africa; Thundafund, which has already funded almost USD 300,000 of SE projects and uses
crowdfunding as a way of attracting capital; Greater Capital, one of the largest impact investment
organizations in South Africa as well as the founder of the South African Impact Investing Conference
(SAIIN); Impact Trust, one of South Africa’s first providers of impact bond funding, Impact Amplifier,
which acts more as a service provider to impact investors. The Bertha Centre for Social Innovation
provides support for SEs in South Africa. It has partnered with Mustard Seed, a global impact
investment fund, to provide local SEs with pitching opportunities for funding and investment
Consumer finance
Microfinance institutions play a significant role in channeling consumer finance to South Africa’s lower
income segments. KPMG, an international auditor, estimates the total face value of loans through
11microfinance institutions at USD 3.2 billion in 2013. There is an intense debate over whether the impact
of microfinance institutions has been positive or negative reducing poverty (Batemen 2013), and there
is increasing concern about the level of consumer debt, especially among poor South Africans.
There are examples of collaboration between microfinance institutions and SEs—or microfinance
institutions that brand themselves as SEs. One of the best known is the Kuyasa Fund, which provides
small home improvement loans to people who live in social housing. It reports disbursing USD 22
million since it was established, in 1999.
Partly because of rigid regulations and the strong market penetration of commercial banks, mobile
money has been much slower to take off in South Africa than in some other emerging markets, such
as Kenya and Tanzania.
INFRASTRUCTURE AND HUMAN CAPITAL
Infrastructure
South Africa’s infrastructure is the most advanced in Africa, but access to services for low-income
communities remains a challenge. Roads, railways, and other transportation infrastructure are mostly
world class. IT networks are generally good, but the high cost of mobile phone and Internet services is
an obstacle for SEs.
The reliability of electricity supply has declined significantly over the past few years; since 2014 regular
power cuts across the country have had a negative impact on economic growth. The energy crisis has
created opportunities in the renewable energy sector, including for SEs. South Africa is the fastest-
growing market for renewable energy (including solar energy) in the world.
Human capital
Anecdotal evidence suggests that financial compensation levels in the nonprofit sector are competitive
in comparison with traditional private sector, especially at senior levels. Employees and entrepreneurs
are generally keen to be seen as having a positive social impact on society, and companies spend
significant resources on publicizing their efforts in this regard.
Several major academic and nonprofit institutions offer social entrepreneurship and social innovation
programs as part of their curricula. The Raymond Ackerman Academy, with campuses in Johannesburg
and Cape Town, trains young entrepreneurs from disadvantaged backgrounds in social
entrepreneurship and enterprise development. The attractiveness of SEs to professionals depends on
the weights they place on personal financial success versus contribution to society.
INFORMATION AND NETWORKS
Capacity building
A number of organizations provide educational programs, funding, and business support for SEs. SE
“incubators” include Hubspace, based in Cape Town; the Innovation Hub, in Johannesburg; and
LaunchLab, attached to the University of Stellenbosch in the Western Cape. Hubspace describes itself
as an “impact business that provides the most talented and promising start-up entrepreneurs in South
Africa with access to a shared work environment, advisory services, capital and a collaborative network
of professionals, interns, trainers and mentors.” The Innovation Hub focuses on bioscience and green
and sustainable energy.
Other organizations provide more generic capacity-building and technical assistance to SEs in South
Africa. Organizations such as The Business Place, funded by CSR programs, provide skills training and
12educational programs. Various educational programs for small and microenterprises, such as Shanduka
Black Umbrellas, seek to improve the climate for enterprise development in South Africa.
Research and data
Several private, public, and civil society organizations gather information about SEs. They include
Eighty20, which collects quantitative data and provides strategic insights on South African consumer
markets, including BoP markets; Wazimap, which compiles census-based data down to the district
level; the Unilever Institute of Strategic Marketing, attached to the University of Cape Town, which
compiles in-depth quantitative and qualitative data on BoP markets; and the Bertha Centre for Social
Innovation, which conducts research on social innovation, SEs, and BoP markets. The BoP Learning Lab
South Africa, part of a global network of similar labs, organizes regular events for practitioners and
local entrepreneurs and disseminates information on innovative business models, including SEs.
Coordination and advocacy
The Gordon Institute of Business Science’s Network for Social Entrepreneurs (NSE) seeks to bring
together social entrepreneurs to create synergies using “business principles to build sustainable and
high-impact initiatives.” The African Social Enterprise Network (ASEN), formed in 2008, includes more
than 3,800 social entrepreneurs across Africa, mostly in South Africa. The Bertha Centre for Social
Innovation at the Graduate School of Business at the University of Cape Town is the first academic
institution in Africa dedicated to social entrepreneurship. It provides a range of services related to
inclusive business, social entrepreneurship, and investment in the BoP. Educational programs include
inclusive innovation studies and social innovation labs dedicated to providing students with in-depth
understanding of inclusive business. The Bertha Centre also funds research on healthcare, education,
and financing mechanisms.
CONCLUSIONS AND RECOMMENDATIONS
South Africa continues to grapple with poverty, inequality, and unemployment. It is eager to address
the needs of the poor in a more efficient and effective manner. The country has significant financial,
human, and physical resources on which to build a dynamic, innovative, and efficient SE ecosystem.
An active local support ecosystem and emerging SE presence already exists, although efforts are
scattered and generic and lack clear political support.
To improve the environment for SEs in South Africa, the following short- and medium-term
interventions have been identified:
• Encourage policy makers to create a legal definition and legal framework for SEs, possibly with
incentives. Such an effort would create public awareness and encourage a national dialogue
on the role of business and how financial and social goals can be better aligned.
• Support existing initiatives, programs, and capacity building, including at universities, research
organizations, NGOs, and corporations.
• Channel funding and investment to existing and potential SEs in priority sectors, including
energy, health, and possibly education, either directly or indirectly through the existing
network of funders in South Africa and leveraging growing presence of impact investor funds.
REFERENCESS
Bateman, Milford. 2013. “Microcredit Has Been a Disaster for the Poorest in South Africa.”
November 19. http://www.theguardian.com/global-development-professionals-
network/2013/nov/19/microcredit-south-africa-loans-disaster.
Business Day. 2015. “Editorial: Nedlac’s Relevance in Question.” June 23.
13Government of South Africa. 2011. “PPP Projects Signed in Terms of Treasury Regulation 16, as at
November 2011.” Whyhttp://www.ppp.gov.za/Documents/Closed percent20PPP
percent20Projects percent20as percent20at percent20December percent202011.pdf.
KPMG. 2013. Microfinance and Poverty Alleviation in South Africa.
http://www.kpmg.com/za/en/issuesandinsights/articlespublications/financial-
services/pages/microfinance-and-poverty-alleviation-in-south-africa.aspx.
OECD (Organisation for Economic Co-operation and Development). 2015. Presentation on South
African Public-Private Partnership Unit.
Sangonet. 2013. “The South African Nonprofit Sector: Struggling to Survive, Needing to Thrive.” April
9. http://www.ngopulse.org/article/south-african-nonprofit-sector-struggling-survive-needing-
thrive.
Trialogue. 2014. 2014 CSI Handbook, 17th ed.
Yunus, Mohammed. 2009. Creating a World without Poverty: Social Business and the Future of
Capitalism. New York: Public Affairs.
INTERVIEWS
Dominick Marshall-Smith, Social Entrepreneur, Newberry House Group
Patrick Schofield, CEO, Thundafund
Peter Schrimpton, Founder, Heart Capital
Adelaide Sheikh, Acting Manager, Centre for Social Entrepreneurship and Social Economy,
University of Johannesburg
Additional sector interviews have been completed and feed into the country profile.
14You can also read