SOUTH AUSTRALIA'S ROAD SAFETY STRATEGY 2020 - Towards Zero ...
←
→
Page content transcription
If your browser does not render page correctly, please read the page content below
SOUTH AUSTRALIA’S ROAD SAFETY STRATEGY 2020

Foreword
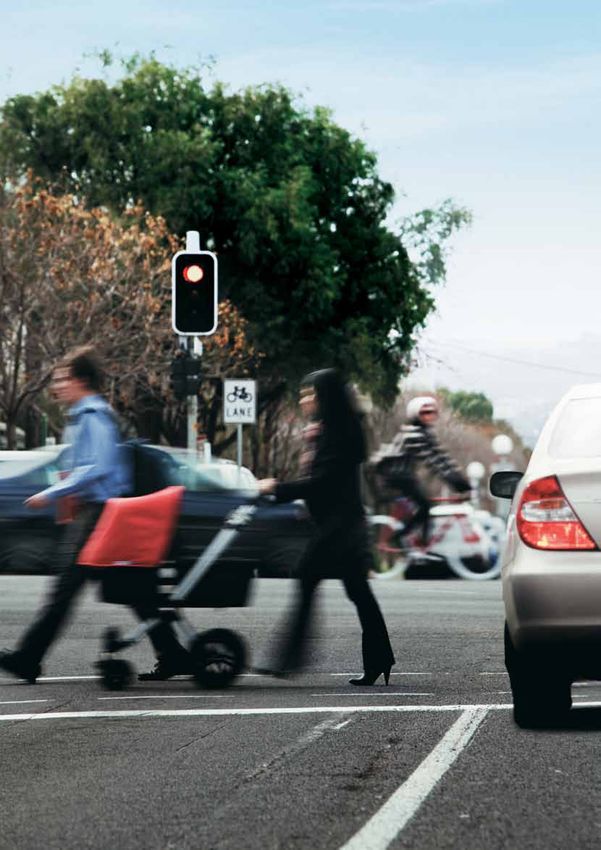
This strategy is about you.
It’s about every driver, every
motorcyclist, every pedestrian,
every cyclist all having respect for
each other.
It’s about thinking safely and changing our behaviour
every time we venture onto our roads.
It’s about admitting to ourselves that creeping over the
speed limit - even just a little – is not acceptable, that
driving after drinking is just not on, that running a red
light is risky dangerous driving.
It’s about not taking drugs and driving, not texting,
taking or making a mobile phone call in the driver’s
seat.
We all think we’re good drivers. Most of us are,
but we all make mistakes, sometimes only minor
inattentive errors of judgement, momentary lapses in
concentration - mistakes which can have disastrous
consequences on the lives of those around us.
We’ve seen some encouraging reductions in deaths
and serious injuries on our roads over the past decade,
but progress has slowed. It is time for us to set new
and ambitious targets and make difficult decisions.
This strategy aims to reduce our annual road toll to less
than 80 fatalities and 800 serious injuries by 2020.
I believe this is an achievable target.
We could go a long way to getting there right now
if every driver and their passengers automatically
buckled up their seat belts as soon as they sat down,
because over one third of vehicle occupant fatalities
involve people not wearing a seat belt. The decisions
people make when they get in a car are important.
We will need to make some decisions that not everyone
will agree with, but we must do everything possible to
remove dangerous driving behaviour from our roads.
I believe we can collectively all make a difference, but
every dollar and every decision needs to count.
This strategy was developed in a spirit of shared
responsibility with contributions from your
communities, local government, road safety experts
and interest groups.
I commend the strategy to you and ask that you take
the time to read it and make a conscious decision to
help us all bring down the road toll through your own
personal attitude towards your driving behaviour.
Hon Tom Kenyon MP
Minister for Road Safety Port Wakefield Road
2 | Towards Zero Together - South Australia’s Road Safety Strategy 2020
No death or serious injury on our roads is
acceptable or inevitable, and the whole
South Australian community must work
together to address the trauma caused by
everyday use of the roads – regardless of
the circumstances or the people involved.

                 Towards Zero Together - South Australia’s Road Safety Strategy 2020   | 3
TOWARDS ZERO TOGETHER
No death or serious injury on our roads is acceptable or
inevitable, and the whole South Australian community must work
together to address the trauma caused by everyday use of the
roads – regardless of the circumstances or the people involved.
Road safety is a challenge for everyone involved in less than 80 fatalities and less than 800 serious
using, designing and managing the road transport injuries per year by 2020. This is the minimum
system - not just people involved in crashes. Some improvement, and we will strive to do better.
changes can be made immediately but others
may take many years to achieve. 2020 Targets
Fatalities less than 80 per year
Crashes may still happen on the road as people
(4.5 per 100 000 population)
using the road transport system make mistakes
or poor choices. However, safe choices should
Serious less than 800 per year
be the easiest ones to make and mistakes should
Injuries (45 per 100 000 population)
not result in death or serious injury.
2020 Targets This strategy will be supported with action plans
This strategy sets the direction for reducing serious that set out priority actions that will be undertaken
casualties during the decade by at least 30% – to towards achieving the targets.
Figure 1 Road deaths and serious injuries, South Australia, 1981-2010
300 4000
3500
250
3000
200
2500
Number of Number of
Fatalities 150 2000 Serious
Injuries
1500
100
Fatalities
1000
Serious Injuries
50
500
0 0
1981
1982
1983
1984
1985
1986
1987
1988
1989
1990
1991
1992
1993
1994
1995
1996
1997
1998
1999
2000
2001
2002
2003
2004
2005
2006
2007
2008
2009
2010
The average road toll for the years 1981-1983 was 252, which reduced to 155 for the period 2001-2003, then to 112
for the period 2008-2010. Similar reductions have been observed for serious injuries with an average of 3,104 from
1981 to 1983, reducing to an average of 1,126 between 2008-2010.
4 | Towards Zero Together - South Australia’s Road Safety Strategy 2020
Different mixes of intervention are possible,
but infrastructure safety improvements, speed
management and improved driver behaviour
and compliance will have the greatest potential
to significantly influence casualty reductions.
Continual improvements in vehicle safety will also
be felt over the course of the decade.

The National Road Safety Strategy
2011–2020 sets a target of at least a 30%
reduction in deaths and serious injuries
over the decade from an average 1,431 for
the years 2008-2010. Drawing from the
established safe systems approach to road
safety, it challenges Australians to build a
national culture of road safety by adopting a
new vision of a safe road transport system.
This strategy complements and supports the
national strategy. It gives local expression to
the vision and targets and discusses those
areas where South Australia most needs to
direct its efforts.

                                             Towards Zero Together - South Australia’s Road Safety Strategy 2020   | 5
Marla
          Figure 2 Fatalities and serious injuries by location, South Australia, 2008-2010 average

                   Metropolitan Adelaide
           53%     53% of serious casualty crashes
                   43 fatalities & 582 serious injuries
                   3.6 fatalities & 49.0 serious injuries         Coober Pedy
                   per 100 000 population

                   Inner Rural
           17%     17% of serious casualty crashes
                   27 fatalities & 178 serious injuries
                   13.9 fatalities & 91.6 serious injuries
                   per 100 000 population
yalla                                                                                                                   Lyndhurst
                                                                                               Roxby
                   Outer Rural                                                                 Downs
           30%     30% of serious casualty crashes
                   41 fatalities & 365 serious injuries
                   17.2 fatalities & 153.2 serious injuries
                   per 100 000 population

                                                                                                                            Wilpena

                                                         Ceduna

                                                                                                                Port
                            Clare                                                                             Augusta                       Yunta

                                                                                                                            Peterborough
                                                                                                            Whyalla

            Pt Wakefield                     Eudunda
                                                                                                    Renmark
aitland                                                                                                                         Eudunda
                                                                                                                                                    Renmark
                                             Nuriootpa
                                                                                                           Maitland
                                                                                      Port
                                                                                    Lincoln
                                                                                                                         Adelaide
on                                                                                                                                    Murray
                                                    Sedan                                                                             Bridge
                                                                                                                                                    Lameroo
                                                                                                           Kingscote         Victor
                                                                                                                             Harbor
             Adelaide
                                     Mt Barker
                                                         Murray
                                                         Bridge

                                                                                              Lameroo
               Yankalilla
                                                                                               National Highways
                                    Victor                                                                                                 Robe
                                    Harbor                                                     DTEI Maintained Roads

                   Primary Freight and Strategic Routes                                                                                              Mount
                   DTEI Maintained Roads
                                                                                                                                                    Gambier

          6 | Towards Zero Together - South Australia’s Road Safety Strategy 2020
During the last 30 years, South Australia has seen a Despite improvements there is still much more to
substantial reduction in the number of deaths and do with over 100 South Australians being killed
serious injuries due to road crashes. Many actions and over 1,000 seriously injured on average
have contributed to these improvements including: each year. These figures represent an enormous
>> Graduated Licensing Schemes for young amount of grief, suffering and loss as well as an
drivers. economic cost of about $1 billion each year for
the South Australian community.
>> Static and mobile driver testing for alcohol
and drugs. Evidence-based, system-wide changes to speed
limits reduced vehicle speeds and crashes
>> Increased use of seatbelts and child
that, together with other changes to the system,
restraints.
reduced road deaths by over 20% over the period
>> Mandatory alcohol interlock program. of the last strategy (2003-2010).
>> The introduction of a 50km/h default speed
The initiatives introduced in the last strategy will
limit in urban areas.
continue to deliver benefits for years to come, but
>> Increased and better targeted enforcement. substantial new initiatives that will significantly
>> A network of safety cameras at high risk reduce crash risks to many road users in the
intersections. community are now required to take us to the
next level of trauma reduction.
>> Black spot programs to improve sites with
poor crash histories.
>> Infrastructure safety programs such as road
shoulder sealing.
Road safety is a state-wide challenge with a
>> Increased numbers of 4 and 5 star safety
particular area of concern being the area
rated vehicles that provide better protection
outside metropolitan Adelaide but within
for occupants. 100km of Adelaide shown in Figure 2.
>> More vehicles fitted with Electronic Stability
Control (ESC) to assist drivers to avoid crashes.
Figure 3 Fatalities with major initiatives, South Australia, 1981-2010
2003 - 50km/h default urban speed limit introduced;
280 - Lowering of speed limit from 110 to
1987 - RBT doubled 100km in rural areas and 100km to
80km in Adelaide hills;
1988 - Red light cameras
introduced 2005 - Unlimited mobile RBT;
- Immediate loss of licence introduced;
230 - Enhancements to GLS
1981 - RBT introduced
1995 - Laser guns 2006 - Drug driving
introduced testing introduced
1996 - Laser guns tripled
180 2007 - Rural road safety
& RBT doubled
program commenced
1990 - Speed cameras 2010 - GLS changes
introduced - Child restraint
1991 - 0.05 BAC limit 2002 - State black spot laws
130 program commenced;
introduced
- Shoulder sealing
1999 - Advanced speed program commenced
cameras introduced 2009 - Mandatory alcohol
interlock scheme began
80
2000
2001
2002
2003
2004
2005
2006
2007
2008
2009
2010
1981
1982
1983
1984
1985
1986
1987
1988
1989
1990
1991
1992
1993
1994
1995
1996
1997
1998
1999
Towards Zero Together - South Australia’s Road Safety Strategy 2020 | 7
A New Approach
This strategy presents the view that road deaths and injuries are
not inevitable and society has a responsibility to prevent them.

Road safety is a community issue and the strategy              environment. It recognises that people will always
includes roles and responsibilities for everyone. It           make mistakes and poor choices often resulting
sets direction for a change in culture – a culture             in road crashes, but seeks to ensure that those
in which fatalities and serious injuries on our                actions do not result in a fatality or serious injury.
roads are not accepted as inevitable and which
                                                               These principles do not abrogate the individual
strives to prevent them from occurring. This
                                                               responsibility each one of us has to exercise
change in culture includes every driver, every
                                                               due care whenever we enter into the road
passenger, every pedestrian, every cyclist, every
                                                               environment. We have made major gains in
motorcyclist, every truck or delivery driver, every
                                                               reducing road trauma and further behavioural
bus or taxi driver, every individual responding
                                                               improvements are required. Every driver is
appropriately to safety rules and their ongoing
                                                               responsible and accountable not just the few
enforcement. This change in culture also includes
                                                               drivers who engage in extreme behaviours.
each organisation and part of society.
                                                               Every driver who creeps over the speed limit,
Those engaged in building and managing roads                   answers or uses a mobile phone, drives after
have a responsibility to provide a safe network,               drinking or drug taking, does not wear a restraint
manufacturers have a responsibility to design                  or who drives while fatigued is a dangerous driver.
and market the highest standard of safety in                   Drivers who drive while unlicensed or disqualified
their vehicles. Organisations and businesses                   demonstrate a total disregard for the safety of
purchasing vehicles have a responsibility to own a             others. They need to be removed from the road.
safe vehicle fleet, road users have a responsibility           Further enforcement efforts are needed to detect
to comply with the law, and enforcement agencies               drivers who engage in dangerous behaviours
have a responsibility to increase compliance. Most             which we know contribute to serious casualty
importantly the community has the responsibility               crashes.
to demand safe travel on our roads and support
                                                               Our traditional approach will not take us the rest
the actions that will make a difference.
                                                               of the journey. A new approach is necessary if we
There is a belief in the community that road                   are to continue to make gains and move towards
fatalities and serious injuries are the result of risk         a truly safe road system.
taking or extreme behaviour, and these crashes
                                                               A new approach is needed to fully recognise
can receive extensive media coverage. However,
                                                               the road environment as the essential building
research shows that in South Australia over half
                                                               block for a safe road transport system. Our new
of all fatal crashes, and 90% of injury crashes,
                                                               approach will seek to increase safety priorities
are the result of mistakes, inattention or common
                                                               in land use and transport planning decisions by
lapses in judgement. We want a system that
                                                               building connections with the planning process.
minimises injuries and their severity in the event
                                                               A major opportunity for integrating safety into
of road crashes.
                                                               planning is the development of the 30 Year Plan
The Safe System approach adopts a holistic                     for Greater Adelaide. Important steps will be to
view of the road transport system and the                      increase the involvement of local government in
interaction between people, vehicles and the road              building a safe system, and to ensure the road

8 | Towards Zero Together - South Australia’s Road Safety Strategy 2020
The Safe System approach to road safety is built on several key principles:

Human Factors – no matter how well we are trained and educated about responsible road use people
make mistakes and the road transport system needs to accommodate this.

Human Frailty – the finite capacity of the human body to withstand physical force before a serious
injury or fatality can be expected is a core system design consideration.

Forgiving Systems – roads that we travel on, vehicles we travel in, speeds we travel at, and
communities we live in need to be more forgiving of human error.

Shared Responsibility – everyone has a responsibility to use the road safely with organisations,
businesses and communities taking responsibility for designing, managing and encouraging safe use of
the road transport system.

environment provides the right signals to road                    directions as possible. Private organisations
users about the appropriate travel speed.                         all have a major role to play in building a safe
                                                                  system. A priority of this strategy will be to form
A new approach will assist in realising the benefits
                                                                  partnerships with those organisations with large
that technological advancements can offer to
                                                                  fleets of vehicles to find ways to prioritise safety
improve road safety. By accepting that humans
                                                                  in vehicle purchasing. A new international
are fallible, we encourage technology solutions
                                                                  standard under development (ISO 39001 Road
that can dramatically reduce the chances of
                                                                  Traffic Safety Management) is expected to assist
vehicle-to-vehicle, vehicle-to-infrastructure and
                                                                  organisations to build road safety plans suitable
vehicle-to-pedestrian collisions, improving the
                                                                  for their business.
quality and timeliness of safety information to
road users.
                                                                                 d
A new approach requires many different
                                                                        ence base inter ventio
                                                                       d                      ns
organisations to integrate road safety                              Evi
into their priorities and activities.
An important part of this strategy
                                                                                 f e system principle
is to build the partnerships and                                               Sa                    s
                                                                                                                              Saf
                                                   ds

connections necessary to make this
                                          Safer Roa

                                                                                                                                 er Pe
                                                                   ors

                                                                                                            res

happen. Within Government the
                                                         Human fact

                                                                                                               Sharsibility
                                                                                                               pon

existing partnership between the
                                                                                                                                      ople
                                                                                                                   ed

Department for Transport, Energy
and Infrastructure (DTEI), the South
Australia Police (SAPOL) and the
Motor Accident Commission (MAC),
                                                             For

will continue and be strengthened,
                                                                                                            y
                                                                 g

                                                                         in
                                                                                                         ilt

                                                                                                            ra
                                                                   iv

                                                                              gs
as will the important roles of the                                                 y st            a   nf
                                                                                       ems     Hum
health, education, research and local
                                                                                                                          s
                                                  Sa

                                                        er
                                                                                                                    c le

government sectors.
                                                             Sp                                                          i
                                                        f

                                                                  eed                                           Veh
                                                                               s                            e r
We will look for new opportunities and new
partners to address road safety from as many
                                                                                                   S af

                                                        3. Evidence based interventions
                                              Towards Zero Together - South Australia’s Road Safety Strategy 2020                     | 9
Safer
                                                                Roads
SAFER ROADS
While new road construction and safety focussed
retrofits are expensive when well planned,
designed and managed they can provide lasting
safety benefits to road users. Research in Victoria
and South Australia has shown that expenditure
can produce crash savings with a value at least
10 times the cost of the infrastructure.

Planning
A safe road transport system starts with
better planning. Urban planning decisions in
particular, have the potential to influence how
the road network is used and what infrastructure
investments are required. Liveability and
sustainability are becoming more important to the
community and are priorities for the 30 Year Plan
for Greater Adelaide. The changes to Adelaide
envisaged in the 30 Year Plan particularly the
priority afforded to investment in public transport,
has the potential to produce significant road
safety benefits. These benefits could be further
increased if road safety criteria were explicitly
included in the planning process so that safe
road environments are provided for pedestrians,
cyclists, light and heavy vehicles and for South
Australia’s ageing population (for example by
2020 approximately 20% of the State’s population
will be aged 65 and over).

It has not always been clear to the road user
that different roads in South Australia’s road
network perform different functions. Applying
a clear functional hierarchy of roads that is
more deliberately articulated to the community,
would assist road users to understand the road
environment.

10 | Towards Zero Together - South Australia’s Road Safety Strategy 2020
Roadways serve a variety of functions including
Run-off-road crashes
but not limited to the provision of direct access
to properties, pedestrian and bicycle paths, bus Most South Australian rural roads are two-way,
routes and catering for through traffic. Regardless two lane roads with unforgiving roadsides. In
of their main function all roads need to be 2008-2010, 59% of all fatal and serious injury
managed with the safety of the road users as a crashes on rural roads involved losing control of
priority. the vehicle, the majority hitting a fixed object or
rolling over. South Australia is applying a number
In the long term greater consistency in the road
of measures which have been proven to reduce
network will support better compliance with
the trauma resulting from run-off-road crashes.
speed limits, which are ideally set to be consistent
This includes sealed shoulders and audio tactile
with the function and design standard of the
edge lines which reduce the risk of vehicles
road. During the life of the strategy we will move
leaving the roadway, and clear zones and safety
closer to consistent speed limits for roads with
barriers to prevent vehicles from striking roadside
similar functions, design standards and access
objects.
management.
Priority will be given to treating those sections
Investment of the road network where most run-off-road
crashes occur, or a risk assessment has indicated
Infrastructure investment is expensive and it is
they are likely to occur. Giving initial priority to
important that funding is applied where it will
treating curved sections of roads has been shown
achieve the most benefits. South Australia will
to provide higher risk reductions for each dollar
continue to improve its methods for developing
invested.
and targeting effective infrastructure programs,
including regular safety assessments and audits Treatments which reduce run-off-road crashes will
of the network and monitoring of the effectiveness also reduce head-on crashes, which often result
of new programs. from a loss of control situation when vehicles
leave the road to the left, over-correct and enter
More investment in safety focussed improvement
the opposing traffic lane. This also means that
programs will be needed to support achievement
median treatments including wire rope barriers,
of the new safety targets, and the continual
wide painted medians and audio tactile lines have
dedication of fine revenue to safety programs
a significant role to play.
in South Australia will continue to support this.
Irrespective of the level of investment the greatest Run-off-road crashes particularly those involving
share will be allocated to where the greatest a fixed object are also a major issue in urban
potential trauma and risk reductions are possible. areas where the main types of objects struck, are
The investment will also be focussed on the most trees and stobie poles. While expensive, safety
effective treatments that can be applied to the key considerations will be given greater priority in the
crash types, consistent with safe system principles. program to replace stobie poles.
Towards Zero Together - South Australia’s Road Safety Strategy 2020 | 11Motorcyclists are also vulnerable to greater injury
Intersections
when involved in a crash and high use motorcycle
Almost half of serious casualty crashes in routes will be identified and the feasibility
metropolitan areas, and 21% in rural areas, occur of hazard protection assessed. Funding this
at intersections. One of the most difficult tasks motorcycle infrastructure investment through a
undertaken by drivers, is to judge gaps in the motorcycle safety fund will be explored, along with
opposing traffic when turning right, or entering a consideration of the relative costs of compulsory
major road from a local road. Effective treatments third party insurance premiums.
will reduce the frequency at which drivers need to
make these individual judgements.
Appropriate treatments for urban intersections can
be complex to develop and implement. The best
site-specific mix is dependant on the type and
volume of traffic and factors, such as the space
available for redesign and the land use around the
intersection. A program of intersection treatments
will be developed including installing roundabouts
at suitable locations and reducing uncontrolled
right turns. In some cases the most appropriate
treatment to improve safety may be to use
engineering treatments or speed limit changes. The
aim is to reduce speed through the intersection,
particularly where there are high volumes of
pedestrians or cyclists. 21% of rural serious
casualty crashes also occur at intersections where
the most effective solution is often the installation of
a roundabout.
Pedestrians, cyclists and
motorcyclists
In urban areas provision for people walking and
cycling is important and in some locations these
modes should be given priority over motorised
traffic when designing the road network.
Infrastructure initiatives to address the particular
needs of vulnerable road users will include the
provision of safe and separate facilities for people
walking and cycling, as well as the provision of
a safe speed environment when separation is
not possible. We cannot continue to define cycle
lanes as a painted white line that peters out when
it gets too hard. Promotion and facilitation of safe
shared-use pathways for cycling and walking
and safer speeds will help encourage people to
move away from the dominant car culture and
re-establish active transport as an attractive and
healthier alternative to driving.
12 | Towards Zero Together - South Australia’s Road Safety Strategy 20204 65 3 68
Safer
                                                              Speeds
SAFER SPEEDS
An overall framework for safe and credible speeds
requires a stronger functional approach to the
management of the road network.

Reductions in travel speeds save lives and injuries
and these benefits have been clearly demonstrated
on South Australian roads. The 2003 reduction in
urban speed limits to 50km/h produced a reduction
of over 20% in urban crashes. Other targeted speed
limit reductions, such as in parts of the Adelaide
Hills where the speed limit was reduced to 80km/h
and selected 110km/h rural roads reduced to
100km/h have produced similar results.

Reductions in average travel speed across the
network is the most effective and swift way to
reduce road trauma and would produce significant
and immediate road safety benefits. A reduction
of 5km/h in average travel speed would reduce
rural casualty crashes by about 30% and urban
casualty crashes by about 25%. A blanket
application of the 100km/h default speed limit on
rural roads (excluding national highways) would
be projected to save over 20 fatalities and serious
injuries combined each year.

Travel speeds have consequences for crash risk
and also for injury severity when a crash occurs.
Biomechanical research into the capacity of the
human body to absorb crash energy without
significant harm suggests that safe travel speeds
would ideally be less than 30km/h in areas
where conflict with people walking and cycling is
possible, less than 50km/h where side impacts are
possible, and less than 70km/h on roads where
head-on collisions are possible (see figure 5).
This illustrates the need to address speed within a
functional approach to road management.

14 | Towards Zero Together - South Australia’s Road Safety Strategy 2020
Reductions in speed and speed limits can also emissions, less traffic noise, and better support
be the most publicly contentious way to reduce for active travel modes contribute to South
road trauma. Sustained improvement in speed Australia’s environmental, sustainability, and
management will only occur with the support wellbeing objectives.
of the community and other stakeholders and
the adoption of a total change management Appropriate speed limits
approach. It will be vital for all stakeholders
International work has shown that to achieve our
to understand and be able to explain, the
vision, speed limits need to be set and enforced
importance of speed management to a safe
taking into account potential crashes and the likely
system, along with the community gains that
outcomes of these crashes given the physical
can be achieved from even small reductions in
impact on the human body.
travelling speed.
The default speed limit in South Australia is
The safety benefits of small speed reductions are
50km/h in urban areas and 100km/h in rural
not always intuitively obvious and more public
areas. Speed enforcement and speed limit
information will be provided to address the
reductions will be targeted to roads above the
community’s overestimation of related costs and
default limit with high crash rates or risk, and
underestimation of related benefits. For example,
where land use and infrastructure planning does
approximately 5 minutes is added to a 100km trip
not justify a limit above the default.
when travelling at 100km/h, rather than 110km/h,
travelling at 100km/h uses on average 8% less Projects for retrofitting safe and credible speed
fuel than travelling at 110km/h. limits will be progressed in rural and metropolitan
areas, taking into account:
The wider benefits of reducing speeds including
better fuel consumption, lower greenhouse gas
Figure 5 Collision–force and risk of fatality
100 100 100 100
80 80 80 80
Side-impact
Side-impact Head-on Head-on
Risk of Fatality (%)
Risk of Fatality (%)
Risk of Fatality (%)
Risk of Fatality (%)
60
Pedestrian
60
Pedestrian 60 60
Collision Collision Collision Collision
VehiclesVehicles
40 40 40 40
20 20 20 20
0 0 0 0
0 20
0 40
20 60
40 80
60 100
80 120
100 120 0 20
0 40
20 60
40 80
60 100
80 120
100 120
Speed (km/h)
Speed (km/h) Speed (km/h)
Speed (km/h)
Research into the capacity of the human body to absorb crash energy indicates that speeds would ideally be less than
30km/h in where conflict with people walking and cycling is possible, less than 50km/h where vehicle side-impacts are
possible and less than 70km/h where head on collisions are possible.
Speed is a critical factor in every serious crash, and speeding was directly attributable in an estimated
37% of fatal crashes for the 2008-2010 period.
Towards Zero Together - South Australia’s Road Safety Strategy 2020 | 15>> sustainability and liveability aims of the 30 the speeds of all vehicles between relatively
Year Plan for Greater Adelaide, and the need distant points on the road can be more effective
to support safe movement for pedestrians and and fairer than one-point speed cameras. They
cyclists can monitor all vehicles over a long section
of road continuously as they do not penalise
>> the concentration of trauma in rural areas close
momentary breaches of the speed limit. Focusing
to Adelaide including fringe areas undergoing
on major regional and interstate routes, the
changes in traffic volumes and demographics
development of a comprehensive point-to-point
>> increased understanding of the impact of a speed enforcement system will initially focus on
rural road network of two-way two lane roads the key routes into and out of Adelaide.
with speed limits of 110km/h, which is out of
The penalties in place to deter users who may
step with countries with the best road safety
otherwise flout the law and create unacceptable
record.
risk to others are a critical part of the mix of
speed compliance interventions. The current
Compliance with speed limits
range of penalties for speeding offences does
Whatever the speed limit improved compliance with not match the fundamental safety risk associated
and enforcement of the limit plays a vital role in with the offence, whether for lower or higher
improving the safety of all road users. The current end offending. Changes will be made so that the
network of fixed safety cameras in urban areas penalties for higher level speeding more closely
will expand and include mid-block and pedestrian correlate with the road safety risk.
crossing cameras. These automated enforcement
approaches will continue to be supplemented by Over the life of this strategy, it is expected that
targeted deployment of SAPOL personnel operating new vehicle technologies, such as intelligent
a range of technologies including mobile cameras speed adaptation will begin to provide the
and mobile radars at their disposal, and targeting ultimate support for the vast bulk of drivers who
roads with high crash risk. have no intention of breaking the law, but may
inadvertently travel above the speed limit. Speed
New technologies have the potential to increase limiting devices could also be targeted to
the range and effectiveness of enforcement recidivist offenders.
resources. Average speed cameras that measure
Key strategies for Safer Speeds
>> Align speed limits to the function, standard and use of the road, and increase consistency in their
application across the State.
>> Strengthen public information explaining the impact of speed and speed limits on crashes.
>> Target speed limit reductions for roads according to crash rates and a functional road hierarchy.
>> Increase the use of new technologies to boost speed limit compliance.
>> Increase the penalties for speeding to better match the risk posed.
Performance indicators 2010
Average metro traffic speed* 56.1km/h
Average rural traffic speed* 102.7km/h
Percentage of vehicles exceeding stated speed limit 23.4%
* Free speed with 4 second headway
16 | Towards Zero Together - South Australia’s Road Safety Strategy 2020Safer
Vehicles
SAFER VEHICLES
Improvements in vehicle safety are helping drivers
avoid crashes and protecting occupants and
other road users when crashes happen. Vehicle
technology is developing at a rapid rate with new
technologies on the rise. However, as the average
age of the South Australian vehicle fleet is just
over 11 years, it will take considerable time for
those technologies to be available to the majority
of road users.
A major aim of this strategy is to accelerate the
take-up of proven safety technologies into the
vehicle fleet. Some such as intelligent speed
adaptation (ISA) and alcohol interlocks can be
retrofitted to existing vehicles so quicker benefits
may be possible. On the other hand, important
technologies such as stability control and occupant
protection measures are not suitable for retrofitting.
Over the next ten years many of the innovations
in new vehicles will become more commonplace
for South Australian drivers. For example, more
than 50 per cent of vehicles will have electronic
stability control and about the same proportion
will have a 5-Star Safety Rating (based on today’s
standards). Because of the slow turnover of
vehicles, many of the advances in new vehicles
made in the past decade are only now beginning
to become commonplace. Therefore, part of
the benefit of newer vehicles will come from
momentum already in the vehicle system.
Consumer driven safety
The safety of new vehicles varies considerably, so if
buyers are to choose safer cars, they need reliable,
understandable and accessible information.
The Australasian New Car Assessment Program
(ANCAP) assesses the crashworthiness and safety
Towards Zero Together - South Australia’s Road Safety Strategy 2020 | 17features of new vehicles, assigning stars based on technology for take-up of these vital innovations.
safety performance, setting a de-facto standard for
Research confirms that there are currently important
many manufacturers.
emerging technologies, which have the potential to
The Used Car Safety Rating (UCSR) program significantly reduce road trauma.
provides real world data about the safety of
The best current example is frontal collision
different vehicles in the used market. These star
avoidance technology, which allows the vehicle
rating programs allow all buyers to make informed
to automatically brake or reduce speed to avoid
decisions, encouraging levels of safety that
a collision or reduce its severity. Accelerating its
exceed those required by regulation. Taking every
introduction into the fleet would save further injury.
opportunity to promote and explain ANCAP and
Another example is anti-lock braking systems (ABS)
UCSR results is an important part of this strategy.
on motorcycles, which have improved the safety of
A large proportion of the private vehicles now motorcycles and reduced out of control crashes.
travelling on South Australian roads were first
The frontal design of vehicles can have a major effect
registered as part of a private or Government fleet.
on the severity of injuries to pedestrians. ANCAP
Encouraging fleet buyers to adopt safe buying
tests the pedestrian friendliness of vehicles, but
practices will have strong flow-on benefits and over
while the ANCAP star rating for occupant protection
time, improve vehicle safety in the total fleet. There
has improved considerably, there has been little
are a number of possible approaches for influencing
change in vehicle safety ratings for pedestrian
fleet buyers that need to be investigated. These
collisions in the same period. South Australia is well
approaches include provision of better information,
placed to explain and promote the importance of
public recognition for safe fleets and incorporation
the pedestrian rating as the relevant crash testing is
into occupational health and safety requirements.
conducted in Adelaide.
Educating young people about vehicle safety
The health sector plays a major role in improving
features as part of the broader educative approach
road safety. Timely and effective post crash care
to driver training will help change attitudes,
is clearly vital and cooperation is needed between
behaviours and practices which affect young
health, road designers and vehicle regulators to
people’s safety on the road. The benefits of buying
ensure advantage is taken of new technologies,
safer vehicles to protect the most inexperienced
which allow more rapid and accurate reporting and
drivers will also be encouraged.
locating of crashes.
New technologies The National Road Safety Strategy 2011-2020
New technologies are available, such as ISA, includes a number of vehicle-related initiatives
which provide information about road and traffic including extending ANCAP, streamlining the
conditions to both the driver and the vehicle. These vehicle regulation system and strengthening vehicle
technologies rely on vehicle-to-infrastructure and regulations for heavy vehicles and motorcycles.
vehicle-to-vehicle communication. It will be our focus South Australia will actively support these initiatives.
to provide the necessary digital mapping and fixed
Key strategies for Safer Vehicles
>> Promote adoption of safest vehicle fleet buying policies by public and private fleet owners.
>> Continue to support and promote the Australian New Car Assessment Program and the Used Car
Safety Rating.
>> Accelerate the introduction of a range of new vehicle technologies such as frontal collision
avoidance and intelligent speed adaptation.
Performance indicator 2010
Percentage of new vehicles sold in SA with a 5 star safety rating 40.9%
18 | Towards Zero Together - South Australia’s Road Safety Strategy 2020Safer
People
SAFER PEOPLE
Influencing the behaviour of road users is critical
if we are to prevent death and serious injury on
our roads. Road users need to comply with the
road rules, remain alert and safety conscious
and accept that continual improvement in their
behaviour and that of others is vitally important if
road safety is to be improved.
As a community, it’s important that we have a
road safety culture where the loss of life and
injury on the road is not accepted as inevitable
and where the cost and inconvenience of making
significant improvement in safety is accepted.
Figure 6 Serious casualties by user type,
South Australia, 2008-2010
9%
6% Pedestrian
Cyclist
15%
48%
Motorcyclist
Driver
22%
Passenger
48% of people killed or seriously injured in crashes, are
drivers and another 22% are motor vehicle passengers.
Pedestrians, cyclists and motorcyclists make up the
remaining 30%.
Towards Zero Together - South Australia’s Road Safety Strategy 2020 | 19increased use of technological solutions, including
Dangerous behaviours
the use of alcohol ignition interlocks, will need to
Everyone has a role to play in the safe use of the be further explored as a mechanism for recidivist
road network. Road users need to uphold the offenders who are not responsive to mainstream
standards and laws that have been designed deterrence methods. Drug driving also plays a
to provide protection for all who use the road significant part in fatal crashes. Detection of drink
system. Providing regular and comprehensive and drug driving offenders will be increased.
information that leaves no doubt as to the level of
compliance required, is usually all that’s needed In more than a third of all vehicle occupant
for most road users. fatalities between 2008-2010 seatbelts were not
being worn at the time of the crash. This rate of
Dangerous drivers engage in behaviour which non-compliance amongst fatalities is generally
we know contributes to serious road crashes. higher in rural areas than in metropolitan
Behaviours such as exceeding speed limits, drink Adelaide. Research shows that wearing a seatbelt
and drug driving, non-use of restraints, in vehicle doubles your chances of surviving a serious crash
distractions, driving whilst fatigued and driving yet amazingly there are a small number of road
whilst unlicensed or disqualified are all dangerous users who continue to travel unrestrained, putting
behaviours. There are also drivers who are repeat themselves and others, at much higher risk of
offenders for this type of dangerous driving death and injury.
behaviour. Not all crashes result from these
types of behaviours however dangerous drivers SAPOL will adopt a combination of enforcement
are over-represented in serious road trauma and approaches as well as improving awareness
unnecessarily put other South Australian road and education and will seek to improve their
users at risk. knowledge of what is happening, where it’s
happening and who is involved. SAPOL will rely
The reality is that if people obeyed speed limits, heavily on an intelligence-driven and problem
didn’t drink or take drugs and drive, wore a solving approach which not only determines
seatbelt and were not distracted when driving - where serious crashes are happening, but also
the road toll would significantly reduce. To make identifies the dangerous drivers who continue to
a real impact on death and serious injury on commit offences which make the roads unsafe.
our roads our efforts must be focused towards
stopping dangerous driving behaviour and Graduated Licensing Scheme
removing dangerous drivers from our roads. Every
Licensing age, consumption of alcohol, excess
driver is accountable and responsible not just a
speed, carriage of passengers, and driving at
select few.
night are all factors which significantly increase
Impairment due to alcohol and drugs continues to the risks for young drivers. Addressing these
be a major contributor to death and serious injury factors through the Graduated Licensing Scheme
with on average 34% of drivers and riders killed (GLS) will have a substantially positive effect on
recording blood alcohol concentration (BAC) road safety and help young people to drive in
levels above the legal limit. The majority of driver the safest way possible. This can set the scene
and rider fatalities that test positive to an illegal for a lifetime of safe driving behaviours. Good
BAC are more than three times the legal limit. The training, practice, road safety awareness and safe
34% of fatally injured drivers and riders had a blood alcohol level over 0.05 (2008-2010).
37% of vehicle occupants killed were not wearing a restraint (2008-2010).
20 | Towards Zero Together - South Australia’s Road Safety Strategy 2020experience for young drivers will also continue Fatigue has been identified as a major factor
to be important. It is generally established in leading to crashes, with estimates of the number
the literature that a young person’s brain is of crashes involving fatigue varying between
still developing and maturing and that this has 15% and 30%. The only solution to fatigue is
implications for risk taking. Road safety education rest. Further work needs to be undertaken to
programs targeting causal factors of risk taking highlight the risks associated with fatigue to
behaviour show promise, but research indicates the driving community. We also need to keep
that programs that promote early licensing monitoring technological advances that may assist
increase exposure to crash risk. drivers. This will continue to be complemented
by infrastructure treatments that are known to be
Further enhancements to the GLS for young
effective such as audio tactile line marking.
and novice drivers and motorcyclists alike will
be considered as part of this strategy, especially
those that have proven benefits and provide
for restrictions that are progressively lifted as
experience and maturity is gained. We will also
continue to increase and improve educational
support for young people who enter the licensing
system and we will use new media options that
give the best chance of engaging young people.
Figure 7 Serious casualties by age group, South Australia, 2008-2010
20%
18%
16%
14%
Serious Casualties
12%
Percentage of Population
10%
8%
6%
4%
2%
0%
0-15 16-19 20-24 25-29 30-34 35-39 40-44 45-49 50-54 55-59 60-64 65-69 70-74 75-79 80-48 85-89 90+
Road users aged between 16-24 account for approximately 27% of those killed and seriously injured but only 12% of
the population.
Towards Zero Together - South Australia’s Road Safety Strategy 2020 | 21Education Road safety marketing
Road safety education is a lifelong learning Road users need accurate, current and well
process linked appropriately to various life stages delivered road safety information to be able
and contexts. Formally, it includes programs and to play their part in a safe system of behaving
curriculum that are explicitly delivered in schools. responsibly, in accordance with the standards
Less formal learning is gained through family, and road rules. If public education campaigns
peers, community and media influences, along are to succeed we need to provide influential
with awareness developed as a result of personal information to our target audience.
experiences.
MAC will continue to plan, coordinate, implement
School-based road safety education will continue and evaluate comprehensive road safety
to be supported according to our current marketing programs to support the reduction
knowledge of best practice. It will be important of road trauma. These will focus on road safety
to provide schools and students with clear priorities and building community understanding
information about what road safety education of road safety and support for road safety
programs are available to them and how measures. Mass media campaigns will continue
those programs measure against best practice to be coordinated with enforcement and the
principles. This way decisions can be made at the implementation of new safety measures, so that
local school level based on sound information and maximum benefits are obtained. The range of
the school context. other promotional activity conducted by a variety
of stakeholders will be better co-ordinated.
Key strategies for Safer People
>> Enhance the Graduated Licensing Scheme to further protect young road users.
>> Reduce the involvement of alcohol and drugs and non-restraint use in crashes through
increased enforcement measures, integrated with public education campaigns and supported
by new technologies.
>> Support deployment of enforcement efforts to areas of high crash risk.
>> Align road safety education with safe system and best practice education principles.
Performance indicators Average 2008-2010
Number of young people (16-24) killed or seriously injured 318
Number of drivers/riders killed with BAC above legal limit 22
Number of drivers/riders tested positive for alcohol 12,115
Number of drivers/riders tested positive for drugs 1,181
Number of people killed or seriously injured not wearing a seatbelt 77
Number of new CTP insurance claims* 6024
* Excludes minor claims
22 | Towards Zero Together - South Australia’s Road Safety Strategy 2020seatbelts, travelling in the rear
Aboriginal road users Older road users
of utilities or trucks and in some
Aboriginal people make up 1.7% of instances, over-crowding of vehicles. During the last 10 years 162 people
the State’s population but on average Also, almost as many Aboriginal over the age of 70 were killed and
account for 4.6% of the total number pedestrians as drivers, are admitted 904 seriously injured while using the
of South Australian residents in road to hospital each year. Many crashes South Australian road network. Those
crashes in Australia, indicating an involving Aboriginal people are not killed included drivers, motorcycle
estimated fatality rate three times reported. riders, vehicle passengers, cyclists
greater than for non-Aboriginal and pedestrians.
Many Government policy statements
people. Significant numbers of Research has shown that although
recognise that driver licensing,
Aboriginal crash casualties are older drivers are involved in a small
custodial sentences, employment
vehicle passengers, and factors for number of crashes, these crashes
and life expectancy for Aboriginal
this may include: failure to wear are of higher severity, probably
people, whether in urban, rural or
because of the frailty of these older
remote situations are inextricably
users. Older drivers have been shown
linked. Systematically increasing
to be more cautious and to exhibit
the numbers of Aboriginal people
less illegal and dangerous driving
who obtain, as well as retain, their
behaviour than other age groups, and
driver’s licence through a dedicated
there is evidence that older drivers
Aboriginal Driver Licensing Program
self-regulate to avoid risky situations
would be a powerful start.
and times of day.
These and other approaches, all
Common crash types for older
serve to raise the profile of
drivers, are right turn crashes and
road safety as a key issue
crashes due to disobeying a traffic
of concern in Aboriginal
signal or sign. The use of safer
communities. Infrastructure
vehicles could provide benefits for
treatments such as road
older drivers particularly in providing
sealing and maintenance
increased protection when a crash
within and around Aboriginal
occurs. Improvements to the road
communities, together with
environment are also important,
improved road signage, help
for example lower speed limits
reduce road trauma for all
and controlled phases at traffic
drivers as well as Aboriginal
signals would prove beneficial for
drivers.
older drivers. Improved safety for
pedestrians and improved public
transport will be important to older
drivers, to maintain mobility and
access to services, without the need
to drive a private motor vehicle.
Towards Zero Together - South Australia’s Road Safety Strategy 2020 | 23potential to significantly reduce vehicles and cyclists where there
Young road users
trauma for younger drivers. is significant speed differential.
Over the last ten years almost 4,000 Providing a low speed environment
In the early months of driving
young people aged between 16 and reduces both the likelihood of
independently, young drivers are
24 have been killed and seriously collisions occurring and reduces
involved in high numbers of right
injured on our roads. Young drivers crash severity.
turn and run-off-road crashes which
are over represented in crashes and
would suggest skill and judgement Separation can be achieved by
the resulting deaths and injuries are
issues. However, drivers aged 16 having separate operating spaces
a serious loss for South Australia.
to 24 are also involved in crashes on-road in the form of bicycle
People aged 16 to 19 make up 5%
involving excessive speed and illegal lanes, or through the use of off-
of the population, but in 2008-10
alcohol levels at much greater rates
accounted for 13% of fatalities and
than older drivers, which would
14% of serious injuries in South
suggest an involvement of greater
Australia each year. On average, in
risk-taking behaviour.
South Australia 31% of deaths of
people aged between 15 and 24 are
attributed to road crashes.
Cyclists
During the last 10 years 37 cyclists
It is generally acknowledged that
have been killed and 631 seriously
age and inexperience are important
injured in road crashes on South
factors in young driver crashes.
Australian roads. Seriously injured
Younger drivers have a significantly
cyclists were predominantly male
higher risk of death relative to the
and included all age groups.
number of kilometres they drive,
Most bicycle crashes occurred in
compared to other driver age
Adelaide where high bicycle and
groups. Young drivers are at a high
motor vehicle numbers coincide.
risk of crashing and also often
Cycling in South Australia is
have a high exposure at higher
increasing and data shows that of
risk times of day. The combination
any Australian State capital city,
of these factors result in young
Adelaide has the highest
drivers accounting for a significant
percentage of people cycling
proportion of the total South
to work.
Australian road toll.
The most effective counter
Research has shown that young
measures to improve bicycle
drivers are at most risk of crashing
safety are by providing lower
during their first year of driving
speed environments where
independently. Measures to limit
motor vehicles and bicycles
exposure to high-risk situations
travel at comparable speeds, or
during this first year have the
by providing separation between
24 | Towards Zero Together - South Australia’s Road Safety Strategy 2020road bicycle paths. New approaches Pedestrian safety can be increased by
for on-road bicycle lanes are being providing lower speed environments
considered which provide greater where there is both high pedestrian
physical separation than a painted activity and motor vehicle numbers,
line. Comprehensive, safe bicycle and by providing separation between
networks are required so as to meet vehicles and pedestrians in higher
the diverse needs of the range of speed areas.
people who cycle, from athletes in
training to family groups and children
riding to school.
Pedestrians
Pedestrians are involved in about
16% of serious casualty crashes
in metropolitan Adelaide and 5%
of serious casualty crashes in the
rest of South Australia. During the
last 10 years 153 pedestrians have
been killed in road crashes and
1133 seriously injured. Although the
number of child pedestrian injuries
has reduced in recent years, still
more than 9% of pedestrians injured
in a road crash are aged under 15.
Pedestrian crashes can happen to
people of any age or gender with the
young and the old being at greater
risk. Those who have high blood
alcohol levels are also at greater risk
of being involved in a crash.
A key aim of the 30 Year Plan for
Greater Adelaide is to design our city
and suburbs so as to encourage more
walking and cycling through a range
of measures including more ‘walking
and cycling friendly’ streetscapes and
neighbourhoods.
Towards Zero Together - South Australia’s Road Safety Strategy 2020 | 25Protective clothing has been
Motorcyclists
shown to be beneficial in
Motorcycling is a high-risk mode reducing serious injuries in
of travel with motorcyclists motorcycle crashes. Highly
being at more than twenty conspicuous clothing and
nine times the risk of being daytime headlights use have
involved in a crash than car also been shown to be useful
drivers. During the last 10 in reducing crashes, by
years, 167 motorcyclists have assisting other road users to see
been killed and 1666 seriously motorcycles before a collision
injured in road crashes in South occurs. International research
Australia. Nearly all of the is showing safety benefits from
serious casualties were male fitting motorcycles with anti-lock
and crashes occurred in both braking systems (ABS). There
metropolitan Adelaide and in are also a range of infrastructure
rural areas. treatments that can assist
motorcyclists.
In South Australia motorcycle
registrations have been steadily
growing and in recent years,
scooters have become more
popular. Motorcycle crashes are
also rising due to this increasing
exposure. The most common
types of motorcycle serious
casualty crashes are single
vehicle, run-off-road crashes
(especially on curves) and
multi-vehicle crashes involving
right of way violations by other
road users. Recent research
has shown that new riders and
those returning to riding after a
number of years, are at a higher
risk of being involved in a crash.
26 | Towards Zero Together - South Australia’s Road Safety Strategy 2020would all be expected to reduce unlicensed drivers but further work
Heavy vehicle drivers
heavy vehicle crashes, as would is required to develop other effective
Heavy vehicles are involved in 14% the increased use of telematics countermeasures.
of fatal crashes and 7% of serious to monitor vehicle and driver
injury crashes on South Australian In the longer-term, vehicle
behaviour.
roads. The crash rate per kilometre technology may be the best answer
for heavy vehicles is lower than for High risk and to reducing high-risk driving. Alcohol
other road user types, but because interlocks and mandatory intelligent
of the high kilometres travelled and
recidivist drivers speed adaptation for recidivist
the high severity of crashes, they are A small group of drivers are at offenders have the potential to
significant contributors to the total higher risk of being involved in a significantly reduce the two most
cost of road trauma. Just over half crash because of the choices they frequent high-risk behaviours.
of heavy vehicle serious casualty make. These include motorists
crashes occur in rural areas. Most who drive with high BAC levels or
heavy vehicle serious casualty when affected by drugs, those who
crashes involve rigid trucks or semi frequently drive at inappropriate
trailers with only small numbers of speeds and those who drive when
B-Doubles, road trains and buses not wearing a seatbelt. Driving while
involved. disqualified or unlicensed is linked
to all of these behaviours.
In fatal crashes involving a heavy
vehicle 22% of those killed are truck Targeted enforcement and related
occupants. One contributor to these road safety marketing are the key
deaths is the low use of seatbelts measures used to reduce the
by truck drivers with some studies incidence of high-risk behaviours.
finding wearing rates as low as 10%. These measures increase the
Speed and fatigue have also been awareness of enforcement and also
identified as key contributors to the actual likelihood of offenders
heavy vehicle crashes, with speed being caught. The willingness
surveys showing high numbers of of high-risk drivers to continue
heavy vehicles travelling above the to drive while disqualified is a
posted speed limit. major challenge in developing
effective countermeasures. Loss of
Vehicle technology has the potential licence is the usual deterrence to
to significantly improve heavy continuing to offend but is obviously
vehicle safety. Technologies such ineffective for those road users who
as intelligent speed adaptation, do not value their licence. Use of
seat belt monitoring and advanced automatic number plate recognition
emergency braking systems may increase the detection of
Towards Zero Together - South Australia’s Road Safety Strategy 2020 | 27You can also read