Spatial distribution of proteins and metabolites in developing wheat grain and their differential regulatory response during the grain filling ...
←
→
Page content transcription
If your browser does not render page correctly, please read the page content below
The Plant Journal (2021)                                                                                      doi: 10.1111/tpj.15410

RESOURCE

Spatial distribution of proteins and metabolites in developing
wheat grain and their differential regulatory response during
the grain filling process
Shuang Zhang1, Arindam Ghatak1           , Mitra Mohammadi Bazargani2, Prasad Bajaj3, Rajeev K. Varshney3,4   ,
Palak Chaturvedi * 1,
                           , Dong Jiang and Wolfram Weckwerth1,6,*
                                       5

1
  Department of Functional and Evolutionary Ecology, Molecular Systems Biology Lab (MOSYS), University of Vienna,
Althanstrasse 14, Vienna A-1090, Austria,
2
  Agriculture Institute, Iranian Research Organization for Science and Technology, Tehran, Iran,
3
  Centre of Excellence in Genomics and Systems Biology, International Crops Research Institute for the Semi-Arid Tropics
(ICRISAT), Hyderabad 502324, India,
4
  State Agricultural Biotechnology Centre, Centre for Crop and Food Innovation, Murdoch University, Murdoch, WA 6150,
Australia,
5
  National Technique Innovation Center for Regional Wheat Production/Key Laboratory of Crop Ecophysiology, Ministry of
Agriculture/Nanjing Agricultural University, Nanjing 210095, China, and
6
  Vienna Metabolomics Center (VIME), University of Vienna, Althanstrasse 14, Vienna A-1090, Austria

Received 23 February 2021; revised 6 June 2021; accepted 25 June 2021.
*For correspondence (e-mail palak.chaturvedi@univie.ac.at (P. C.); wolfram.weckwerth@univie.ac.at (W. W.)).

       SUMMARY
       Grain filling and grain development are essential biological processes in the plant’s life cycle, eventually
       contributing to the final seed yield and quality in all cereal crops. Studies of how the different wheat (Triti-
       cum aestivum L.) grain components contribute to the overall development of the seed are very scarce. We
       performed a proteomics and metabolomics analysis in four different developing components of the wheat
       grain (seed coat, embryo, endosperm, and cavity fluid) to characterize molecular processes during early and
       late grain development. In-gel shotgun proteomics analysis at 12, 15, 20, and 26 days after anthesis (DAA)
       revealed 15 484 identified and quantified proteins, out of which 410 differentially expressed proteins were
       identified in the seed coat, 815 in the embryo, 372 in the endosperm, and 492 in the cavity fluid. The abun-
       dance of selected protein candidates revealed spatially and temporally resolved protein functions associated
       with development and grain filling. Multiple wheat protein isoforms involved in starch synthesis such as
       sucrose synthases, starch phosphorylase, granule-bound and soluble starch synthase, pyruvate phosphate
       dikinase, 14-3-3 proteins as well as sugar precursors undergo a major tissue-dependent change in abun-
       dance during wheat grain development suggesting an intimate interplay of starch biosynthesis control. Dif-
       ferent isoforms of the protein disulfide isomerase family as well as glutamine levels, both involved in the
       glutenin macropolymer pattern, showed distinct spatial and temporal abundance, revealing their specific
       role as indicators of wheat gluten quality. Proteins binned into the functional category of cell growth/divi-
       sion and protein synthesis/degradation were more abundant in the early stages (12 and 15 DAA). At the
       metabolome level all tissues and especially the cavity fluid showed highly distinct metabolite profiles. The
       tissue-specific data are integrated with biochemical networks to generate a comprehensive map of molecu-
       lar processes during grain filling and developmental processes.

       Keywords: wheat, Triticum aestivum, proteomics, metabolomics, grain filling, seed development, seed coat,
       embryo, endosperm, cavity fluid.

© 2021 The Authors.                                                                                                               1
The Plant Journal published by Society for Experimental Biology and John Wiley & Sons Ltd.
This is an open access article under the terms of the Creative Commons Attribution-NonCommercial-NoDerivs License,
which permits use and distribution in any medium, provided the original work is properly cited, the use is non-commercial
and no modifications or adaptations are made.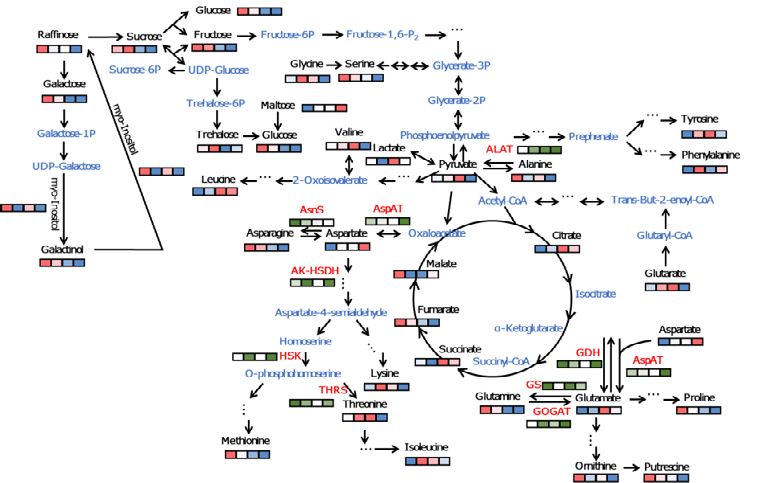
2 Shuang Zhang et al.

INTRODUCTION                                                         component has a different gene expression pattern during
                                                                     the grain filling process. The filial organs (embryo and
Wheat (Triticum aestivum L.) is one of the three most                endosperm) develop within maternal tissue (seed coat).
important cereal crops. It is widely cultivated due to its           Mature wheat grain consists of 2–3% embryo, 13–17%
value as a staple food and as a primary starch, protein              outer layers (seed coat), and 80–85% endosperm (all com-
source and due to its unique suitability for bread produc-           ponents converted to dry matter) (Barron et al., 2007; Shi
tion. The total global annual wheat production is more               et al., 2019). The seed coat provides a protective layer for
than 600 million tons, which accounts for more than 20%              the developing zygotes. It contains chlorophyll, has photo-
of calories consumed worldwide (Brenchley et al., 2012;              synthetic activity, and provides nutrients for grain develop-
Pfeifer et al., 2014; Shewry, 2009). The constantly increas-         ment (Yu et al., 2015). In the early stage of grain growth,
ing world population and extreme weather conditions due              the seed coat is an assimilation reservoir (Radchuk et al.,
to climate change impose a severe threat to agriculture              2009) which is gradually degenerated. The green tissue
and its productivity. Hence it is imperative to improve our          layer and crease region remain viable until the grain dehy-
understanding of the essential plant processes such as               dration stage (Tran et al., 2014). Photosynthesis in the seed
grain development, contributing to final grain quality and           coat entirely depends on the CO2 produced by respiration
yield.                                                               in the endosperm and embryo. The seed coat of barley
   Grain development plays an essential role in the life             (Hordeum vulgare) grain re-fixes 79% of the CO2 produced
cycle of angiosperms. Grain stores genetic information               by respiration in the endosperm and embryo and the car-
and nutrients that guarantee the reproduction of the next            bon conversion efficiency of barley grain reaches 95%. It is
generation. Wheat grain development is a complex pro-                speculated that this also occurs in wheat grain (Rolletschek
cess that involves three successive stages: cellularization          et al., 2015). Within 2–10 DAA, the seed coat begins to
(i.e., cell division and differentiation), grain filling, and mat-   accumulate starch granules. The number of starch gran-
uration/desiccation (Nadaud et al., 2010). This process              ules and protein bodies gradually increases throughout
involves coordinated interaction with three main seed                development, and the particles become larger and larger
components: seed coat, endosperm, and embryo (Chaud-                 (Christiaens et al., 2012; Loussert et al., 2008). At 10–20
hury et al., 2001). The first stage comprises cellularization        DAA, the seed coat nutrients begin to decompose, as they
and differentiation, leading to the development of both the          are partly used for their physiological processes and partly
embryo and endosperm—this stage lasts until up to 10                 transported to the endosperm and embryos for their
days after anthesis (DAA). The grain filling stage is charac-        growth (Christiaens et al., 2012; Zhou et al., 2009).
terized by the onset of synthesis and accumulation of stor-             The wheat endosperm is the essential nutrient storage
age molecules such as starch and gluten proteins. This               organ, accounting for approximately 83% of the whole
stage lasts up to 20 days (i.e., from 11 to 30 DAA); this per-       grain (Barron et al., 2007). It is specifically used for the
iod is further divided into three stages: the Medium milk            accumulation of starch and protein. The spatial hetero-
(11–16 DAA), Soft dough (17–21 DAA), and Hard dough                  geneity of starch and protein directly affects the quality of
(22–30 DAA) stages. Farmers use these stages to describe             wheat flour. The embryo is located on the dorsal side of
grain development in the field (www.wheatbp.com). ‘Med-              the wheat caryopsis’ proximal end (Shi et al., 2019). As an
ium milk’ is the beginning of the grain filling stage. In this       important reproductive organ in wheat grain, the embryo
stage, the endosperm meristem cells continue to divide               absorbs about 15% of the assimilation through the peel
and form storage compartments. At 14 DAA, larger A-type              and is used to produce and accumulate a mixture of starch,
starch particles appear, and at the same time, liposomes             lipids, and proteins (Neuberger et al., 2008; Rolletschek
and protein bodies also develop. As the grain enters the             et al., 2015). During grain filling, the amino acids produced
‘Soft dough’ stage, endosperm cell division stops. At the            by proteolysis in the leaves are transported via the phloem
same time, protein and starch granules start to accumu-              into the grain, where they serve as substrates for protein
late, and embryo growth is driven by starch digestion of             synthesis (Fisher and Gifford, 1986). In barley grain, free
the endosperm and surrounding tissue. In the final stage             amino acids need to be unloaded into the endosperm cav-
of grain filling, ‘Hard dough’ activities are still dominated        ity (cavity fluid) and enter the endosperm through the
by protein accumulation and starch synthesis (McIntosh               transfer cells or aleurone layer (Thiel et al., 2009).
et al., 2007). The maturation/desiccation stage is character-           In recent years, genetics has helped decipher the gene
ized by dehydration of the grain, which gradually enters a           regulatory network that plays a vital role in seed develop-
quiescent dormancy state. The duration of each stage var-            ment (Santos-Mendoza et al., 2008). DNA microarray and
ies, largely depending upon the genetic background and               RNA sequencing (RNA-seq) techniques are advantageous
environmental conditions (Jin et al., 2013).                         for large-scale genome-wide studies (Girke et al., 2000; Xu
   In brief, wheat grain is constituted by three distinct com-       et al., 2012b; Xue et al., 2012). However, it has been noted
ponents: embryo, endosperm, and seed coat. Each                      that mRNA levels are not always correlated with protein

                                                                                                            © 2021 The Authors.
                                   The Plant Journal published by Society for Experimental Biology and John Wiley & Sons Ltd.,
                                                                                The Plant Journal, (2021), doi: 10.1111/tpj.15410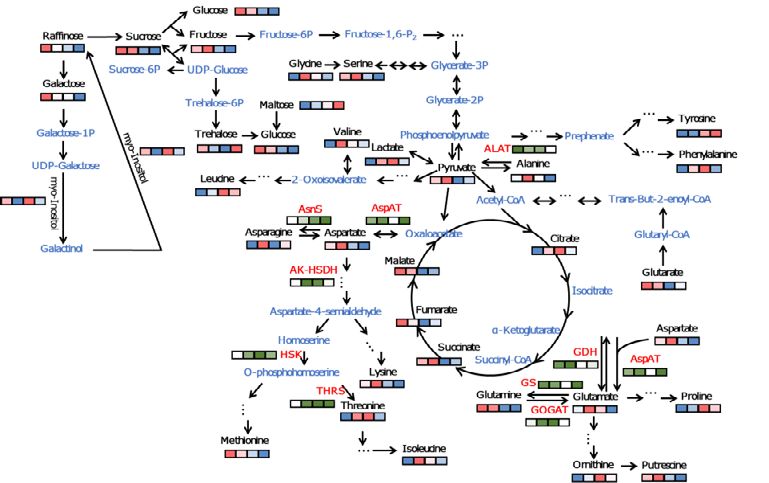
Multiomics and grain filling process in wheat 3

abundance (Gygi et al., 1999; Weckwerth et al., 2020), and      weight was highest at 29 DAA and then declined (Figure 1
genomics tools cannot always provide precise information        (b)), indicating that the developing grain entered the desic-
about protein levels and regulation, limiting our under-        cation stage at 29 DAA. The cavity fluid also disappeared
standing of the metabolic regulatory networks (Anderson         after 26 DAA. Overall, up to 12 DAA developing grain
and Anderson, 1998). Therefore, to unravel the develop-         mainly undergoes active cell division and differentiation,
mental patterns of proteins and metabolic regulation and        followed by grain filling up to 29 DAA, and then enters the
their role in the grain filling process, it is essential to     desiccation stage. Therefore, the harvesting time points for
record and analyze these biochemical (proteins and              this experiment were set at 12, 15, 20, and 26 DAA, a pri-
metabolites) dynamics at their interface. In this context,      mary phase of the grain filling process. During this phase,
proteomics and metabolomics have become the central             grain grew gradually in length and width (Figure 1(c)), and
element of plant systems biology research (Weckwerth,           the color of the grain switched from white to green (Fig-
2011; Weckwerth et al., 2020). The ultimate aim is to detect,   ure S1). The fresh weight of the seed coat, embryo, endo-
identify, quantify, and interpret the abundance of proteins     sperm, and cavity fluid varies significantly between
and metabolites of a given system. Here, an integrated          different developmental stages (Figure 1(d)). The fresh
approach comprising different analytical platforms such as      weight of the seed coat and cavity fluid peaked at 15 DAA
liquid chromatography coupled to mass spectrometry (LC-         and then decreased significantly. The embryo and endo-
MS) and gas chromatography coupled to mass spectrome-           sperm grew gradually from 12 to 26 DAA. It is noteworthy
try (GC-MS) enables high-throughput profiling of proteins       that the period from 15 to 20 DAA is important for endo-
and metabolites (Morgenthal et al., 2005; Weckwerth et al.,     sperm growth. The texture of the cavity fluid becomes
2004c; Wienkoop et al., 2008).                                  sticky at 26 DAA. All the recorded observations are
   Although considerable work has been performed in the         reported in Table S1.
investigation of proteomics and metabolomics in wheat
                                                                Comparative proteome characterization of developing
grain, these studies are mainly focused on selected wheat
                                                                seed coat, embryo, endosperm, and cavity fluid during
grain components (such as embryo and endosperm), sev-
                                                                grain filling
eral time points, and abiotic stress (Das et al., 2017;
Dupont, 2008; Dupont et al., 2011; Francki et al., 2016; Ge     From all the detected peptides, 3806 proteins were
et al., 2012; Gu et al., 2015; Guo et al., 2012b; Han et al.,   detected in the seed coat, 4560 proteins in the embryo,
2017; Yang et al., 2016; Yang et al., 2017; Zhang et al.,       4144 proteins in the endosperm, and 2974 proteins in the
2015). Wheat also has a much larger genome and a more           cavity fluid during the grain filling process (Tables S2 and
complex proteome (approximately 104 091 different pro-          S3). A Venn diagram analysis was conducted to broadly
teins) (Clavijo et al., 2017) than model plants such as Ara-    survey the identified proteins with altered abundance in
bidopsis and rice (Oryza sativa). Thus, the important           each component, which determines the dynamics of the
regulatory mechanisms for wheat grain development still         proteome in different developmental stages (12, 15, 20,
require further study. To the best of our knowledge, a sys-     and 26 DAA) (Figure 2(a)). In endosperm, in total 4144 pro-
tematic proteomics and metabolomics analysis of the             teins were identified, of which 2966 proteins were
entire development process in wheat grain has not been          expressed at all four time points (Figure 2(a)). Interestingly,
reported previously. Therefore, we analyzed the dynamic         five and four unique proteins were identified at 15 DAA
changes in protein and metabolite levels in wheat grain at      and 26 DAA, respectively. Aspartic proteinase nepenthesin
four sequential developmental stages, i.e., 12, 15, 20, and     I was identified at 15 DAA. This protein is a unique mem-
26 DAA, in four different components, i.e., seed coat,          ber of a novel subfamily of aspartic proteinases. Short-
embryo, endosperm, and cavity fluid. Our results revealed       chain dehydrogenase/reductase, functioning as a molecu-
a global pattern of proteins and metabolites corresponding      lar link between nutrient signaling and plant hormone
to grain development, which serves as a valuable resource       biosynthesis, was identified at 26 DAA (Table S4).
and provides new insights into the potential metabolic net-        Principal component analysis (PCA) of protein normal-
works that control grain yield and quality.                     ized spectral abundance factor (NSAF) scores was per-
                                                                formed using the R (package ggplot2). PCA demonstrated
RESULTS                                                         that the proteome regulation pattern of the four grain fill-
                                                                ing stages differed significantly in every grain component.
Morphology and physiology during grain filling
                                                                Figure 2(b) shows that all grain components were clearly
Whole wheat grains were sampled from 12 to 35 DAA, and          separated as a sequential process determined by the first
the characteristics of the developing grain were recorded       principal component (PC1), which accounted for 36.79%,
at each time point (Figure 1(a,b)). The moisture content        29.48%, 35.46%, and 47.46% of variability in the seed coat,
gradually decreased during this period (Figure 1(a)), while     embryo, endosperm, and cavity fluid, respectively. The
the dry weight gradually increased (Figure 1(b)). The fresh     loadings of PC1 determine unique sets of proteins in each

© 2021 The Authors.
The Plant Journal published by Society for Experimental Biology and John Wiley & Sons Ltd.,
The Plant Journal, (2021), doi: 10.1111/tpj.15410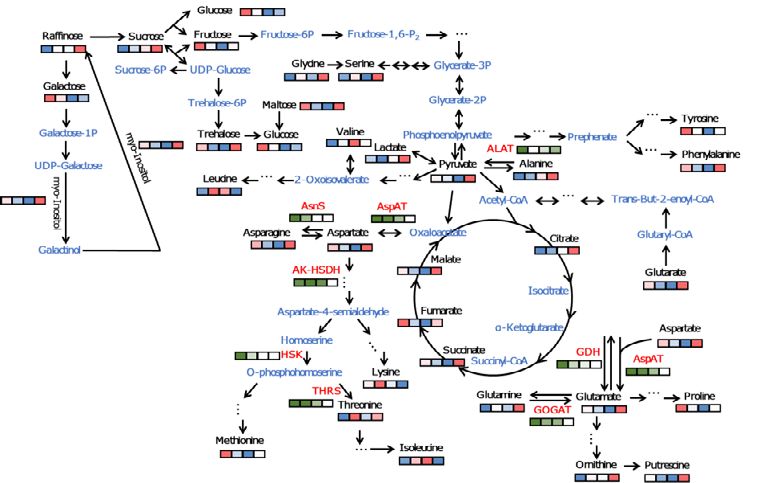
4 Shuang Zhang et al.

(a)                                                                                                  (b)
                        100
                                                                                                                             120           Fresh Weight
                                       Moisture Content                                                                                    Dry Weight
                                                                                                                             100
 Moisture Content (%)

                                                                                                   Fresh / dry weight (mg)
                         80
                                                                                                                              80

                         60                                                                                                   60

                                                                                                                              40
                         40
                                                                                                                              20

                          0                                                                                                    0
                              0 3 9    12    15 18 21 24 27 30           33   36                                                   0 3 9   12    15   18   21   24   27   30    33      36
                                            Days After Anthesis (DAA)
                                                                                                                                            Days After Anthesis (DAA)
(c)                                                                                                  (d)

                         1.0             Length                                                                                                                                12 DAA
                                                                                                                                                                               15 DAA

                                                                                                   Fresh weight (mg/grain)
                                         Width                                                                               60                                                20 DAA
                         0.8
 Length / width (cm)

                                                                                                                                                                               26 DAA

                         0.6                                                                                                 40

                         0.4
                                                                                                                             20
                         0.2

                         0.0                                                                                                  0
                                      12 DAA      15 DAA   20 DAA   26 DAA                                                                 SC         EM        EP        CF
                                        Days After Anthesis (DAA)                                                                               Wheat grain components

Figure 1. Development of wheat grain cultivar Yangmai 16. (a) Changes in the total moisture content of developing grain. Values are expressed as the percent-
age of dry grain weight. (b) Changes in fresh and dry weight of developing grain. At least 70 grains were analyzed at each stage. (c) Changes in grain length and
width between 12 and 16 DAA. (d) Dynamic changes in the fresh weight of four grain components in different grain filling stages (70 seeds/stage). Error bars
represent the standard deviation of three replicates. DAA, days after anthesis; SC, seed coat; EM, embryo; EP, endosperm; CF, cavity fluid.

developmental stage (12, 15, 20, and 26 DAA). Positive                                      photosynthesis in the seed coat, oleosin and peroxidase in
loadings of PC1 represent proteins with higher abundances                                   embryo, protein storage and lipid metabolism in the endo-
in the late grain filling stage (20 and 26 DAA), whereas                                    sperm, and disease resistance (endochitinase and PBSP
negative loadings represent proteins with higher levels                                     domain protein) and sugar hydrolysis in cavity fluid (Table
during early grain filling stages (12 and 15 DAA) (Table S5).                               S5).
The highest negative PCA loadings of seed coat include                                      Differentially expressed proteins at different
proteins involved in signal transduction, members of the                                    developmental stages in wheat grain components
protein disulfide isomerase (PDI) family, and proteins
involved in sugar synthesis. In contrast, the negative load-                                A fold change (FC) cutoff value of 1.5 and P < 0.05 were
ings of endosperm include proteins involved in DNA repli-                                   used to identify differentially expressed proteins (DEPs).
cation and tRNA pseudouridine. The negative PCA                                             Comparisons were made between grain developmental
loadings in the embryo include glucan hydrolases and vac-                                   stages, i.e., 15 vs. 12 DAA, 20 vs. 15 DAA, and 26 vs. 20
uolar processing enzyme, responsible for vacuolar protein                                   DAA, in each grain component (Table S6). Comparing 15
maturation and activation. The highest PCA loadings of                                      vs. 12 DAA, a total of 66 DEPs were identified in the seed
cavity fluid revealed proteins involved in the nuclear export                               coat, 309 in embryo, 134 in endosperm, and 170 in cavity
of proteins, rRNA, snRNA, and some mRNA. Other nega-                                        fluid. Comparing 20 vs. 15 DAA, a total of 123 DEPs were
tive loadings revealed proteins involved in the synthesis of                                identified in the seed coat, 195 in embryo, 188 in endo-
histidyl-tRNA and protein ubiquitination. The highest posi-                                 sperm, and 123 in cavity fluid. Comparing 26 vs. 20 DAA,
tive PCA loadings include proteins which are involved in                                    229 DEPs were identified in the seed coat, 417 in embryo,

                                                                                                                                    © 2021 The Authors.
                                                           The Plant Journal published by Society for Experimental Biology and John Wiley & Sons Ltd.,
                                                                                                        The Plant Journal, (2021), doi: 10.1111/tpj.15410
Multiomics and grain filling process in wheat 5
(a) 15 DAA 20 DAA 15 DAA 20 DAA 15 DAA 20 DAA
15 DAA 20 DAA
4 5 0 53 11
5 2 10 26 26
26
A
26 D
A
A
DA
D D 163
A
DA
4 AA
DA
D 36 AA 369 7
DA
22 15 AA 157 171 AA 461 40
12
106
12
12
12
560 100 275 411 54 1469 65
53 16 250 101 4 35 2
7 1
2 3001 2 1 3156 82 9 2966 1 1 799 1
7 24 34 214 8 79 0 0
0 55 2 0
Seed coat Embryo Endosperm Cavity fluid
(b)
Legend 0.4
0.2 12 DAA 0.6
15 DAA
0.25 20 DAA
26 DAA 0.4 0.2
PC2 (14.41%)
PC2 (14.87%)
PC2 (14.54%)
0.0
PC2 (24.35%)
0.2
0.00
0.0
−0.2
0.0
−0.25 −0.2
−0.2
−0.4
−0.4 −0.4
−0.25 0.00 0.25 0.50 −0.50 −0.25 0.00 0.25 −0.4 −0.2 0.0 0.2 0.4 −0.25 0.00 0.25 0.50
PC1 (36.79%) PC1 (29.48%) PC1 (35.46%) PC1 (47.46%)
Seed coat Embryo Endosperm Cavity fluid
Figure 2. (a) Venn diagrams representing total proteome identification from different components (seed coat, embryo, endosperm, and cavity fluid) of develop-
ing grain (12, 15, 20, and 26 days after anthesis [DAA]) of wheat cultivar Yangmai 16. (b) Principal component analysis (PCA) of the protein profiles of wheat
grain components (seed coat, embryo, endosperm, and cavity fluid). Orange, green, dark green, and violet colors represent 12, 15, 20, and 26 DAA. Three inde-
pendent biological replicates were used for proteomic analysis.
59 in endosperm, and 121 in cavity fluid (for detailed infor- 49 in endosperm (Table S9). For the discussion we selected
mation about these DEPs refer to Table S6). This analysis specific clusters which revealed the temporal dynamics of
aimed to determine the overall trend of enrichment in the the proteome (see below).
specific functional categories during the grain filling pro-
Comparative metabolite profiling in wheat grain
cess, as shown in Figure 3. Functional categorization of the
components during grain filling
identified proteins was performed according to Ghatak and
co-workers (Ghatak et al., 2021). Functional distributions of Metabolomics analysis of the different developing wheat
the total proteome in the four developmental stages (12, grain components (seed coat, embryo, endosperm, and
15, 20, and 26 DAA) of the different grain components cavity fluid) was conducted using GC-time-of-flight (TOF)-
(seed coat, embryo, endosperm, and cavity fluid) are MS. In total, 34 metabolites showed different levels at vari-
depicted in Figures S2–S5 via heatmap biclustering using ous developmental stages (12, 15, 20, and 26 DAA). The
the total NSAF score summed up for different functional identified metabolites were grouped into carbohydrates,
categories (Chaturvedi et al., 2013; Ghatak et al., 2021) amino acids, and organic acids. PCA showed a clear sepa-
(Table S7). In this analysis, DEPs were categorized accord- ration between all developmental stages for each wheat
ing to the MapMan plant functional ontology (see Experi- grain component (Figure S8, Table S10).
mental Procedures). In total, 410 unique DEPS were Distinct metabolite patterns for early (12 and 15 DAA)
identified in the seed coat, 815 in embryo, 372 in endo- and late (20 and 26 DAA) grain filling stages were deter-
sperm, and 492 in cavity fluid (Figure 3, Table S8). mined (Figure S9, Table S10). The identified metabolites
For the four dissected wheat grain components, K- demonstrated very similar levels between 12 and 15 DAA,
means cluster analysis of proteins in different grain filling which could be due to the short time interval (3 days)
stages was performed by the COVAIN toolbox (Sun and between the two respective stages. Between 20 and 26
Weckwerth, 2012), revealing spatially coordinated pro- DAA, which coincide with the accumulation of starch
teome changes during four different stages of grain devel- reserves (Dhatt et al., 2019), a clear difference was
opment (Figures S6 and S7). K numbers were different observed in the levels of the identified metabolites (Fig-
according to the different grain components. The value of ure S8, Table S10). Selected metabolites and their levels
k was 35 in seed coat and cavity fluid, 48 in embryo, and are depicted in Figure 4.
© 2021 The Authors.
The Plant Journal published by Society for Experimental Biology and John Wiley & Sons Ltd.,
The Plant Journal, (2021), doi: 10.1111/tpj.154106 Shuang Zhang et al.
(a) Seed coat (b) Embryo (c) Endosperm (d) Cavity Fluid
Celluar transport N-metabolism 0 Cell wall modification 0 Calvin cycle 0
0
Other TCA cycle N-metabolism
Cellular transport
LEA OPP oxidative
Stress biotic Transport
Unknown Electron transport
Cell wall synthesis -5 Co-factor and vitamine
S-assimilation -5 -5 Glycolysis -5
Minor CHO metabolism Gluconeogenesis
Cell division Cell division
Other Redox
Biodegradation of xenobiotic Secondary metabolism
Transport -10 Transaldolase
DNA synthesis -10 -10
-10 Cell transport Other RNA processing
Transport LEA
Amino acid degradation Nucleotide metabolism DNA sysnthesis
Secondary metabolism
Stress biotic Glucose-6-phosphate 1-dehydrogenase C1-metabolism
Hormone metabolism -15
Hormone metabolism -15 Other -15 Minor CHO metabolism Nucleotide metabolism -15
Signalling Tetrapyrrole synthesis Protein activation
PS. Lightreaction
RNA binding Protein modi Cell wall synthesis
Major CHO metabolism
Cell wall synthesis Cell division Tetrapyrrole synthesis
Major CHO metabolism Co-factor and vitamine Gluconeogenesis Protein modification
Tetrapyrrole synthesis Stress abiotic Calvin cycle Protein glycosylation
Protein folding Protein synthesis Amino acid metabolism Cell wall modification
P.S Lightreaction Glycolysis
Cell cycle Unknown Protein degradation
Regulation of transcription
Cell wall degradation Protein modification Stress abiotic
Calvin cycle
Metal Development Cell wall degradation
Glycolysis
Fermentation Other
6-phosphogluconate dehydrogenase Regulation of transcription
RNA processing Minor CHO metabolism
Electron transfer DNA synthesis Signalling
C1- metabolism Development
Amino acid synthesis Hormone metabolism
TCA cycle Unknown
Nucleotide metabolism
Fermentation Cell wall synthesis Protein targeting
Photorespiration
Secondary metabolism Major CHO metabolism Cell wall degradation Hormone metabolism
Development Redox TCA cylce Amino acid degradation
Amino acid metabolism biodegradation of xenobiotics Protein degradation Stress biotic
Protein synthesis Storage protein Signalling
Lipid metabolism Fermentation
Cell wall degradation Electron transport
Lipid metabolism Protein targeting Stress abiotic
Amino acid sysnthesis
Photorespiration Protein activation RNA processing
RNA binding RNA regulation
Protein targeting RNA binding
Cell organisation Protein sythesis
Protein modification
Development Tetrapyrrole synthesis Photorespiration
RNA processing
PS.lightreaction Transport Cell vesicle transport
Minor CHO metabolism
Regulation of transcription Glycolysis
Metal DNA synthesis
Cell wall modi Metal
Cell organisation Signalling Protein synthesis
Stress abiotic TCA cycle
Protein degradation Photorespiration
Redox Polyamine metabolism Lipid metabolism
Redox RNA binding
Nucleotide metabolism Calvin cycle
N-metabolism S-assimilation Lipid metabolism Secondary metabolism
Protein degradation Stress Electron transport Major CHO metabolism
12 DAA
15 DAA
20 DAA
26 DAA
12 DAA
15 DAA
20 DAA
26 DAA
12DAA
15 DAA
20 DAA
26 DAA
12 DAA
15 DAA
20 DAA
26 DAA
Significant DEPs : 410 Significant DEPs: 815 Significant DEPs : 372 Significant DEPs : 492
Figure 3. Heatmaps. (a) Differentially expressed proteins (DEPs) in the seed coat. (b) DEPs in the embryo. (c) DEPs in the endosperm. (d) DEPs in the cavity fluid.
Asparagine and aspartic acid levels changed consistently DAA. Hence, it can be concluded that in the early grain fill-
except in the endosperm. Asparagine accumulated to max- ing process the cavity fluid supplies sugars to the endo-
imum levels at 12 DAA in the endosperm, while aspartic sperm (Figure 4, Table S10).
acid showed the highest levels at 26 DAA (Figure 4). Fruc-
tose and glucose levels were highest in the early grain fill- DISCUSSION
ing stage (12 and 15 DAA) in all the four grain components
analyzed. Isoleucine, methionine, threonine, valine, and Previously, when studying the transportation and accumula-
lysine accumulated mostly in all components at 15 and 20 tion of nutrients in wheat plants, typically whole wheat grain
DAA (Figure 4). Galactose and maltose showed the same was considered (Barneix, 2007). All the physiological and
trend in the endosperm, embryo, and cavity fluid, with developmental processes in plants undergo a necessary inte-
maximum accumulation at 12 and 26 DAA, respectively gration process, which depends on the transport of hor-
(Figure S9). Some amino acids showed similar dynamic mones, metabolites, and other signals of the vascular system
changes in the seed coat, endosperm, and embryo (but not (van Bel et al., 2013). These integration processes stop at the
the cavity fluid). For example, putrescine and fumaric acid seed coat, which wraps the endosperm and embryo (Rad-
showed the highest levels at 12 and 15 DAA—similarly, chuk and Borisjuk, 2014). These three grain components fol-
leucine and lactic acid showed the highest levels at 20 and low their own developmental program to form an interactive
26 DAA (Figure S9, Table S10). system (Sreenivasulu et al., 2006). Grain filling substrates are
In the seed coat, all primary metabolites showed low transported in the aqueous solution of the cavity fluid to the
levels in the late grain filling stage (20 and 26 DAA). In con- developing grain. There are indications that it is first trans-
trast, the levels of some photosynthesis-related metabo- ported into the endosperm cavity and thus released into the
lites and carbohydrate storage metabolites were higher. endosperm (Radchuk and Borisjuk, 2014). Accordingly, to
Most metabolites (but not tyrosine, proline, leucine, mal- understand the spatial and temporal dynamics of the grain
tose, and trehalose) in the embryo showed the highest filling process and the developing grain, it is necessary to
level at 15 DAA, indicating that primary metabolism was divide them into four parts, i.e., seed coat, endosperm,
active in early grain filling stages. These metabolites were embryo, and cavity fluid, for analysis. To reveal spatially
highly accumulated at 26 DAA. The embryo accumulated coordinated proteome changes, K-means cluster analysis of
proline in late grain filling stages (20 and 26 DAA), proba- proteins in different grain filling stages was performed using
bly to combat various stresses. In the cavity fluid, in con- the COVAIN toolbox (Sun and Weckwerth, 2012) (Table S9).
trast to other components, most metabolites showed the In the following, we discuss selected clusters, revealing the
highest levels at 26 DAA, except methionine, galactose, temporary proteome and metabolome dynamics of the four
glucose, and fructose, whose levels were highest at 12 grain compartments (Figures 5 and 6).
© 2021 The Authors.
The Plant Journal published by Society for Experimental Biology and John Wiley & Sons Ltd.,
The Plant Journal, (2021), doi: 10.1111/tpj.15410Multiomics and grain filling process in wheat 7
Seed Coat Embryo Endosperm Cavity Fluid
Carbohydrates Glucose Fructose Sucrose Trehalose Raffinose
0.8 0.015 0.3 20
1.5
0.6 15
0.010 0.2
1.0
0.4 10
0.5 0.005 0.1
0.2 5
0.0 0.0 0.0 0
0.000
12 DAA 15 DAA 20 DAA 26 DAA 12 DAA 15 DAA 20 DAA 26 DAA 12 DAA 15 DAA 20 DAA 26 DAA 12 DAA 15 DAA 20 DAA 26 DAA 12 DAA 15 DAA 20 DAA 26 DAA
Glycine Proline Serine Threonine Lysine
0.4 0.6
Metabolite Levels
0.075 0.015
0.3 0.075
0.4
0.050 0.2 0.010
0.050
0.1 0.2
0.025
Amino Acids
0.025 0.005
0.0
12 DAA 15 DAA 20 DAA 26 DAA 12 DAA 15 DAA 20 DAA 26 DAA 12 DAA 15 DAA 20 DAA 26 DAA 12 DAA 15 DAA 20 DAA 26 DAA 12 DAA 15 DAA 20 DAA 26 DAA
Alanine Aspartic acid Asparagine Methionine Glutamic acid
0.020 0.8
0.3
0.06 0.04
0.015 0.6
0.03
0.2
0.04 0.010 0.4
0.02
0.005 0.2
0.1 0.02
0.01
0.000
0.0
0.00 12 DAA 15 DAA 20 DAA 26 DAA
12 DAA 15 DAA 20 DAA 26 DAA 12 DAA 15 DAA 20 DAA 26 DAA 12 DAA 15 DAA 20 DAA 26 DAA 12 DAA 15 DAA 20 DAA 26 DAA
Citric acid Fumaric acid Malic acid Succinic acid Glutaric acid
Organic Acids
0.015 0.0015
0.06
0.0075 0.03
0.010 0.0010
0.04
0.0050 0.02
0.02 0.005 0.0005
0.0025
0.01
0.00
0.0000 0.000 0.0000
12 DAA 15 DAA 20 DAA 26 DAA 12 DAA 15 DAA 20 DAA 26 DAA 12 DAA 15 DAA 20 DAA 26 DAA 12 DAA 15 DAA 20 DAA 26 DAA 12 DAA 15 DAA 20 DAA 26 DAA
Figure 4. Abundance levels of selected metabolites. The means of the abundance levels from four different components (seed coat, embryo, endosperm, and
cavity fluid) during different grain developmental stages (12, 15, 20, and 26 DAA) are shown. Data are presented as the mean standard deviation from three
biological replicates for each grain component and developmental stage. DAA, days after anthesis.
Seed coat upregulated at 15 DAA. The seed coat turns green at 20
DAA. The levels of proteins such as the calcium-binding
In the seed coat, cluster 32 (Table S9) showed the proteins
protein Caleosin and the lipid A export ATP-binding/
with the highest level at 12 DAA during early grain filling.
permease protein MsbA were increased at this stage, indi-
The proteins included trafficking protein particle complex
cating high lipid metabolism. The fresh weight of the seed
subunit 9, which may play a role in vesicular transport
coat decreased at 26 DAA. Late embryogenesis abundant
from the endoplasmic reticulum (ER) to the Golgi appara-
(LEA) protein and PBSP domain protein were found at high
tus. Proteins involved in cell elongation were also found
levels. Proteins involved in light reactions and nitrate
(Elongation factor-like protein and Transcription elongation
metabolism were upregulated at 26 DAA. Among them,
factor SPT6). At 15 DAA, proteins which are involved in
oxygen-evolving enhancer protein 2 and glutamate dehy-
protein trafficking (trafficking protein particle complex sub-
drogenase (GDH) were activated at 26 DAA (Figure 5). Most
unit 2 and Clathrin-binding protein) were highly expressed.
primary metabolites showed low levels in the seed coat,
Additionally, the abundance of non-specific lipid-transfer
but with a few exceptions. Phenylalanine, tyrosine, lactate,
protein was also highest at 15 DAA. Sulfate adenylyltrans-
raffinose, and myo-inositol showed high levels at 26 DAA.
ferase and a transporter family protein, which are involved
Raffinose and myo-inositol peaked at 26 DAA, showing
in transport and sulfate assimilation, respectively, were
© 2021 The Authors.
The Plant Journal published by Society for Experimental Biology and John Wiley & Sons Ltd.,
The Plant Journal, (2021), doi: 10.1111/tpj.154108 Shuang Zhang et al.
Figure 5. Selected functional categorization of four different components during different grain filling stages using bicluster plots. NSAF values were averaged
over three biological replicates. SC, seed coat; EB, embryo; EP, endosperm; CF, cavity fluid.
carbohydrate storage was activated in the seed coat. Fur- transferase were upregulated at 20 and 26 DAA, respec-
thermore, myo-inositol is important for phosphate storage tively (Figure 5). Only a few metabolites were highly accu-
and transport of plant hormones. mulated at 26 DAA: aspartic acid, glutamic acid, leucine,
citric acid, and maltose. Aspartic acid and glutamic acid
Endosperm
are important substrates for nitrogen (N) supply, indicating
In the endosperm at 12 DAA, the levels of proteins that N metabolism is active at 26 DAA.
involved in energy metabolism and protein trafficking and
Embryo
elongation factors were highest. Legumain/vacuolar pro-
cessing enzyme was highly expressed at 15 DAA, illustrat- The embryo has a highly distinct proteome compared to
ing high protein processing activity at this stage the other tissues. In the early grain filling stage (12 DAA),
(Table S9). The levels of many proteins involved in ubiqui- the levels of proteins which are involved in energy and
tin/proteasome processes were also increased at 15 DAA. lipid metabolism were increased. The proteins involved in
Proteins involved in cell vesicle transport and amino acid sugar hydrolysis and DNA replication were present at high
metabolism/synthesis were upregulated at 15 DAA. The levels at 15 DAA. Proteins involved in post-translational
protein transportation is still active at 20 DAA (Vesicle protein modification and cell vesicle transport were upreg-
transport v-SNARE 11-like). Moreover, glutathione S- ulated at 15 DAA. Clathrin heavy chain was significantly
transferase 1 levels were increased at 20 DAA, indicating a upregulated at 15 DAA (Table S9). The levels of proteins
defense reaction against exogenous toxins. In the late related to ubiquitin, lipid storage, and protein transport
grain filling stage (at 26 DAA), proteins involved in protein were increased at 20 DAA. Vicilin, which is involved in pro-
storage (Vicilin) and amino acid metabolism tein storage, and the LEA protein were present at high
(aminomethyltransferase) were highly abundant. Proteins levels at 26 DAA. Proteins involved in amino acid metabo-
involved in nitrate metabolism and protein amino acid acti- lism and degradation, protein glycosylation, and protein
vation showed upregulation at 26 DAA. Asparaginyl-tRNA targeting were upregulated at 26 DAA. Among them, PBSP
synthetase, which is involved in translation, was upregu- domain protein, beta-hexosaminidase 2, and legumain/vac-
lated at 26 DAA. Amino acid transporter and amino acid uolar processing enzyme were upregulated at 26 DAA
© 2021 The Authors.
The Plant Journal published by Society for Experimental Biology and John Wiley & Sons Ltd.,
The Plant Journal, (2021), doi: 10.1111/tpj.15410Multiomics and grain filling process in wheat 9
Low High
(a) (b) Proteins
Metabolites
12 15 20 26
DAA
Seed Coat
Embryo
(c) (d)
Cavity Fluid
Endosperm
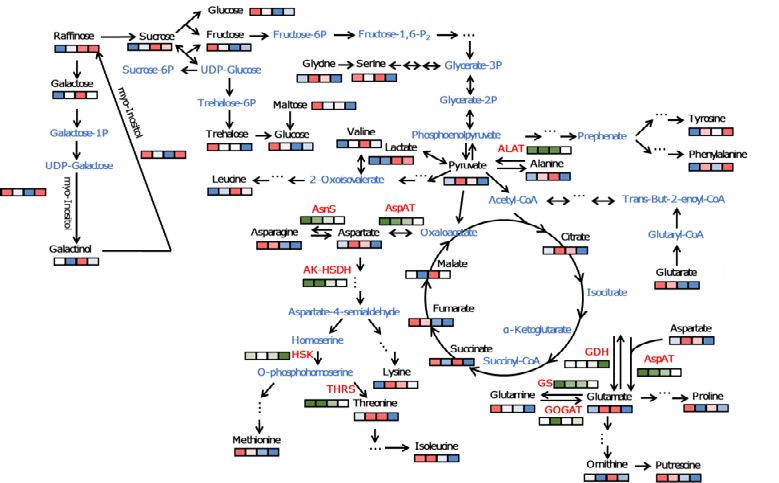
Figure 6. Integration of metabolite and protein dynamics in a biochemical pathway map. (a) Seed coat. (b) Embryo. (c) Endosperm. (d) Cavity fluid. Metabolites
are written in black letters; enzymes are written in red letters. Levels of metabolites and proteins were averaged over three biological replicates after normaliza-
tion. Four consecutive squares from left to right indicates four developmental stages (12, 15, 20, and 26 days after anthesis). Values of metabolite levels from
minimal to maximal are colored from blue to red and protein concentrations are colored from white to green. Metabolites identified by GC-MS are written in
black; metabolites not identified by GC-MS are written in blue. ALAT, alanine aminotransferase; AK-HSDH, bifunctional aspartokinase/homoserine dehydroge-
nase I; AsnS, asparagine synthetase; AspAT, aspartate aminotransferase; GDH, glutamate dehydrogenase; GOGAT, glutamate synthase; GS, glutamine syn-
thetase; HSK, homoserine kinase; THRS, threonine synthase.
(Figure 5). Most of the metabolites showed the highest export of proteins, rRNA, snRNA, and some mRNA. Other
levels at 15 DAA, except tyrosine, proline, leucine, maltose, proteins whose levels were decreased during grain filling
and trehalose. These metabolites were highly accumulated were involved in histidyl-tRNA synthesis and protein ubiq-
at 26 DAA. Primary metabolism was activated in early uitination. No glutamine-related enzymes were detected in
grain filling, and carbohydrates were accumulated as mal- cavity fluid. At 12 DAA, several reductases and transferases
tose and trehalose at 26 DAA. The embryo stored proline related to amino acid metabolism were present at high
in the late grain filling stage, most probably as a protective levels, such as gamma-glutamyl phosphate reductase and
mechanism to various kinds of stresses. homoserine kinase (HSK). The levels of detected enzymes
involved in transformations of amino acids decreased dur-
Cavity fluid
ing grain filling, indicating that the cavity fluid contained
Cavity fluid is the sap in the grain cavity, which is sur- enzymes at high concentrations. Among all the detected
rounded by endosperm and the vascular bundle. Cavity metabolites, methionine, galactose, glucose, and fructose
fluid sampling is prone to contamination by surrounding peaked at 12 DAA (during early grain filling), indicating
cells and tissues. Accordingly, all our data on cavity fluid that the cavity fluid supplies sugars to the endosperm. At
need to be handled with care and contamination cannot be 15 DAA, the levels of proteins involved in ubiquitin and
excluded. However, proteins and metabolites showed sig- signal transduction increased. Furthermore, many enzymes
nificant differences in comparison to the endosperm and like isocitrate dehydrogenase related to the tricarboxylic
also the seed coat and embryo. Therefore, we discuss acid cycle (TCA) were also found to be highly abundant.
these data but remind the reader about these difficulties in Peroxidase and FAD-binding domain-containing protein
sampling. were identified at 20 DAA. Cavity fluid turned less volumi-
In cavity fluid, proteins whose levels were increased dur- nous and stickier at 26 DAA. Proteins which are involved in
ing the early grain filling stage were involved in disease disease resistance such as endochitinase and PBSP
resistance (endochitinase and PBSP domain protein) and domain protein were identified at high levels at this stage
sugar hydrolysis, while the proteins whose levels were (Figure 5, Table S9). Proteins involved in development,
decreased during grain filling were involved in the nuclear transport, and hormone metabolism were upregulated.
© 2021 The Authors.
The Plant Journal published by Society for Experimental Biology and John Wiley & Sons Ltd.,
The Plant Journal, (2021), doi: 10.1111/tpj.1541010 Shuang Zhang et al.
Unlike other grain compartments, most metabolites in the except for the embryo. The serpin family proteins irre-
cavity fluid showed the highest levels at 26 DAA, highlight- versible inhibit endogenous and exogenous proteases.
ing the importance of this stage and the active transport of These proteases play an important role in plant growth,
all necessary metabolic components by the cavity fluid development, the adversity response, and defense against
during the last phase of grain filling. insects and pathogens (Roberts and Hejgaard, 2008). Ser-
pins are present in wheat grain, and their content is as
Regulation of proteins during the grain filling process
high as a few percent of the total protein content. They
Protein disulfide isomerase family. Different isoforms of may be present in the seeds as a defense barrier that pro-
the PDI family proteins participate in the formation of inter- tects stored proteins from digestion (Vensel et al., 2005).
molecular or intramolecular disulfide bonds and the Previous studies have shown that serpin is upregulated
assembly of glutenin macropolymers (GMPs) through under osmotic conditions such as salt and cold stress
intramolecular disulfide bonds between wheat grain pro- (Lampl et al., 2010).
teins (Wilkinson and Gilbert, 2004). Therefore, they play an
important role in the maturation of secreted plasma mem- Transporters, maturation and transport of pro-
branes and storage proteins (Houston et al., 2005). In teins. Amino acid selective channel proteins, which are
wheat, nine PDI and PDIL genes were cloned, and their involved in transmembrane amino acid transporter activity,
transcript levels during endosperm development indicate showed the highest abundance at 12 DAA in the seed coat
that they are related to storage protein synthesis and depo- and embryo. In endosperm, their levels gradually
sition, which is closely related to gluten and bread quality increased during grain filling, with a peak during late grain
(d’Aloisio et al., 2010). Analysis based on iTRAQ showed filling (Tables S2 and S7).
that two PDI proteins (B9A8E3 and Q9FE55) are highly The general vesicular transport factor p115 plays an
expressed during early grain development (7–14 DAA), important role in intracisternal transport in the Golgi stack.
which helps the folding and maturation of storage proteins It was highly accumulated at 12–20 DAA in the seed coat
and increases gluten quality (Ma et al., 2014a). In our and cavity fluid. In the endosperm, its levels remained high
study, several different isoforms of PDI family proteins (peaking at 20 DAA). In the embryo, it was highly accumu-
showed tissue-dependent expression patterns. The highest lated at 12 DAA. The situation was the same for the protein
abundance was observed at 12 DAA in all four compo- transport protein Sec23, which promotes the formation of
nents. In endosperm and cavity fluid, levels remained rela- transport vesicles from the ER. Legumain/vacuolar pro-
tively high from 12 to 20 DAA. But in the embryo, its cessing enzyme has been identified as the proteinase
abundance at 12 DAA was more than two times that of responsible for the maturation and activation of vacuolar
other stages (Table S2, S7). Accordingly, our analysis proteins in plants. It was significantly accumulated at 26
demonstrates the complex expression pattern of PDIs dur- DAA in cavity fluid. The signal recognition particle (SRP)
ing development and paves the way for breeding strate- protein SRP72, which has a crucial role in targeting secre-
gies to manipulate GMP content in the grain. tory proteins to the rough ER membrane, showed high
abundance at 12–20 DAA in the seed coat, embryo, and
LEA proteins. LEA proteins accumulate at later stages, cavity fluid. However, in the endosperm, it was highly
especially under stress conditions such as drought and low accumulated at 20–26 DAA. The vacuolar sorting receptor
temperature (He et al., 2011). Seven LEA proteins were pre- is involved in the sorting and packaging of soluble vacuo-
sent from 20 to 26 DAA in the embryo. The LEA proteins lar proteins into transport vesicles. It was highly accumu-
have an important role in protecting grain from serious lated at 20–26 DAA in three grain organs, while in cavity
dehydration during the late developmental stages. In a fluid, it had high abundance at 12–20 DAA.
recent study, the levels of eight LEA proteins increased sig-
nificantly at 28 DAA (Ma et al., 2014a). Compared to other Alternative energy pathways. During late wheat grain
components, the seed coat and embryo contained much development, due to insufficient energy for glycolysis and
more isoforms. LEA protein 2 was present in all four grain the TCA cycle, the alcohol fermentation pathway can pro-
components (Table S2, S7). It showed decreased abun- vide supplementary energy under anaerobic conditions. In
dance during grain filling except in the embryo, where its addition, the expression of formate dehydrogenase
levels peaked at 26 DAA. increased at 15 DAA and further increased at the late filling
stage and the drying period (Tables S2 and S7). This is
Serpin family. Several other proteins related to stress/de- consistent with the transition from cell growth and differ-
fense pathways were identified, including nine, five, eight, entiation to starch synthesis. The shift from central carbon
and one serpin isoforms in the endosperm, seed coat, cav- (C) metabolism to alcohol fermentation may be important
ity fluid, and embryo, respectively (Tables S2 and S7). Ser- for starch synthesis and accumulation during grain devel-
pin expression increased in all tissues from 12 to 26 DAA opment (Guo et al., 2012a). Alcohol fermentation is a
© 2021 The Authors.
The Plant Journal published by Society for Experimental Biology and John Wiley & Sons Ltd.,
The Plant Journal, (2021), doi: 10.1111/tpj.15410Multiomics and grain filling process in wheat 11
branch of the pyruvate glycolysis pathway and is a two- 12 to 26 DAA, two isoforms only at 15 DAA, and two iso-
step reaction. The focus is on oxidizing NADH to NAD+ and forms at 20 DAA). The highest downregulation of 14-3-3
then generating ATP without consuming oxygen. This is proteins was observed at 15 and 20 DAA (Table S11). Pro-
essential for pre-adapting to hypoxia and seed develop- teins of the 14-3-3 family play regulatory roles in various
ment (Cao et al., 2016). cellular physiological processes, such as cell signal trans-
duction, cell cycle regulation, N and C assimilation, and
Differential accumulation patterns of proteins during the
defense mechanisms (Ferl, 1996; Fulgosi et al., 2002). It has
grain filling process
been proposed that 14-3-3 proteins may decrease starch
Starch biosynthesis during grain filling and develop- biosynthesis by inhibiting SS in a large protein complex,
ment. In cereals, grain yield is largely determined by suggesting its possible role in grain development (Fulgosi
starch accumulation during the grain filling period. There et al., 2002; Sehnke et al., 2001). In the present study, three
are three sucrolytic enzymes in higher plants: sucrose syn- isoforms of granule-bound SSI were identified. The levels
thase (SuSy), acid invertase, and neutral invertase. In most of all isoforms increased gradually from 12 to 26 DAA
rapidly filling sinks such as seeds, SuSy has the highest (Table S11). This upregulation can be correlated with the
activity (Sung et al., 1989). SuSy acts as the first enzyme in expression of 14-3-3 proteins, which was reduced dramati-
the conversion of sucrose to starch, and thus, SuSy activity cally after 15 DAA, when starch synthesis was upregulated.
is an excellent predictor of sink strength (Sung et al., Zhang and co-workers observed low expression of 14-3-3
1989). Sink strength is the ability of a sink to attract or proteins in the rice grain with high starch content com-
import carbohydrates. Accordingly, SuSy may be valuable pared to grain with low starch content (Zhang et al., 2014).
to assess relative sink strength among rice breeding lines Consistent with this hypothesis, we found here that the
(Counce and Gravois, 2006). In the present study, key pro- decreased expression of 14-3-3 proteins is inversely related
teins related to starch biosynthesis, including SuSy, starch to starch synthesis and accumulation. A proteomics study
synthase (SS), starch phosphorylase, granule-bound SSI, on maize (Zea mays) grain reported significant accumula-
and soluble SS, were shown to be significantly up- or tion for three isoforms of 14-3-3 proteins at the early stage
downregulated (Table S11). The levels of all identified pro- (3–10 DAA), and then downregulation until grain maturity
teins increased gradually in endosperm from 12 to 26 DAA, (Yu et al., 2016). A similar pattern has also been observed
and the accumulation of starch biosynthesis proteins in in castor (Ricinus communis) grain (Houston et al., 2009).
endosperm was most pronounced (Table S11). A similar In endosperm, one 14-3-3 protein isoform
pattern was observed in the embryo (gradual increase (A0A1D6CLX4) was significantly downregulated at 20
from 12 to 26 DAA). There was a gradual decrease in the DAA, whereas proteins related to starch synthesis, includ-
abundance of starch biosynthesis proteins in the seed coat ing three isoforms of granule-bound SS and soluble SS,
during the grain filling period. As discussed below, increased in their levels gradually from 12 to 26 DAA.
decreased expression of 14-3-3 isoforms in the cavity fluid Interestingly, we found three isoforms of PPDK, all of
and the embryo could result in an increase of starch syn- them upregulated from 12 to 26 DAA (Table S11). Several
thesis during the grain filling period. Similarly, in the endo- proteomic studies reported that multiple isoforms of
sperm, pyruvate phosphate dikinase (PPDK) has an PPDK accumulate at high levels in the developing grain
essential role in starch synthesis and energy supply during of cereals such as rice (Xu et al., 2008b) and wheat (Ma
grain development, i.e., the upregulation of PPDK could et al., 2014b), indicating that PPDK has an essential role
support starch biosynthesis. The endosperm is the primary in starch synthesis and energy supply during grain devel-
storage site of starch. Its function is to support and nurture opment (Wang et al., 2020). PPDK catalyzes the reversible
the developing embryo. It has a central role in regulating conversion of pyruvate, ATP, and Pi to phosphoenolpyru-
embryo development (An et al., 2020), so the accumulation vate (PEP), AMP, and PPi (Yu et al., 2016). PPDK is highly
of starch biosynthesis proteins in endosperm tissue is not efficient in remobilizing carbon skeletons that must be
surprising. metabolized via pyruvate, hence clearly demonstrating
the gluconeogenic function of converting pyruvate to PEP
14-3-3 proteins, pyruvate phosphate dikinase, and starch and consuming ATP (Eastmond et al., 2015). The forma-
synthesis during grain development. In this study, five, tion of pyruvate may be beneficial to synthesis at the
seven, eight, and seven isoforms of 14-3-3 proteins were grain filling stage and the PPi could be used for the ini-
significantly accumulated in the endosperm, seed coat, tial AGPase step in starch biosynthesis. Interestingly, the
cavity fluid, and embryo, respectively. In the embryo, two levels of all three isoforms of PPDK in the seed coat and
isoforms were upregulated at 20 DAA and five isoforms cavity fluid decreased gradually at 20–26 DAA; these iso-
were downregulated at 26 DAA. Out of eight isoforms in forms were not detected in the embryo (Table S11).
the cavity fluid, the levels of seven isoforms decreased dur- Therefore, these results indicate that PPDK in the endo-
ing 15–26 DAA (three isoforms decreased gradually from sperm and 14-3-3 in the cavity fluid may play important
© 2021 The Authors.
The Plant Journal published by Society for Experimental Biology and John Wiley & Sons Ltd.,
The Plant Journal, (2021), doi: 10.1111/tpj.1541012 Shuang Zhang et al.
roles in starch synthesis and energy supply during wheat tissues except for the embryo, in which the expression of
grain filling and development. proteins involved in protein synthesis increased gradually
from 12 to 26 DAA. Active protein turnover (proteolysis
Cell division and cell wall modification during grain fill- and synthesis) was found during the early development of
ing. Effective grain filling involves a transition from cellu- rice and maize grain (Xu et al., 2008b; Yu et al., 2016).
larization (cell growth) to starch synthesis and Overall, these expression patterns of proteins involved in
accumulation. At the early stage of grain filling (6–13 DAA), protein biosynthesis in the endosperm, seed coat, and cav-
grain demonstrates a rapid increase in cell number and ity fluid suggest that protein turnover and rearrangements
size. In the mid-stage of grain development (14–24 DAA), are also important and effective in the early stage of wheat
there is a small increase in cell number and size, which grain cell division and enlargement.
eventually decrease completely. In contrast, storage mate- It is observed that the embryo remains quite small until
rials (mainly starch) are synthesized and accumulate 15–20 DAA. Apparently, from 15 to 30 DAA, growth of the
rapidly (Laudencia-Chingcuanco et al., 2007). In the endo- embryo is quite rapid and it is during this period that dif-
sperm, the levels of proteins related to cell division ferentiation of the axial organs (coleoptile, shoot and root
decreased from 20 to 26 DAA (stronger decrease at 26 primordia, and coleorhiza) is initiated (Smart and Obrien,
DAA), consistent with the simultaneous starch accumula- 1983). Therefore, the expression of proteins involved in
tion in the endosperm. A small increase in the levels of cell protein synthesis in the embryo increases until 26 DAA to
division proteins from 12 to 20 DAA was followed by a support its rapid growth and development from 15 to 30
sudden downregulation at 26 DAA. The levels of cell divi- DAA.
sion proteins in the embryo decreased gradually from 12
to 26 DAA (Table S11). Similarly, many cell wall degrada- Integration of metabolites and proteins into biochemical
tion proteins were expressed in all grain components, pathways during the grain filling process. We obtained
demonstrating upregulation from 12 to 20 DAA and then dynamic metabolomic and proteomic profiles of wheat
downregulation at 26 DAA (Table S11). grain components (seed coat, embryo, endosperm, and
Interestingly, in this study, we identified seven expansin cavity fluid) during different developmental stages (12, 15,
protein isoforms that significantly accumulated only in the 20, and 26 DAA). For a more intuitive display of the
cavity fluid. Expansins could be specifically involved in dynamic changes in the levels of the identified metabolites
grain enlargement and seed growth control (Mehdi et al., (blue-white-red color code) and related enzymes detected
2020). The functional mechanism of expansin involves dis- from shotgun proteomics (white-green color code) during
rupting hydrogen bonds between cellulose microfibrils the grain filling period, the metabolic pathways in four
and cross-linking glycans in the cell wall, permitting grain components are presented in Figure 6.
turgor-driven cell wall extension (Mcqueenmason and Cos- In the seed coat, most primary metabolites were present
grove, 1994; Mcqueenmason and Cosgrove, 1995). The at low levels in the late grain filling stage, with a few
obtained results are consistent with the cellularization exceptions. Phenylalanine, tyrosine, lactate, raffinose, and
phase (cell growth). A small increase in expansin protein myo-inositol were present at high levels at 26 DAA. Raffi-
levels was observed from 12 to 20 DAA and then a sudden nose and myo-inositol levels peaked at 26 DAA, indicating
downregulation was observed at 26 DAA (Table S11). It is carbohydrate storage was activated in the seed coat. Fur-
important to mention that a few expansin protein isoforms thermore, myo-inositol is important for phosphate storage
were also found in the endosperm and embryo. However, and transport of plant hormones. Myo-inositol is linked to
none of them showed any significant up- or downregula- the decline in chlorophyll loss for photosynthetic mainte-
tion during grain filling (Table S11). nance, protecting against oxidative damage under drought
stress (Li et al., 2020). The highly accumulated raffinose
Protein degradation and synthesis during grain fill- and myo-inositol at 26 DAA serve either as an energy and
ing. Our analysis showed that many proteins involved in carbon storage reserve for future biological processes or
protein degradation were significantly expressed in all four as protectants against stresses (Peterbauer and Richter,
components, peaking from 12 to 15 DAA in the endosperm 2001). Among the detected enzymes in the seed coat, only
and embryo and from 12 to 20 DAA in the seed coat and GDH and HSK, which are related to N metabolism (Diab
cavity fluid. A significant decrease was observed at 26 DAA and Limami, 2016) and amino acid interconversion,
(Table S11). Some of these proteins are key components showed increased expression during the grain filling per-
of the ubiquitin/26S proteasome pathway and play impor- iod. These observations suggest that the seed coat serves
tant roles in protein degradation and in cellular and devel- as the ‘source’ for other grain components in the late grain
opmental events (Moon et al., 2004; Vierstra, 2009). Many filling period. The situation was similar in the endosperm.
proteins related to protein synthesis, e.g., proteolysis- After the free amino acids are transported to the destina-
related proteins, showed similar expression patterns in all tion (developing endosperm), the conversion between
© 2021 The Authors.
The Plant Journal published by Society for Experimental Biology and John Wiley & Sons Ltd.,
The Plant Journal, (2021), doi: 10.1111/tpj.15410You can also read