Spatio-Temporal Dynamics of Feed Grain Demand of Dairy Cows in China - MDPI
←
→
Page content transcription
If your browser does not render page correctly, please read the page content below
sustainability

Article
Spatio-Temporal Dynamics of Feed Grain Demand of
Dairy Cows in China
Chao Yang Dong 1 , Bei Bei Ma 1, * and Chun Xia LU 2,3, *
 1    School of Geography and Tourism, Shaanxi Normal University, Xi’an 710119, China;
      chaoyang1012@snnu.edu.cn
 2    Institute of Geographic Sciences and Natural Resources Research, Chinese Academy of Sciences,
      Beijing 100101, China
 3    University of Chinese Academy of Sciences, Beijing 100049, China
 *    Correspondence: mabb@snnu.edu.cn (B.B.M.); lucx@igsnrr.ac.cn (C.X.L.)

 Received: 2 October 2019; Accepted: 12 January 2020; Published: 16 January 2020

 Abstract: As the income of urban and rural residents has increased in recent decades in China,
 dairy products have become an important part of the Chinese diet. Therefore, keeping up
 with the growing demand for feed grain for dairy cows is a critical issue of feed grain security.
 Utilizing traditional statistical and spatial statistical methods, this study analyzes the spatio-temporal
 dynamics of dairy cow feed grain (DCFG) demand on the provincial, regional, and national levels
 across China from 1990 to 2016. Additionally, this paper explores the impacts of various factors on the
 spatio-temporal dynamics of DCFG demand using the Geo-Detector method. The results demonstrate
 that: (1) the temporal dynamics of DCFG demand can be divided into three stages of slow growth,
 rapid growth, and high-level stability, and the relative level of DCFG demand in the whole animal
 husbandry tends to decline; (2) at the regional and national levels, the spatial concentration of high
 DCFG demand has intensified; in particular, North China was the region where the largest demand
 for DCFG was localized and was increasing at the highest rate; (3) based on the hot spot analysis of
 provincial DCFG demand, the high and low demand provinces of DCFG have sharp characteristic
 contrast from north to south China; (4) the spatio-temporal dynamics of DCFG demand in China
 were essentially co-affected by the four groups of factors (e.g., resource endowment, feeding scale,
 feeding technology, and market environment), of which resource endowment and feeding scale
 were the dominant factors. Therefore, in the future, dairy cow feeding in China should promote
 grain-saving feeding technology, improve the utilization of forage, expand large-scale feeding, and
 create a good market environment to ensure the reasonable development and sustainability of
 DCFG demand.

 Keywords: dairy cow feed grain (DCFG); spatio-temporal; feed grain conversion ratio; China

1. Introduction
     A global consensus has been reached that livestock feed demand is a major component of the
global demand for grain in the 21st century [1,2]. Global food supply poses a substantial challenge to
governments as populations are being lifted out of poverty, resulting in an increased appetite for meat
and dairy products [3]. Just like the rest of the world, the rapid development of China’s urbanization
and increase in per capita income of urban and rural residents has led to significant changes in national
dietary structure [4]. The changes are mainly manifested in the form of a decrease in the proportion of
grain consumption and a relative increase in meat, egg, and milk consumption [4]. However, China’s
per capita share of meat, egg, and milk consumption is still far less when compared with developed
countries such as the United States of America, Australia, etc., and it is predicted that the population’s

Sustainability 2020, 12, 663; doi:10.3390/su12020663                        www.mdpi.com/journal/sustainability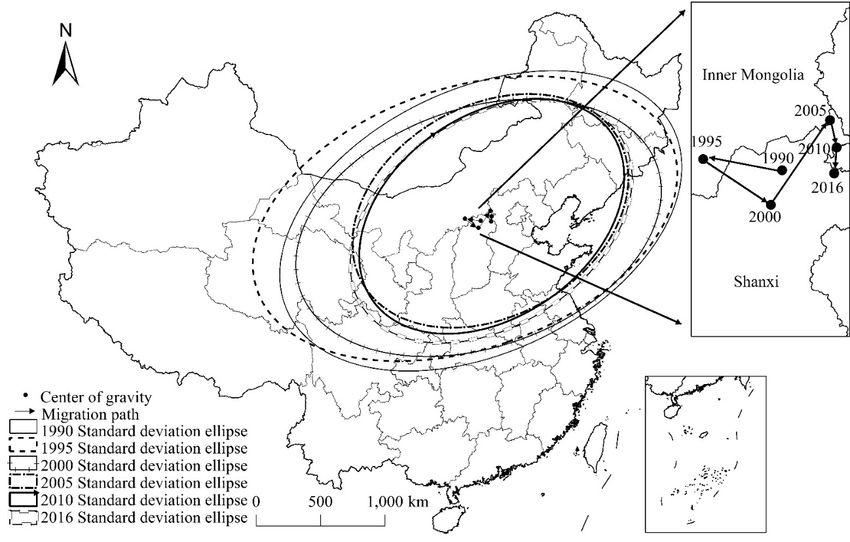
Sustainability 2020, 12, 663                                                                         2 of 17

appetite for meat, egg, and milk products will push this growth even higher [5]. Thus, the increasing
demand for livestock products has led to an increasing demand for feed grains [6,7]. It is estimated
that the feed grain demand in 2020 and 2030 will account for 50% and 55%, respectively, of the total
Chinese grain demand [5], and therefore, feed grain supply will be a major challenge to China’s grain
security [8,9].
      In 2000, the Chinese government launched the “School Milk Program” to improve the nutritional
status of elementary and junior middle school students. In spring of 2017, approximately 21 million
students benefited from this program, and the nationwide dairy average supply of daily drinking
milk for these students reached 16.65 million servings [10]. There is a close relationship between
residents’ per capita income and milk consumption. Statistically, for every 1% increase in income, urban
residents’ and rural residents’ milk consumption increases by 67% and 27% respectively [11]. In 2017,
the per capita milk consumption of urban and rural residents was 16.48 kg and 6.90 kg, respectively,
which represents an increase of approximately 260% and 527% when compared to the amount of milk
consumed in 1990 [12]. Dairy milk plays an increasingly important role in Chinese people’s diet [13].
In 1990, China had 2.69 million dairy cows, and by 2016, this number had surged to 10.37 million [14].
Compared with other countries, the number of China’s dairy cows were sustained at a relatively high
level, comparatively, only India (48 million) and Brazil (21 million) had more dairy cows, while the
United States (9.32 million) and Russia (8.25 million) had fewer dairy cows than China in 2016 [15].
In 2017, the total population of China was approximately 1.39 billion, while India, Brazil, the United
States, and Russia had a population of 1.34 billion, 209 million, 326 million, and 145 million respectively.
Thus, comparatively, the per capita number of dairy cows is still at a low level in China [12]. All of the
above have stimulated the rapid development of China’s dairy cow husbandry.
      Therefore, it is of great importance to the future of China to analyze the changing demand in dairy
cow feed grain (hereinafter the DCFG). This study utilizes traditional and spatial statistical methods to
analyze the spatio-temporal dynamics of DCFG demand at multiple spatial levels (provincial, regional,
and national) from 1990 to 2016. Moreover, this study employs the GeoDetector method to explore the
relative impact of various factors on the spatio-temporal dynamics of DCFG demand. This paper aims
to reveal the spatio-temporal differentiation of DCFG demand and to provide reference for China’s
food security policy-making.

2. Literature Review
      According to the research content, the concept of feed grain is defined to include the grain directly
used for feeding and the grain consumed for processing feed, specifically to include corn, soybean,
sorghum, millet, barley, oats, and other minor grains [16–18]. The concept of concentrate feed is
defined to include grain used for feeding, grain processing by-products used for feeding, additives,
etc. [18,19]. Previous research on feed grain security mainly focused on the supply and demand,
domestic circulation, international trade, etc.

2.1. Study on the Supply and Demand of Feed Grain
     Supply and demand of feed grain has attracted significant attention both domestically and
internationally [16], and most research focuses on either supply [20,21] or demand [17] or the supply
and demand balance [4,22,23]. However, due to the differences in feed grain accounting methods and
feed grain conversion ratios, there are great ambiguities amongst the research findings [17]. Among the
various accounting methods, the demand method was most widely used, which simply involved
multiplying the feed grain conversion ratio by the animal products [24–26]. This method is also
employed by the US Department of Agriculture (USDA), the International Food Policy Research Institute
(IFPRI), and the Food and Agriculture Organization (FAO) of the United Nations [27]. Extensive
research has been done on the topic of supply and demand of feed grain in China. Many scholars
believe that both sectors of supply and demand of feed grain are rising, yet the feed grain supply is
lagging behind the increase in demand [4,7,22,23]. On the other hand, some scholars strongly believe
Sustainability 2020, 12, 663 3 of 17
that the demand of feed grain will decrease with the change in population structure [28]. More attention
has been paid to the prediction of feed grain demand [29–33]. Despite the differences in prediction
methods and results, many researchers agree that China’s feed grain demand will continue to rise in
the next decades [32,33], thus demonstrating the importance of research in China’s feed grain demand.
2.2. Study on the Domestic Circulation and International Trade of Feed Grain
In the research of feed grain circulation, the main focus was on circulation path [34–36] and
circulation system [37,38]. The basic pattern of circulation path is the transportation of feed grain from
northern China to southern China [4]. In terms of specific circulation strategy for the feed grain, the
researchers simulated the optimal circulation quantities and routes in the different regions in China
with the end goal of minimizing the transportation cost [34]. The results indicated generally long
transportation distance for regional distribution of feed grain in China [34]. The circulation system
stresses the need to coordinate the cooperative relationship among the main bodies of the raw grain
supply, as well as the relationship between the feed grain production and marketing areas [37,38].
On the other hand, studies on international trade of feed grain tended to focus on its evaluation of
import and export [39–41], the driving forces of import and export [42], and the trade path [43], and
researchers have found that international trade was an important solution to the problem encountered
by satisfying both the supply and demand of domestic feed grain market. Additionally, researchers
demonstrated that the main reason for the surge in feed grain imports was evident in the price difference
between the domestic and foreign markets [42].
2.3. Research Review
Consequently, an important characteristic of feed grain research is to integrate feed grain into the
overall structure of grain [32,44,45]. Furthermore, most research conducted on the topic of feed grain
for animal husbandry as a whole is completed with less attention paid to different types of livestock and
poultry, although some studies have been done for pig feed grain due to its huge demand [19,33,46].
Currently, only a few scholars have analyzed the DCFG demand [31,45,47], and most existing research
has only regarded the demand accounting of DCFG as a part of the demand accounting of animal
husbandry. Thus, it was easy to ignore the proportion of lactating cows when calculating the demand
of DCFG based on the dairy milk yield. Additionally, existing research on feed grain has been focused
either only at a certain time point or only at the national level. Time-series analysis at different spatial
scales is still scant. What is the temporal trend of feed grain demand of domestic dairy cows in China?
How has the DCFG demand changed at various spatial scales? Which factors have determined such
spatio-temporal dynamics? The above issues about the DCFG demand in China deserve further
discussion in order to better understand this immediate challenge of feed grain security.
3. Data and Methods
3.1. Data
3.1.1. Data Required for Feed Grain Demand Accounting
Data on dairy milk yield at the provincial level were collected from China Agriculture Statistical
Report and China Agriculture Yearbook from 1990 to 2016. Due to changes in statistical standards, data
on the average dairy milk yield and feed grain consumption per cow in dairy farmers and state-owned
collectives between 1990 and 2003 were obtained from the 1991–2004 National Assembly of Cost and
Benefit Analysis of Agricultural Products (hereinafter the National Assembly). The same two types of data
raised in free-ranging, small-, medium-, or large-scale farms from 2004 to 2016 were derived from the
2005–2017 National Assembly. Data about forage corn and soybean meal consumption were obtained
from the Wind Economic Database (https://www.wind.com.cn/en/edb.html).Sustainability 2020, 12, 663 4 of 17
3.1.2. Data Required for Influencing Factors
In the analysis of influencing factors, corn yield and pasture area were collected from the 1991–2017
China Statistical Yearbook. Soybean yield was obtained from the 1991–2017 China Agriculture Yearbook.
Data related to the proportion of large-scale farms/households with more than 100 dairy cows were
from the 2001–2017 China Animal Husbandry and Veterinary Yearbook. Data related to the proportion of
mechanized milking in large-scale dairy farms, the average daily milk yield per cow, per capita milk
consumption of urban residents, and the average price of fresh milk were collected from the 2006–2017
China Dairy Yearbook and 2017 China Statistical Yearbook.
3.1.3. Map Data
GIS shape files of China’s provincial administrative division were downloaded from the National
Catalogue Service for Geographic Information [48]. In this study, the study area only includes the 31
provincial-level administrative units in mainland China. In addition, Chongqing was promoted to a
centrally-administrated municipality in 1997. Data of Chongqing were included in those of the Sichuan
Province before 1997. Therefore, Chongqing was not analyzed as a provincial unit from 1990 to 1996.
3.2. Feed Grain Conversion Ratio
Most existing research adopted the national average of feed grain conversion ratio for calculating
the DCFG demand, which is not precise enough for either temporal or spatial levels [7,17]. Feed grain
conversion ratio is the ratio measuring the efficiency that the bodies of livestock convert feed grain
into the desired output [24,26]. For dairy cows, the output is dairy milk. Specifically, in this study, feed
grain conversion ratio represents the amount of feed grain consumed by dairy cows per producing 1
kilogram of milk. The National Assembly did not report dairy milk yield and feed grain consumption
data for all the provincial units during the 1990–2016 period. Therefore, for the provinces with statistical
data tallied in the National Assembly, the feed grain conversion ratio was based on the average value of
the conversion ratio of the dairy farmers and the state-owned collectives from 1990 to 2003. Also, the
feed grain conversion ratio was based on the average value of the conversion ratio of free-range and
medium-scale farms from 2004 to 2016. For provinces with missing values in the National Assembly,
spatial interpolation based on neighboring provinces or temporal averaging was done to replace the
missing values.
After the preprocessing of data, feed grain conversion ratio in the 31 provincial units from 1990
to 2016 was obtained. Table 1 shows the national average of feed grain conversion ratio in China
from 1990 to 2016. Table 2 shows the values range and mean value of feed grain conversion ratio for
each province.
Table 1. National average feed grain conversion ratio of dairy cows in China, 1990 to 2016.
Feed Grain Fed Grain Feed Grain
Years Years Years
Conversion Ratio Conversion Ratio Conversion Ratio
1990 0.39 1999 0.46 2008 0.37
1991 0.39 2000 0.40 2009 0.37
1992 0.45 2001 0.40 2010 0.38
1993 0.49 2002 0.37 2011 0.38
1994 0.48 2003 0.39 2012 0.38
1995 0.41 2004 0.37 2013 0.39
1996 0.42 2005 0.38 2014 0.38
1997 0.45 2006 0.39 2015 0.37
1998 0.42 2007 0.37 2016 0.37Sustainability 2020, 12, 663 5 of 17
Table 2. Value Range and Mean Value of feed grain conversion ratio by provinces in China, 1990
to 2016.
Feed Grain Conversion Ratio Feed Grain Conversion Ratio
Provinces Provinces
Range Mean Range Mean
Beijing 0.25–0.81 0.38 Hubei 0.27–0.52 0.38
Tianjin 0.32–0.57 0.42 Hunan 0.21–1.33 0.59
Hebei 0.35–0.57 0.41 Guangdong 0.21–0.78 0.44
Shanxi 0.28–0.63 0.39 Guangxi 0.26–0.57 0.39
Inner Mongolia 0.16–0.81 0.37 Hainan 0.37–1.68 0.48
Liaoning 0.24–0.39 0.34 Chongqing 0.26–0.57 0.42
Jilin 0.26–0.47 0.36 Sichuan 0.26–0.57 0.41
Heilongjiang 0.30–0.55 0.36 Guizhou 0.30–0.66 0.46
Shanghai 0.32–0.54 0.39 Yunnan 0.22–0.67 0.38
Jiangsu 0.27–0.47 0.37 Tibet 0.31–0.67 0.40
Zhejiang 0.25–0.49 0.40 Shaanxi 0.28–0.57 0.40
Anhui 0.26–0.62 0.38 Gansu 0.13–0.80 0.40
Fujian 0.30–0.49 0.36 Qinghai 0.29–0.61 0.39
Jiangxi 0.32–0.56 0.40 Ningxia 0.25–0.64 0.42
Shandong 0.21–0.48 0.38 Xinjiang 0.26–0.56 0.37
Henan 0.22–0.67 0.39 - - -
3.3. Methods
3.3.1. Feed Grain Demand Estimation
Among the methods of feed grain demand estimation, the following method in Formula (1) is the
most widely used in the existing research, because of data availability and its simple calculation [24–26].
1 fm
FGDp = Pm × γm × , γm = (1)
k wm
where FGDp represents the DCFG demand; Pm and γm are dairy milk yield and feed grain conversion
ratio, respectively; k is the proportion of lactating cows in all the dairy cows (k is about 48%); fm and wm
represent the amount of feed grain and dairy milk yield per dairy cow, respectively. This study added
the proportion of lactating cows in the calculation of DCFG. During 2016–2017, the project’s research
team conducted studies on more than 10 large modern ranch enterprises in Beijing, Inner Mongolia,
Shandong, and Jiangsu. According to the survey results, it was determined that the proportion of
lactating cows in all the dairy cows is about 48%.
3.3.2. Standard Deviational Ellipse
The standard deviation ellipse (SDE) method was proposed by Lefever in 1926 [49]. It is a common
method to study the spatial distribution of geographical elements. Based on the method of SDE,
the central trend, concentration degree, and direction trend of geographical elements distribution can
be studied. Here, the SDE is used to analyze the spatial dynamics of DCFG demand. The long and short
axes of SDE represent the main and sub-trend distribution directions of the features. The orientation
represents the rotation of the long axis measured clockwise from noon, which also represents the main
direction of the feature spread [49]. The formula is as follows:
v
n n
u u
t n n
2 n 2
X n
X X X X X
2 2
2− 2
tanθ = x − y + x y + 4 x y xi e
yi
/2 (2)
ei
ei e i
e i ei i
e
e
i=1
i=1 i=1 i=1 i=1 i=1
s s
Pn 2 Pn 2
i=1 (e yi sinθ)
xi cosθ − e i=1 (e yi cosθ)
xi sinθ − e
σx = , σy = (3)
n nSustainability 2020, 12, 663 6 of 17
where θ is the elliptic deflection angle, e
xi and e
yi are the deviation values of the element i coordinates x,
y and the mean center of the element arithmetic, respectively; σx and σy represent the length of the
ellipse X and Y axes, respectively; and n is the total number of features. This method is implemented
by ArcGIS 10.2 software.
3.3.3. Hot Spot Analysis
Getis and Ord (1981) proposed the local statistics Getis-Ord Gi* [50], which is implemented by
ArcGIS 10.2 software. The hot spot analysis calculates the Getis-Ord Gi* for each feature in a dataset.
The resultant Z-score and p-value tell where features with either high or low values spatially cluster.
The hot spot analysis is applied to investigate the changing spatial pattern of DCFG demand at the
provincial level. The Getis-Ord local statistic Gi* is given as
Pn Pn
j=1 wi,j x j − X j=1 wi,j
G∗i = r P 2
(4)
n nj=1 w2i,j − nj=1 wi,j
P
S n−1
sP
Pn n 2
j=1 x j j=1 x j 2
X= , S= − X (5)
n n
where x j is the attribute value of element j; wi,j is the spatial weight between elements i and j; and n is
the total number of elements. The higher a positive Z-score of significance, the closer the clustering of
high values (hot spots) will be; the lower a negative Z-score of significance, the closer the clustering of
low values (cold spots). Based on Jenks natural breaks classification, the provincial DCFG demand was
divided into five categories: hot spots, sub-hot spots, intermediate spots, sub-cold spots, and cold spots.
3.3.4. The Geo-Detector Method
Spatial differentiation is essentially co-affected by the various natural and socioeconomic factors.
The Geo-Detector method is based on the assumption that if a factor plays an important role in the
DCFG demand, the spatial distribution of the demand and the factor should present similar patterns.
Geo-Detector was initially proposed by Wang et al. (2010) to detect disease risks and their influencing
factors [51,52]. It has been widely applied in social, economic, and natural science studies [53,54].
Based on the variance analysis, Geo-Detector uses the power of determinant to measure the impact of
a factor, which is as follows.
m
1 X
qD,F = 1 − 2 nD,i σ2D,i (6)
nσF i=1
where qD,F is the power of determinant of factor D; m is the number of sub-regions; n is the number of
spatial units in the whole region; nD,i is the number of spatial units in the sub-region; σ2F is the variance
of dependent variables in the whole region; σ2D,i is the variance of dependent variables in the sub-region.
Assuming σ2D,i , 0, the model is established, and the value range of qD,F is [0,1]. When qD,F = 0, factor
D is unrelated to the dependent variable at all. When qD,F = 1, the dependent variable is completely
determined by factor D. The higher the value of qD,F , the higher the “power of determinant” of factor
D on the dependent variable. This method is implemented by GeoDetector software.
4. Spatio-Temporal Dynamics of DCFG Demand in China
Feed grain conversion ratio is an important parameter to calculate the DCFG demand. The national
average fluctuated dramatically in the 1990s but decreased gradually since 2000, which reflected the
improved feed efficiency (Table 1). The mean value at the provincial level was generally lower in the
northern China and higher in the southern China, indicating that feed efficiencies were noticeably
higher in northern China than southern China. (Table 2).Sustainability 2019, 11, x FOR PEER REVIEW 7 of 17
lower in the northern China and higher in the southern China, indicating that feed efficiencies were
noticeably higher in northern China than southern China. (Table 2).
Sustainability 2020, 12, 663 7 of 17
4.1. Temporal Dynamics of DCFG Demand at the National Level
4.1. Temporal Dynamics
China’s DCFG of DCFG
demand Demand
showed at the National
significant growthLevel
from 1990 to 2016. On the other hand, DCFG
demand, as a proportion in the total consumption
China’s DCFG demand showed significant growth from of forage corn1990
and soybean
to 2016. meal,
On theandother
in thehand,
total
yield of corn and soybean, has declined since 2007 after a rapid growth in the early and
DCFG demand, as a proportion in the total consumption of forage corn and soybean meal, and in the mid-2000s
(Figure
total 1).of corn and soybean, has declined since 2007 after a rapid growth in the early and mid-2000s
yield
(Figure 1).
Figure 1. National dairy cow feed grain (DCFG) demand and as a proportion of the total consumption
of forage corn and soybean meal, and in the total yield of corn and soybean.
Figure 1. National dairy cow feed grain (DCFG) demand and as a proportion of the total consumption
of forage
As shown corn and soybean
in Figure 1, themeal, and indynamics
temporal the total yield of corndemand
of DCFG and soybean.
can be divided into three stages
of slow growth, rapid growth, and high-level stability (slow growth from 1990 to 2000, rapid growth
from As
2001shown
to 2006,in Figure 1, the temporal
and high-level stabilitydynamics
from 2007oftoDCFG 2016).demand can beDCFG
The absolute divided into three
demand stages
fluctuated
of slow growth,
slightly in the third rapid growth,
stage, withand high-level
an average stability
demand of(slow
aboutgrowth from
27,839.20 1990
× 10 to 2000,
3 ton. rapid growth
The proportion of
DCFG demand in the total consumption of forage corn and soybean meal, and in the totalfluctuated
from 2001 to 2006, and high-level stability from 2007 to 2016). The absolute DCFG demand corn and
slightly in
soybean the third
yields, stage,declined
generally with aninaverage
the third demand of about
stage, with 27,839.20
the former × 103 ton.
dropping fromThe proportion
21.46% in 2007 toof
DCFG demand
12.83% in 2016 with in the total decline
a sharp consumption
from 2015of forage
to 2016,corn
andandthe soybean meal, and
latter decreasing in the total
relatively cornfrom
steadily and
soybean yields, generally declined in the third stage, with the former dropping
16.21% in 2007 to 11.89% in 2016. The Chinese Milk Scandal in 2008 significantly reduced the export of from 21.46% in 2007
to 12.83%
dairy in 2016
products and with a sharpthe
increased decline
import from 2015 to
of dairy 2016, and
products, the latter
which had adecreasing relatively
negative impact on steadily
China’s
from 16.21%
dairy cow feeding in 2007 to According
[55]. 11.89% in 2016.
to theThe Chinese
statistics, Milk Scandal
China’s dairy milk in yields
2008 significantly reducedfrom
have also changed the
export of dairy products and increased the import of dairy products, which
rapid growth to reach a stable level since 2007 [12]. In short, these indicate that the DCFG demand had a negative impact on
China’s
tends to dairy
develop cow feedingin[55].
steadily China,According to the statistics,
and its relative level in the China’s
wholedairy
animalmilk yields have
husbandry tendsalso
to
changed from rapid growth to reach a stable level since 2007 [12]. In
decline. This is helpful for China’s dairy cow husbandry to turn to “grain-saving” development. short, these indicate that the
DCFG demand tends to develop steadily in China, and its relative level in the whole animal
husbandry
4.2. tends to Changes
Spatio-Temporal decline. in This is helpful
DCFG at the for China’s
Regional dairy cow husbandry to turn to “grain-saving”
Level
development.
This study also analyzes the spatio-temporal dynamics of DCFG demand at the regional level.
We divide the 31 provincial
4.2. Spatio-Temporal Changes units into seven
in DCFG at theregions:
RegionalNortheast
Level China (Heilongjiang, Jilin, and Liaoning),
North China (Beijing, Tianjin, Shanxi, Hebei, and Inner Mongolia), Central China (Henan, Hubei
This and
Province, study also analyzes
Hunan), East Chinathe (Shanghai,
spatio-temporalJiangsu,dynamics
Zhejiang,ofAnhui,
DCFGJiangxi,
demand at the regional
Shandong, level.
and Fujian),
We divide
South Chinathe 31 provincial
(Guangdong, units into
Guangxi, andseven regions:
Hainan), Northeast
Southwest ChinaChina (Heilongjiang,
(Sichuan, Guizhou,Jilin, and
Yunnan,
Liaoning), North China (Beijing, Tianjin, Shanxi, Hebei, and Inner Mongolia),
Chongqing, and Tibet), and Northwest China (Shaanxi, Gansu, Qinghai, Ningxia, and Xinjiang). Central China (Henan,
Hubei Province,
From 1990 toand 2016, Hunan),
the DCFG Eastdemand
China (Shanghai,
in the seven Jiangsu,
regionsZhejiang,
all showed Anhui, Jiangxi,
a growing Shandong,
trend with an
and Fujian),growth
accelerated South China (Guangdong,
rate after 2000. TheGuangxi, and Hainan),
highest growth rate was Southwest
in NorthChina
China(Sichuan, Guizhou,
and the lowest in
Yunnan, Chongqing, and Tibet), and Northwest China (Shaanxi, Gansu,
South China (Figure 2). The DCFG demand in North China was the largest and the fastest growing, Qinghai, Ningxia, and
Xinjiang).
from 767.34 × 10³ tons in 1990 to 10736.16 × 103 tons in 2016, accounting for 35% of the national total.
This From 1990 toresulted
was mainly 2016, thefrom
DCFG thedemand in theofseven
universality dairyregions all showed
cow feeding a growing
in Inner Mongolia trend
andwith an
Hebei.
accelerated growth rate after 2000. The highest growth rate was in
North China is the dominant region impelling the overall change of DCFG demand across China. North China and the lowest in
The second-highest demand and growth is in Northeast China, which increased from 1048.83 × 103
tons in 1990 to 5174.20 × 103 tons in 2016. However, the difference between North China and NortheastSouth China (Figure 2). The DCFG demand in North China was the largest and the fastest growing,
from 767.34 × 10³ tons in 1990 to 10736.16 × 103 tons in 2016, accounting for 35% of the national total.
This was mainly resulted from the universality of dairy cow feeding in Inner Mongolia and Hebei.
North China
Sustainability 2020,is12,
the
663dominant region impelling the overall change of DCFG demand across China. 8 of 17
The second-highest demand and growth is in Northeast China, which increased from 1048.83 × 103
tons in 1990 to 5174.20 × 103 tons in 2016. However, the difference between North China and
China became
Northeast China gradually greater since
became gradually 2003.since
greater In addition, North China
2003. In addition, Northand Northeast
China China are
and Northeast also
China
the major grain production bases of corn and soybean [56], which implies that
are also the major grain production bases of corn and soybean [56], which implies that dairy cow dairy cow feeding in
China
feeding still
inrelies
Chinaonstill rawrelies
grain.onCompared
raw grain. with other regions,
Compared Southregions,
with other China presents the smallest
South China DCFG
presents the
demand and the slowest growth rate, from 53.34 × 10 3 tons in 1990 to 162.51 × 10³ tons in 2016, which
smallest DCFG demand and the slowest growth rate, from 53.34 × 10 tons in 1990 to 162.51 × 10³ tons
3
may be related
in 2016, which may to thebesmall sizetoofthe
related dairy cow
small feeding
size andcow
of dairy thefeeding
poor natural endowment
and the of feed
poor natural grain in
endowment
this region
of feed [56,57].
grain in this In region
short, these show
[56,57]. that the
In short, regional
these showcharacteristics of China’s
that the regional DCFG demand
characteristics are
of China’s
significant, and the high demand is in North China.
DCFG demand are significant, and the high demand is in North China.
Figure 2. Temporal changes of DCFG demand in seven regions, 1990 to 2016.
Figure 2. Temporal changes of DCFG demand in seven regions, 1990 to 2016.
4.3. Changing Spatial Distribution of DCFG Demand
4.3. Changing
Based onSpatial Distribution
the data of DCFG
of 31 provincial Demand
units in the six years of 1990, 1995, 2000, 2005, 2010, and 2016,
multiple
Basedstandard
on the deviation
data of 31ellipses (SDEs)
provincial areincreated
units the sixto analyze
years how1995,
of 1990, the spatial
2000, distribution of DCFG
2005, 2010, and 2016,
demand has evolved.
multiple standard deviation ellipses (SDEs) are created to analyze how the spatial distribution of
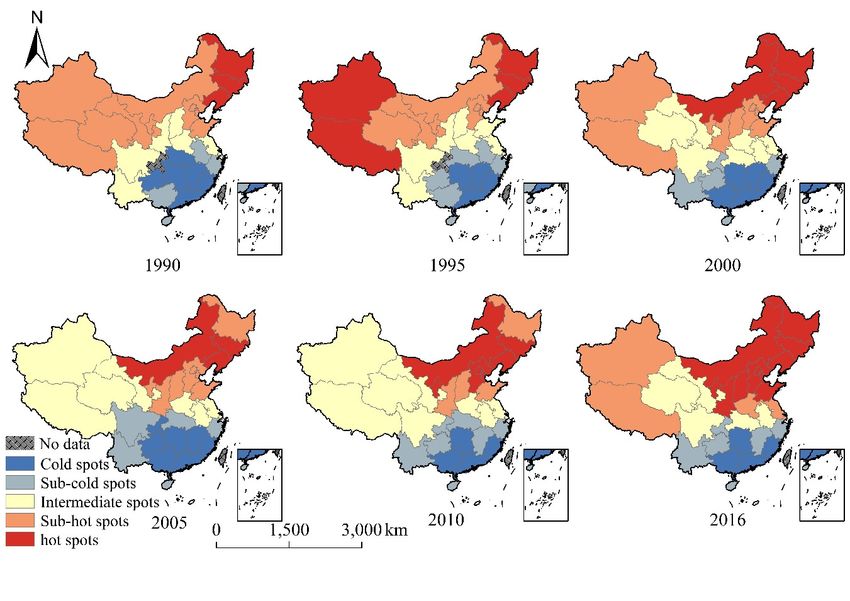
DCFG The SDEs ofhas
demand DCFG demand in 1990–2016 are mainly distributed within a large area north of the
evolved.
Yangtze River and east
The SDEs of DCFG demandof the Qinghai-Tibet
in 1990–2016 Plateau (Figure
are mainly 3). The majority
distributed within aoflarge
this distribution
area north ofisthe
in
northern China. It covers North China and Northeast China, and parts of Northwest China,
Yangtze River and east of the Qinghai-Tibet Plateau (Figure 3). The majority of this distribution is in Southwest
China, Central
northern China.China, and East
It covers China.
North This isand
China consistent withChina,
Northeast the spatial
anddistribution of major corn
parts of Northwest and
China,
soybean production bases and pastoral land in China. The elliptical area expanded
Southwest China, Central China, and East China. This is consistent with the spatial distribution of in the 1990–1995
period, shrank
major corn andduring
soybeantheproduction
1995–2010 bases
period,
andand rebounded
pastoral landslightly
in China.in The
the 2010–2016 period
elliptical area (Figurein
expanded 3
and Table 3). The overall trend was the contraction of the spatial distribution, indicating
the 1990–1995 period, shrank during the 1995–2010 period, and rebounded slightly in the 2010–2016 the intensified
agglomeration
period (Figure of high Table
3 and DCFG3). demand in northern
The overall China.
trend was theTo a certain extent,
contraction of the this alsodistribution,
spatial reflects the
gradual
indicatingconcentration
the intensifiedof dairy cow feeding
agglomeration of areas, which demand
high DCFG is conducive to the formation
in northern China. ToofaChina’s
certain
superiority areas of dairy cow feeding, but this will also easily increase the regional supply
extent, this also reflects the gradual concentration of dairy cow feeding areas, which is conducive to pressure
on
thefeed grain. of China’s superiority areas of dairy cow feeding, but this will also easily increase the
formation
regional supply pressure on feed grain.
Table 3. Parameters of Standard Deviation Ellipse for DCFG demand in China, 1990–2016.
Figure 3 shows the major axis of the SDEs is mostly along the northeast-southwest direction. The
rotation of theMajor
SDEsAxis
varies from
Minor 54.92°
Axis to 71.21°
Rotation in the six years. The ratio
Barycentric between the
Migration major axis
Elliptical Areaand
Years ◦ 3 2)
the minor axis is(km)
1.62, 1.69, 1.59, 1.40, 1.45, (and
(km) ) 1.49, respectively Distance
Coordinates (the closer
(km)the ratio(10
is to
kmone, the
weaker the directionality of the SDE [49]). The generally decreasing
◦
113.13 E, ratio between the two axes also
1990 1022.77 1656.83 64.76 ◦N — 532.32
indicates that the distribution of high DCFG demand 39.93 tended to shrink and its concentration has been
◦
intensified.
1995 The1012.18
high demand 1706.67
area of DCFG71.21in China111.71
has the
◦
E,characteristics of spatial agglomeration.
123.62 542.65
40.14 N
112.90◦ E,
2000 925.13 1467.40 70.82 126.78 426.45
39.46◦ N
114.06◦ E,
2005 817.11 1140.50 60.53 160.32 292.75
40.59◦ N
114.15◦ E,
2010 779.52 1131.39 54.92 43.46 277.05
40.20◦ N
114.07◦ E,
2016 803.12 1200.26 56.43 40.34 302.81
39.84◦ NSustainability 2020, 12, 663 9 of 17
Sustainability 2019, 11, x FOR PEER REVIEW 9 of 17
Figure3.3.Standard
Figure Standarddeviation
deviationellipses
ellipsesofofDCFG
DCFGdemand
demandininChina,
China,1990–2016.
1990–2016.
Figure 3 shows
As shown the major
in Figure 3, theaxis of the
center SDEs has
of SDEs is mostly alongmigration
a complex the northeast-southwest
pattern from 1990 direction.
to 2016.
The ◦ ◦
Therotation
center ofis the SDEs found
usually varies from
around54.92the toborder
71.21 between
in the six Shanxi,
years. The ratioand
Hebei, between
Innerthe major axisIn
Mongolia.
and the minor
addition, axis is 1.62,
the migration 1.69, 1.59,
pattern of the1.40,
center1.45,
canandbe 1.49,
dividedrespectively
into three(the closer
stages: the ratio is
a westward to one,
migration
the weaker the directionality of the SDE [49]). The generally decreasing
from 1990 to 1995, an eastward migration in the 1995–2005 period, and a slightly southwardratio between the two axes also
indicates
migrationthat the 2005
from distribution
to 2016.ofTable
high 3DCFG
showsdemand
that thetended to shrink
migration and between
distance its concentration
differenthas been
locations
intensified. The high demand area of DCFG in China has the characteristics
of the center increased from 1990 to 2005 and decreased since 2005. The longest migration distanceof spatial agglomeration.
As shown
occurred alonginthe Figure 3, the center
east direction. From of1990
SDEstohas 2016,a complex
the overall migration pattern
trend of the centerfrom
had1990
moved to 2016.
to the
The center
east, is usually
but the migrationfound aroundfrom
distance the border between
the center Shanxi, Hebei,
was relatively small,and Inner
with Mongolia.
spatial In indicating
stability, addition,
the migration
that northernpattern of the centerthe
China maintained cancore
be divided
locationinto three
of high stages: for
demand a westward
DCFG. migration from 1990
to 1995, an eastward migration in the 1995–2005 period, and a slightly southward migration from 2005
to 2016. Table
Table 3 shows that the
3. Parameters ofmigration distanceEllipse
Standard Deviation between for different
DCFG demandlocations of the1990–2016.
in China, center increased
from 1990 to 2005 and decreased since 2005. The longest migration distance occurred along the east
Migration Elliptical
Major1990
direction. From Axisto 2016,
Minor
theAxis
overall trend of the center Barycentric
had moved to the east, but the migration
Years Rotation (°) Distance Area
distance from(km) the center was(km) relatively small, with spatial Coordinates
stability, indicating that northern
(km) (103China
km2)
maintained
1990 the core
1022.77 location of high
1656.83 demand for
64.76 DCFG. 113.13° E, 39.93° N — 532.32
1995 1012.18 1706.67 71.21 111.71° E, 40.14° N
123.62 542.65
4.4. Spatio-Temporal
2000 925.13 Dynamics1467.40
of DCFG Demand at the Provincial
70.82 112.90° E,Level
39.46° N 126.78 426.45
2005
Hot spots analyses in different years have revealed the dynamic concentration pattern292.75
817.11 1140.50 60.53 114.06° E, 40.59° N 160.32 of high
2010 779.52 1131.39 54.92 114.15° E, 40.20° N
values (hot spots) and low values (cold spots) of provincial DCFG demand.43.46 277.05
In 1990, the hot spots
2016 803.12 1200.26 56.43 114.07° E, 39.84° N 40.34 302.81
were concentrated in Northeast China (Heilongjiang, Jilin, and Liaoning). In 1995, Xinjiang and
Tibet in Northwest China were also hot spots in addition to the original three northeastern provinces.
4.4. Spatio-Temporal Dynamics of DCFG Demand at the Provincial Level
In 2000 and 2005, hot spots were mostly concentrated in Northeast China and Inner Mongolia however
Hot spots
Heilongjiang analyses
was absent in
in different
2005. Inyears
2010,have revealed
hot spots the dynamic
expanded concentration
southward patternBeijing,
and included of high
values and
Tianjin, (hot Hebei.
spots) and low values
In 2016, (cold spots)
the expansion of provincial
of hotspots DCFG
was more demand.
obvious, In expansion
with 1990, the hot spots
in both
were concentrated in Northeast China (Heilongjiang, Jilin, and Liaoning). In 1995, Xinjiang
north and south directions. Eventually, a cluster of hot spots consisting of 11 provinces formed and Tibet
in
in Northwest
northern China.China were to
According also
thehot spots in addition
spatio-temporal to theoforiginal
dynamics three
hot spots northeastern
from 1990 to 2016,provinces.
the spatialIn
2000 and 2005,
distribution withhot spots
high DCFGwere mostlyinconcentrated
demand China tendedintoNortheast
graduallyChina
become and Inner
more Mongolia
stable however
with increases
inHeilongjiang was absent in 2005. In 2010, hot spots expanded southward and included Beijing,
its concentration.
Tianjin, and Hebei. In 2016, the expansion of hotspots was more obvious, with expansion in both
north and south directions. Eventually, a cluster of hot spots consisting of 11 provinces formed inSustainability 2019, 11, x FOR PEER REVIEW 10 of 17
northern China. According to the spatio-temporal dynamics of hot spots from 1990 to 2016, the spatial
Sustainability 2020, 12, 663 10 of 17
distribution with high DCFG demand in China tended to gradually become more stable with
increases in its concentration.
From1990
From 1990toto2016,
2016,cold
coldspots
spotsofofprovincial
provincialDCFG
DCFGdemand
demand have have been
been shrinking
shrinking southward.
southward.
Figure4 4shows
Figure shows thatthat Hunan
Hunan was was always
always thespot.
the cold coldInspot.
1990,Inthe1990,
cold the
spotscold spots of
consisted consisted of six
six provinces,
provinces, including Jiangxi, Hubei, Hunan, Fujian, and Guangdong and Guizhou.
including Jiangxi, Hubei, Hunan, Fujian, and Guangdong and Guizhou. In 1995, Hubei and Guizhou In 1995, Hubei
and no
were Guizhou
longer were no longer
hot spots hot spots (four
(four provinces provinces
retained). retained).
In 2005, however, InGuangxi
2005, however,
became Guangxi
a new coldbecame
spot
a new
(five cold spot
provinces (five provinces
in total). in total).and
In 2005, Guizhou In 2005, Guizhou
Chongqing and Chongqing
became cold spots (abecame
total of cold
sevenspots (a total
provinces).
of2010
In seven provinces).
and 2016, coldInspots
2010 were
and 2016, cold four
the same spotsprovinces
were the including
same fourHunan,
provinces including
Fujian, Hunan,
Guangdong,
Fujian,
and Guangdong,
Guangxi. From 1990and Guangxi. From
to 2016, the 1990 to 2016, the
spatio-temporal spatio-temporal
dynamics dynamics
of the cold of the cold
spots indicates thatspots
the
indicates that the low demand areas for DCFG in China also tends to be stable in spatial
low demand areas for DCFG in China also tends to be stable in spatial distribution, and localizes to distribution,
andsouth.
the localizes to the south.
Figure 4. Hotspot analysis of DCFG demand at the provincial level in China. (“Sub-cold” spots and
“sub-hot” spots are not statistically significant. They are usually not included in the analysis.).
Figure 4. Hotspot analysis of DCFG demand at the provincial level in China. (“Sub-cold” spots and
At the provincial
“sub-hot” spots arelevel, the north-south
not statistically spatial
significant. They differences in included
are usually not provincial DCFG
in the demand were
analysis.).
significant. The concentrations of high and low values formed a “Hot North and Cold South” pattern.
At thepattern
The spatial provincial level,
of high the north-south
demand spatialfordifferences
and low demand in provincial
DCFG in China DCFG demand
has fundamentally were
stabilized.
significant. The concentrations of high and low values formed a “Hot North and Cold South” pattern.
5.The
Results from
spatial the Geo-Detector
pattern Analysis
of high demand and low demand for DCFG in China has fundamentally
stabilized.
The Geo-Detector method aims to identify the degree of impact by the different factors on the
spatial distribution pattern of DCFG demand. Based on previous studies [7,8,25,42] and the available
5. Results from the Geo-Detector Analysis
data, this study focused on four main elements: resource endowment, feeding scale, feeding technology,
and market environment.method
The Geo-Detector A total aims
of nine
to individual
identify thefactors
degree were taken into
of impact consideration,
by the whichon
different factors were
the
corn yield
spatial (X1), soybean
distribution patternyield (X2), demand.
of DCFG pastoral area
Based(X3), year-endstudies
on previous number of dairyand
[7,8,25,42] cows
the(X4), the
available
proportion
data, this of large-scale
study focused farms with more
on four main than 100 dairy
elements: cows endowment,
resource (X5), the proportion
feedingofscale,
mechanized
feeding
milking in large-scale
technology, and marketdairy farms (X6), A
environment. thetotal
average dairy
of nine milk yield
individual per cow
factors were(X7),
taken the average
into price of
consideration,
raw milk
which (X8),corn
were andyield
per capita milk consumption
(X1), soybean yield (X2), of urban residents
pastoral area (X3),(X9). The Geo-Detector
year-end method
number of dairy cows
was
(X4),applied to exploreofthe
the proportion large-scale in q-value
variationfarms with (power
more thanof determinant)
100 dairy cows of different
(X5), thefactors on theof
proportion
spatio-temporal
mechanized milking dynamics of DCFGdairy
in large-scale demand farms(Table
(X6),4).
theThe nine factors
average wereyield
dairy milk discretized
per cowinto four
(X7), the
levels using the quantile method. All variables had a significance value of 0.00 and passed the testSustainability 2020, 12, 663 11 of 17
with a significance level of 0.05. In Figure 5, color depth is used to indicate the degree of influence;
that is, the darker the color, the greater the influence.
Table 4. Geo-Detector analysis of DCFG demand in China, 1990–2016.
Main Elements Variables 1990 1995 2000 2005 2010 2016
X1 0.15 0.18 0.30 0.41 0.50 0.61
Resource
X2 0.14 0.12 0.09 0.22 0.24 0.25
endowment
X3 - - - 0.10 0.08 0.08
X4 - - 0.59 0.48 0.59 0.68
Feeding scale
X5 - - - - 0.16 0.19
Feeding X6 - - - 0.10 0.15 -
technology X7 - - - - 0.07 0.23
Sustainability 2019, 11, x FOR PEER REVIEW
Market X8 - - 0.29 0.12 0.20 - 12 of 17
environment X9 - - - - 0.13 0.23
Figure5.5.Process
Figure Processmechanism
mechanismofofspatial
spatialdifferentiation
differentiationofofChinese
ChineseDCFG
DCFGdemand.
demand.
5.1. Resource Endowment
5.3. Feeding Technology
DCFG is mainly composed of energy feeds (e.g., corn) and protein feeds (e.g., soybean); it has been
The proportion of mechanized milking in large-scale dairy farms (X6) and the average daily milk
estimated that forage corn accounted for 59.8% of the feed grain [4]. Although soybean accounts for a
yield per cow (X7) are selected to represent the feeding technology. In Table 4, the PD value for
smaller proportion in feed grains, it is an important source of protein [58,59]. Forages and roughage
variable X6 was statistically significant only in 2005 and 2010 and had a relatively small value. The
are also important feed ingredients and they affect the quality of milk [60]. The power of determinant
PD value for variable X7 increased from 2010 to 2016 and indicated a stronger influence on the DCFG
(PD) value for the variable X1 shows an increasing trend, indicating a significant effect of corn yield
demand (Figure 5). On the whole, the influence of feeding technology on spatial dynamics of DCFG
in the DCFG demand (Figure 5). Soybean yield (X2) has a smaller PD value than corn yield (X1).
demand is weaker than resource endowment and feeding scale (Figure 5). As we all know, the
Pastoral area (X3), an indicator of availability of forages, has the smallest PD value for this element.
improvement of feeding technology can better secure the supply of milk and reduce the pressure on
The major corn production bases are located in the three provinces in Northeast China and the east
feed grain [56]. According to the FAO, the annual milk yield per cow in mainland China increased
Inner Mongolia in North China [56], which are ultimately consistent with the high value areas of
from 1544.80kg/cow in 1990 to 2421.00kg/cow in 2016. However, compared to the yield in the United
DCFG demand. China’s major soybean production bases overlap with corn production bases [56],
States (10,348.20 kg/cow, 2016), the United Kingdom (7712.80 kg/cow, 2016), and Australia (5763.20
but the domestic soybean yields are rather limited [40]. Forage soybean and soybean meal used in
kg/cow, 2016) [63], a significant disparity can be identified. The higher dairy milk yield in developed
dairy cow feeding depend significantly on imports [23,40]. Therefore, soybean yield (X2) does not
countries has been mostly achieved through higher dairy milk yield efficiency per cow rather than
have as large of an impact on the spatio-temporal dynamics of DCFG demand as corn yield (X1) does.
the absolute numbers of dairy cows [64]. Higher milk yield per cow is the key to reducing the cost of
Dairy farmers in China tend to rely on concentrate feed to increase dairy milk yield, which consumes a
dairy cow feeding in developed countries [64]. China should change the traditional growth model
large amount of feed grain but does not utilize forage sufficiently [61]. The PD value of pastoral land
that relies on the increasing number of dairy cows, increase the dairy milk yield efficiency per cow,
and improve the feeding technology.
5.4. Market Environment
The market environment is reflected through the average price of raw milk (X8) and per capitaSustainability 2020, 12, 663 12 of 17
(X3) also confirms the insufficient usage of forage as a significant feed. At present, dairy cow feeding
in China needs to change the current feeding mode of “straw plus concentrate feed” and reduce the
reliance on feed grains and utilize forage more efficiently [60].
5.2. Feeding Scale
The year-end number of dairy cows (X4) has the most direct influence on the DCFG demand
(Figure 5). PD value for X4 had the largest value among all factors since 2000 (Table 4). The proportion
of farms with more than 100 dairy cows (X5) reflects the feeding scale of dairy cows. The PD value
for X5 indicates that this variable does not have a strong impact on the spatio-temporal dynamics of
DCFG demand (Table 4, Figure 5). According to the statistics, the number of dairy cows in China
increased from 2.69 million in 1990 to 10.37 million in 2016, one of the largest in the world [14].
In December 2018, the Ministry of Agriculture and Rural Affairs of China, the National Development
and Reform Commission, and another nine ministries jointly issued Several Opinions on Revitalizing
the Dairy Industry and emphasized the importance of large-scale dairy cow feeding [62]. Based on
these opinions, China should stabilize the increasing number of dairy cows, reduce the proportion
of free-range and small-scale dairy cow feeding, give full play to economies of scale, and reduce the
pressure on feed grains from the increasing number of dairy cows.
5.3. Feeding Technology
The proportion of mechanized milking in large-scale dairy farms (X6) and the average daily milk
yield per cow (X7) are selected to represent the feeding technology. In Table 4, the PD value for variable
X6 was statistically significant only in 2005 and 2010 and had a relatively small value. The PD value
for variable X7 increased from 2010 to 2016 and indicated a stronger influence on the DCFG demand
(Figure 5). On the whole, the influence of feeding technology on spatial dynamics of DCFG demand is
weaker than resource endowment and feeding scale (Figure 5). As we all know, the improvement of
feeding technology can better secure the supply of milk and reduce the pressure on feed grain [56].
According to the FAO, the annual milk yield per cow in mainland China increased from 1544.80kg/cow
in 1990 to 2421.00kg/cow in 2016. However, compared to the yield in the United States (10,348.20
kg/cow, 2016), the United Kingdom (7712.80 kg/cow, 2016), and Australia (5763.20 kg/cow, 2016) [63],
a significant disparity can be identified. The higher dairy milk yield in developed countries has been
mostly achieved through higher dairy milk yield efficiency per cow rather than the absolute numbers
of dairy cows [64]. Higher milk yield per cow is the key to reducing the cost of dairy cow feeding
in developed countries [64]. China should change the traditional growth model that relies on the
increasing number of dairy cows, increase the dairy milk yield efficiency per cow, and improve the
feeding technology.
5.4. Market Environment
The market environment is reflected through the average price of raw milk (X8) and per capita
milk consumption of urban residents (X9). During the 2000–2010 period, the price of raw milk in
China was lower in the north and higher in the south [65], which represented a spatial mismatch
with the DCFG demand. At the same time, the domestic raw milk price was much higher than the
international price which already has had a greater impact on the domestic dairy cow husbandry [15].
In 2016, the price of raw milk was $57.98/100 kg in China while it was only $26.02/100 kg, $25.44/100
kg, and $31.46/100 kg, respectively in New Zealand, Argentina, and the European Union [15]. Table 4
shows that the PD value for variable X8 has declined in recent years. With increasing income levels,
urban residents substantially increased their milk consumption (Figure 5). The PD value for variable
X9 has increased since 2010. The per capita milk consumption of rural residents has been increasing at a
lower rate, but there is a great potential for it to grow. Overall, the impact of the market environment on
the spatial dynamics of DCFG demand in China is comparable to that of any changes or development
in feeding technology (Figure 5). To meet the nutritional needs, an adult needs to drink 300 g of liquidSustainability 2020, 12, 663 13 of 17
milk every day, according to the Chinese Nutritional Society [66]. However, annual per capita milk
consumption of the Chinese population was only 12.1 kg (about 33 g per capita per day) in 2017 [12],
far below suggested nutritional requirement. There is a great potential for the milk consumption to
increase in China. Figure 5 shows that the market environment has a direct impact on the year-end
number of dairy cows, which relates directly to the demand for feed grain.
6. Conclusions and Discussion
6.1. Conclusions
Based on the calculation of feed grain conversion ratio of dairy cows in the 31 provincial units,
this study uses traditional statistics, spatial statistics, and the Geo-Detector method to explore the
spatio-temporal dynamics of DCFG demand and its underlying influencing factors in China from 1990
to 2016. The following conclusions can be drawn from the results.
(1) At the national level, the scale and spatial pattern of DCFG demand in China have gradually
stabilized. However, the relative scale of DCFG demand in animal husbandry generally declined
overall. In the third stage (2007–2016), the demand scale of DCFG retained high-level stability, while its
proportion in the total consumption of forage corn and soybean meal, and in the total corn and soybean
yields, generally declined. Northern China was the most important area to DCFG demand where
it remained high and concentrated. At the same time, the location for the DCFG central area was
relatively stable, and the concentration is becoming more localized.
(2) At the regional and provincial levels, the scale of DCFG demand and its growth rate in China
are characterized by regional polarization. Specifically, the high and low demand provinces of DCFG
have the sharp characteristic contrast from north to south regions. North China is the region with the
largest demand for DCFG and is increasing at the highest rate compared to other regions. South China
has the smallest DCFG demand and the slowest growth rate.
(3) The spatio-temporal dynamics of DCFG demand in China are impacted by various factors in
resource endowment, feeding scale, feeding technology, and market environment, but the way and
degree of impact of each element are different. Among them, resource endowment and feeding scale
have the most significant impact on the spatio-temporal dynamics of DCFG demand. The necessary
measures to develop the grain-saving dairy husbandry in China are to improve the use of pastoral
land, to endorse a balanced ration of concentrate feed and roughage feed, to improve in the feeding
technology, to expand large-scale feeding, and to create a healthy and orderly market environment.
6.2. Discussion
This paper calculated the feed grain conversion ratio of dairy cows in the 31 provinces in China
from 1990 to 2016, which can provide useful references for future research. In this study, the calculated
DCFG demands are higher than those of previous research. This is because most existing research did
not take into account the proportion of lactating cows in the total, which is about 48%. The main data
of this study were sourced from official statistics. Some Chinese statistics are known to be unreliable,
while the research on milk yield is considered accurate [7]. In many cases, unreliable data may be used
due to the lack of better information sources. In this case, it is inevitable for different researchers to
analyze the same phenomenon at the same time or at different times [7].
In recent years, the number of dairy cows and dairy milk yield growth rates have decreased [12],
which were mainly impacted by the low-priced international raw milk. With the increasing consumption
potential of Chinese rural residents, the realization of a self-sufficiency ratio of 70% of raw milk [62],
and the mature global dairy market, new requirements may be put forth in order to keep up with
DCFG demand. It is undeniable that the DCFG demand is a comprehensive and complex problem,
and the DCFG demand may not increase significantly with the influence of feeding technology and
diet structure. Compared with developed countries, there is still much room for the feeding technologySustainability 2020, 12, 663 14 of 17
to improve. With a rapid internationalization of dairy cow husbandry in China, market environment is
bound to play an increasingly important role in the DCFG demand.
The feed grain conversion ratio varies under different feeding scales. If the milk yield data
of different dairy feeding scales can be obtained, combined with the feed grain conversion ratio of
corresponding scales, the accuracy of DCFG demand accounting would be further improved. The DCFG
demand is a comprehensive problem, and there are many factors that affect the spatio-temporal
dynamics of feed grain demand. Limited by the availability of data, this study only analyzed four
elements (resource endowment, breeding scale, breeding technology, and market environment). In the
future, research that includes the impact of national policies, company organization model, imports and
exports, and feed grain quality could provide greater insight into the field. In addition, the impact of
China’s existing dietary structure on global sustainable development needs further study. Soybean is
an important component of feed grain [58]. Soybean trade has a negative impact on the ecological
environment of both importing and exporting countries [67,68]. According to some studies, given the
current global soybean demand scale, China adopts the import method, which alleviates the negative
effect of global soybean production to some extent [67]. However, from the perspective of long-term
development of ecological environments, how to balance the benign development of soybean trade
and the ecological environment remains to be further studied.
Author Contributions: Conceptualization, C.X.L., C.Y.D. and B.B.M.; Methodology, C.Y.D. and B.B.M.; Formal
Analysis, C.Y.D.; Investigation, C.Y.D. and C.X.L.; Data Curation, C.Y.D.; Writing-Original Draft Preparation,
C.Y.D.; Writing-Review & Editing, C.X.L., B.B.M. and C.Y.D.; Visualization, C.Y.D.; Supervision, C.X.L. and B.B.M.;
Funding Acquisition, C.X.L. All authors have read and agreed to the published version of the manuscript.
Funding: This research was funded by Key Deployment Project of the Chinese Academy of Sciences
(No. KJZD-EW-G20-04) and National Key Research and Development Project of China (No. 2018YFD1100100).
Conflicts of Interest: The authors declare no conflict of interest.
References
1. Mergos, G.J. Feed use of grain: On trends and determinants. Eur. Rev. Agric. Econ. 1989, 16, 1–17. [CrossRef]
2. Spiertz, J.H.J.; Ewert, F. Crop production and resource use to meet the growing demand for food, feed and
fuel: Opportunities and constraints. NJAS Wagening. J. Life Sci. 2009, 56, 281–300. [CrossRef]
3. Godfray, H.C.J.; Beddington, J.R.; Crute, I.R.; Haddad, L.; Lawrence, D.; Muir, J.F.; Pretty, J.; Robinson, S.;
Thomas, S.M.; Toulmin, C. Food security: The challenge of feeding 9 billion people. Science 2010, 327, 812–818.
[CrossRef] [PubMed]
4. Xin, L.J.; Wang, L.X.; Liu, A.M. Regional production and consumption equilibrium of feed grain in China
and its policy implication. J. Nat. Resour. 2018, 33, 965–977. (In Chinese)
5. Wang, M.L. China’s livestock industry development: Achievements, experiences and future trends.
Issues Agric. Econ. 2018, 8, 60–70. (In Chinese)
6. Rae, A. China’s agriculture, smallholders and trade: Driven by the livestock revolution? Aust. J. Agric.
Resour. Econ. 2008, 52, 283–302. [CrossRef]
7. Zhou, Z.Y.; Tian, W.M.; Malcolm, B. Supply and demand estimates for feed grains in China. Agric. Econ.
2008, 39, 111–122. [CrossRef]
8. Tian, W.M.; Chudleigh, J. China’s feed grain market: Development and prospects. Agribus. Int. J.
1999, 15, 393–409. [CrossRef]
9. Hou, X.Y.; Zhang, Y.J. Analysis on driving factors of improvement of quality and efficiency and transformation
development of grasslands and animal husbandry industry. Chin. Sci. Bull. 2018, 63, 1632–1641. (In Chinese)
[CrossRef]
10. IDDCDA (Industry Development Department of China Dairy Association). 2017 China “School Milk
Programme” Promotion and Exchange Conference Held. Available online: http://www.dac.com.cn/read/
newxhdt1-17122507465539510742.jhtm (accessed on 25 April 2019).
11. Liu, C.G. China Dairy Yearbook; China Agriculture Press: Beijing, China, 2006. (In Chinese)You can also read