Spatiotemporal analysis of the dengue outbreak in Guangdong Province, China
←
→
Page content transcription
If your browser does not render page correctly, please read the page content below
Zhu et al. BMC Infectious Diseases  (2019) 19:493
https://doi.org/10.1186/s12879-019-4015-2

 RESEARCH ARTICLE                                                                                                                             Open Access

Spatiotemporal analysis of the dengue
outbreak in Guangdong Province, China
Guanghu Zhu1,2,3† , Jianpeng Xiao2† , Tao Liu2 , Bing Zhang2 , Yuantao Hao3 and Wenjun Ma2*

  Abstract
  Background: Dengue is becoming a major public health concern in Guangdong (GD) Province of China. The
  problem was highlighted in 2014 by an unprecedented explosive outbreak, where the number of cases was larger
  than the total cases in previous 30 years. The present study aimed to clarify the spatial and temporal patterns of this
  dengue outbreak.
  Methods: Based on the district/county-level epidemiological, demographic and geographic data, we first used
  Moran’s I statistics and Spatial scan method to uncover spatial autocorrelation and clustering of dengue incidence,
  and then estimated the spatial distributions of mosquito ovitrap index (MOI) by using inverse distance weighting. We
  finally employed a multivariate time series model to quantitatively decompose dengue cases into endemic,
  autoregressive and spatiotemporal components.
  Results: The results indicated that dengue incidence was highly spatial-autocorrelated with the inclination of
  clustering and nonuniformity. About 12 dengue clusters were discovered around Guangzhou and Foshan with
  significant differences by district/county, where the most likely cluster with the largest relative risk located in central
  Guangzhou in October. Three significant high-MOI areas were observed around Shaoguan, Qingyuan, Shanwei and
  Guangzhou. It was further found the districts in Guagnzhou and Foshan were prone to local autoregressive
  transmission, and most region in southern and central GD exhibited higher endemic components. Moreover, nearly
  all of districts/counties (especially the urban area) have cases that were infected in adjacent regions.
  Conclusions: The study can help to clarify the heterogeneity and the associations of dengue transmission in space
  and time, and thus provide useful information for public health authorities to plan dengue control strategies.
  Keywords: Dengue, Cluster, Spatiotemporal transmission

Background                                                                           trend both in extent and severity since its reemergence in
Dengue is a mosquito-borne viral infectious disease,                                 1978 in Guangdong (GD) Province, which has always been
which is transmitted from one person to another through                              the hardest-hit Chinese province [3]. Particularly in 2014,
the bite of the infected female Aedes aegypti and Aedes                              an explosive outbreak of dengue unexpectedly attacked
albopictus [1]. In recent decades, dengue incidence has                              GD, in which the reported cases were more than 3 times
grown dramatically around the world [1], leading to half                             of the total number in previous 20 years [4]. During this
the world’s population being at risk of infection and 390                            outbreak, it was observed that dengue is heterogeneously
million people being infected each year [2]. It is now                               distributed in time and space, and the incidence varied
regarded as a big international public health concern.                               greatly among districts and counties [4]. Characterizing
In China, dengue epidemics also exhibited clear upward                               the spatial-temporal heterogeneity of this dengue out-
                                                                                     break is very important, which allows to recognize the
*Correspondence: mawj@gdiph.org.cn                                                   dengue cluster and the risky area, and further to improve
† Guanghu Zhu and Jianpeng Xiao contributed equally to this work.
                                                                                     dengue control and prevention strategies.
2
  Guangdong Provincial Institution of Public Health, Guangdong Provincial              Many previous studies were conducted to discover and
Center for Disease Control and Prevention, No. 160, Qunxian Road, Panyu
District, Guangzhou, China                                                           predict the spatial and temporal patterns of dengue by
Full list of author information is available at the end of the article               using mapping techniques [5–8], dynamical models [9, 10]
                                         © The Author(s). 2019 Open Access This article is distributed under the terms of the Creative Commons Attribution 4.0
                                         International License (http://creativecommons.org/licenses/by/4.0/), which permits unrestricted use, distribution, and
                                         reproduction in any medium, provided you give appropriate credit to the original author(s) and the source, provide a link to the
                                         Creative Commons license, and indicate if changes were made. The Creative Commons Public Domain Dedication waiver
                                         (http://creativecommons.org/publicdomain/zero/1.0/) applies to the data made available in this article, unless otherwise stated.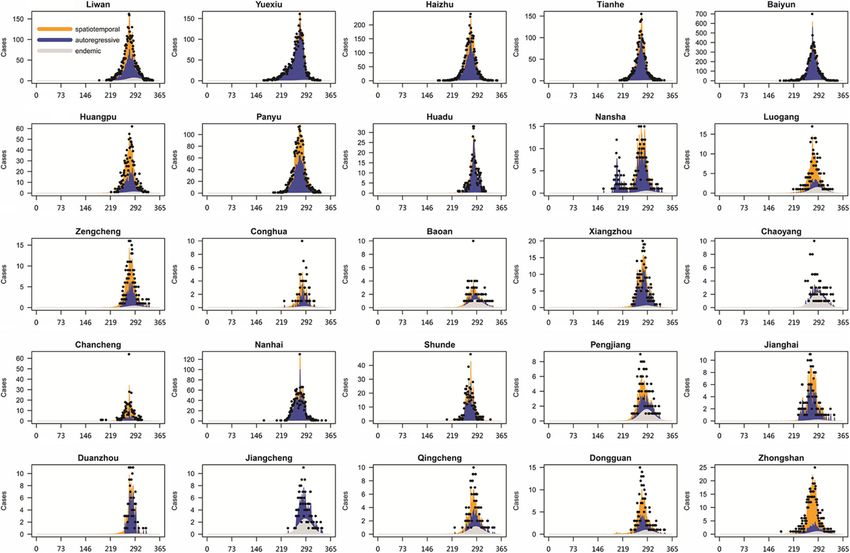
Zhu et al. BMC Infectious Diseases   (2019) 19:493                                                                     Page 2 of 11

or statistical methods [6, 7, 11, 12]. The recent dengue         was obtained from Guangdong Provincial Center for Dis-
outbreak in China also drew similar analysis, such as infer-     ease Control and Prevention (GDCDC), with regard to
ring the spatiotemporal patterns of dengue transmission          the number of reported apparent and confirmed dengue
[6, 7, 9–11], and identifying the determinants of spatial        cases per county/district. The MOI data is retrieved from
variations in the dengue epidemic [6, 11, 12]. However,          GDCDC. In GD, mosquito ovitraps are placed widely to
existing studies usually focused on one or several cities,       monitor mosquito density. MOI is computed as the pro-
and the spatiotemporal heterogeneity of the transmis-            portions of positive mosquito ovitraps. Population data
sion patterns remains little understood at a finer scale of      for each county/district in GD in 2014 were retrieved from
Guangdong.                                                       the Guangdong Statistical Yearbook.
  This study addressed this issue by examining the spa-
tiotemporal process at district/county level that con-           Data analysis
tributed to the 2014 dengue outbreak in GD Province.             Spatial autocorrelation analysis
We first used global Moran’ I to investigate the spatial         The spatial autocorrelation of the dengue numbers was
autocorrelation of dengue incidence around the 128 dis-          evaluated by using Global Moran’s I statistic, which can
tricts and counties, and then employed Anselin Local             measure the correlation among spatial observations, and
Moran’s I (local indicators of spatial association [LISA])       allows to find the global pattern (clustered, dispersed,
and Kulldorff ’s spatial scan statistics to detect the dengue    random) among regions. The formula is defined as [15]
clusters and identify the disease dynamics dispersion
in these regions. Finally, we decomposed dengue cases                    n i,j Wij (xi − x) xj − x
                                                                     I=                             ,
into endemic, autoregressive and spatiotemporal compo-
                                                                                       i (xi − x)
                                                                                                  2
                                                                              i,j Wij
nents by a multivariate time-series model. The autore-
gressive and spatiotemporal components described an              where n is the number of spatial units indexed by i and j; xi
autoregression on past counts in the same and in other           is the variable of interest in spatial unit i; x is the mean of x;
districts, respectively, which can capture occasional out-       wij is the spatial weight of relationship between units i and
breaks and dependencies across regions [13, 14]. The             j. The above formula can provide an index of dispersion
endemic component captures the background risk of new            from -1 to +1, corresponding to maximum negative and
events by external factors (independent of the history of        positive autocorrelation, respectively [15].
the epidemic) [13, 14]. The results can help to clarify the
spatiotemporal patterns of dengue transmission at 128            Dengue clustering
districts/counties of GD, which might assist in the devel-       The presence of dengue clustering was identified by
opment of dengue control and prevention strategies in this       two cluster detection programs: Anselin’s Local Moran I
province.                                                        (LISA) test statistics and Kulldorff ’s spatial scan method.
                                                                 Using the input area data (case, population and geo-
Methods                                                          graphic information), they can output the location,
Study site                                                       approximate size and significance level of identified clus-
GD Province was selected as the study area because it was        ters. Based on the spatial time series of reported cases,
the most seriously affected region by dengue in China.           the evolution is divided into in four periods (from June
This province is situated in the southern China, which           to August, September, October, and from November to
is an economic, finance, industry and transport center in        December).
China. It has an area of 179,800 km2 and about 100.7               First, LISA was used to identify the localized cluster-
million inhabitants. GD is administratively divided into         ing with specific districts. For the spatial unit i, LISA is
21 prefecture-level cities (see Fig. 5), including 128 coun-     computed as [16]
ties/districts (see Fig. 1). The climate is subtropical humid,
                                                                            xi − x
with short, mild, dry winters and long, hot, wet summers.            Ii =       2
                                                                                     Wij xj − x ,
The annual mean temperature is 21.8◦ C and the annual                         S
                                                                                    j
accumulate precipitation is 1789 mm.
                                                                 where S2 is the variance of x. A positive or negative
Data collection                                                  value of Ii means spatial clustering of similar or dissim-
Dengue is a legally notifiable communicable disease in           ilar incidence rate, which allows to classify regions into
China since 1989. Dengue cases were diagnosed accord-            five categories: high-high, low-low, high-low, low-high,
ing to the unified diagnosis criteria issued by the Chinese      and non-significant. The high-high and low-low areas
Ministry of Health, including clinically diagnosed and           indicated the hot and cold spots of dengue incidence,
laboratory confirmed cases. Dengue cases data reported           respectively. While the high-low and low-high areas were
between 2014 and 2018 was used in this study. The data           the outliers [16].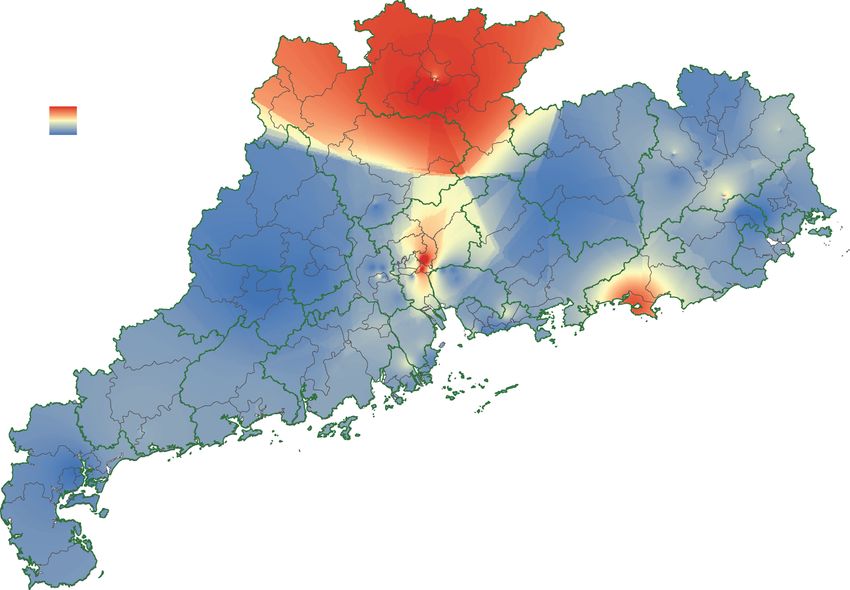
Zhu et al. BMC Infectious Diseases    (2019) 19:493                                                                                     Page 3 of 11

 Fig. 1 Location of the study area. The districts with blue and red colors are Yuexiu and Liwan, respectively. The regions with red and purple
 boundary are the cities of Guangzhou (the provincial capital of Guangdong) and Foshan, which accounted for 82.8% and 7.8% of the total dengue
 cases in 2014, respectively. The map is our own


   Next, Kulldorff ’s spatial scan statistics were used to                    uit = ei νit + λi Yi,t−1 + φi              ωji Yj,t−1 ,           (1)
identify the specific clusters of varying sizes within                                                            j=i
the study area, which was implemented by SaTScan                          and overdispersion parameter ψi > 0 such that the
v9.4.4 (https://www.satscan.org/). The statistic software                 conditional variance of Yit is μit (1 + ψi μit ). In Eq. (1),
can generate circles consisting of regions whose incidence                eit νit is the endemic component, which is used to mod-
rates are significantly higher than the regions outside the               els seasonal variation and trends; the other two compo-
circles [17]. This was achieved by gradually scanning a                   nents are the observation-driven epidemic components:
window across space, and the window with the maximum                      an autoregressive component λit Yi,t−1 at previous time
likelihood was the most likely cluster. A Poisson-based                   step (reproduction of the disease
model was used for this study. This method has previously                                                     within unit i,), and
                                                                          a spatiotemporal component φit j=i ωji Yj,t−1 (transmis-
been validated for plotting and understanding local spa-                  sion from other units) [14]. The three components have
tiotemporal clusters of many epidemics, such as dengue                    log-linear predictors of the forms:
[18, 19] and malaria [20]. Here the maximum cluster size
was set to 5% of the total population at risk.                                 log(νit ) = α (ν) + b(ν)
                                                                                                    i +   [ γs sin(ωs t) + δs cos(ωs t)] ,
                                                                                                              s
Endemic-epidemic multivariate time-series model
                                                                              log(λi ) =   α + b(λ)
                                                                                             (λ)
                                                                                                i ,
The endemic-epidemic multivariate time-series model                                             (φ)
                                                                                            (φ)
proposed by Held and Paul [13, 14], is designed for analyz-                   log(φi ) =   α + bi ,
ing the spatiotemporal components of surveillance data.                   where α (x) is intercept, and b(x)
                                                                                                         i (x = ν, λ, φ) is regional
Let Yit denote the number of cases in region i at time t,                 random effect which accounts for geographic heterogene-
which is assumed to follow negative binomial distribution                 ity. The endemic log-linear predictor νit incorporates a
with conditional mean                                                     periodic wave of frequency by letting ωs = 2π/52 for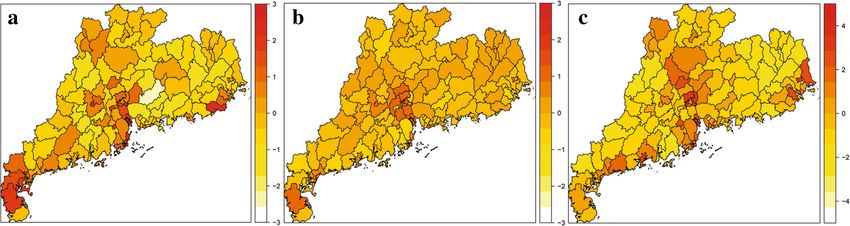
Zhu et al. BMC Infectious Diseases   (2019) 19:493                                                                               Page 4 of 11

weekly data in this paper. The spatiotemporal weight ωji                Spatial autocorrelation
which describes the transmission strength from unit j to i              Table 1 shows a significant positive spatial autocorrelation
is assumed to follow a well-recognized power-law distance               of dengue incidence for the four periods, where the values
decay [11, 21]. The analysis was carried out by the “hhh4”              of global Moran’s I ranged from 0.164 to 4.999. It means
model provided in R package surveillance [13, 14].                      that the districts/counties close together tend to have sim-
                                                                        ilar baseline of incidence rates, and clustered patterns
Results                                                                 existed during this outbreak. Such phenomenon was more
Descriptive analysis                                                    evident in the highly epidemic period, i.e., September and
As shown in Fig. 2, during 1990 and 2013, about 16                      October.
thousand indigenous dengue cases were recorded in GD
Province. In 2014, the number hit a historic record,                    Spatial and temporal clustering
where 45,123 cases were reported in GD, accounting for                  Figure 4 shows the SaTScan-generated cluster circles and
0.042% of the total population. Since then, dengue inci-                local Moran’s I clusters overlain on the map of dengue
dence stayed in a relatively high level, as 8,281 cases                 incidence in GD Province in the four periods. Based on
were notified in GD during 2015 and 2018. In each year,                 the LISA statistics, it is observed that the high-high clus-
cases occurred like convex curve through Summer and                     ters only exhibited in the districts/counties of Guangzhou
Autumn. For the big outbreak in 2014, the indigenous                    and Foshan, suggesting that high incidence rates poten-
cases were first reported in mid-June, with slow increase               tially occurred these regions with interactive transmis-
in July and August. The number in these three months                    sion. During June and August, the high-high clusters first
was 1942 cases. A rapid increase and the peak of the epi-               emerged in the 8 districts of Guangzhou (Yuexiu, Liwan,
demic were observed in September and October, which                     Haizhu, Baiyun, Tianhe, Huangpu, Panyu, and Nansha).
accounted for 17,405 and 23,905 cases, respectively. Dur-               As time went by, the clusters geographically expanded
ing these two months, the dengue infections displayed                   to the west and the north. The cluster covered another
clear spatial expansion trend. After that, the dengue inci-             two districts (Luogang and Nanhai) in September, as well
dence reduced significantly, where the number reported                  as Huadu and Chancheng in October. During November
in November and December was 1871 cases. At dis-                        and December, in addition to adding a new district
trict/county level, the largest number of cases occurred in             (Pengjiang), the clusters restricted in Guangzhou (except
Baiyun district, followed by Haizhu, Yuexiu and Liwan dis-              Zengcheng and Conghua).
tricts, all of which located in the city of Guangzhou. The                Based on the retrospective scan analysis by SaTScan,
Geographical distributions of dengue cases were shown                   many clusters with statistically significant high inci-
in Fig. 3.                                                              dence in different periods were detected. As shown in

 Fig. 2 Monthly number of dengue cases reported in Guangdong Province from 1990 to 2018. The inside figure shows the weekly number of
 dengue cases in 2014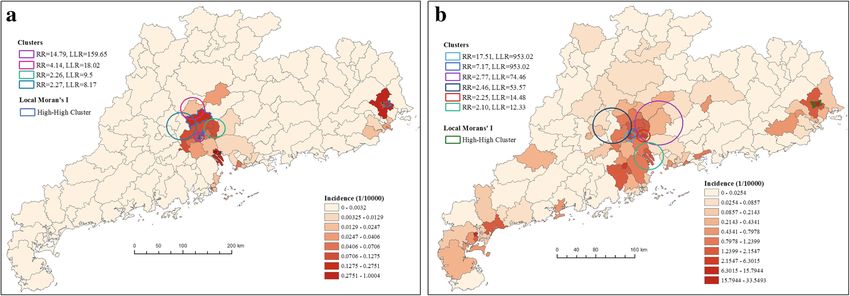
Zhu et al. BMC Infectious Diseases (2019) 19:493 Page 5 of 11
Fig. 3 The geographical distribution of dengue incidence and population size at county/district level in Guangdong Province in 2014. The map is
our own
Fig. 4, during June and August, three significant clus- radius of 16.03 km to include Yuexiu and Tianhe dis-
ters were detected, which covered 7 districts (Liwan, tricts, with 10,648 observed cases (1090.96 expected).
Yuexiu, Haizhu, Baiyun, Nansha, Panyu and Tianhe). In The second likely cluster existed in September, as a cir-
September, another new cluster was observed in Foshan cle center in Liwan district and a radius of 17.41 km to
(Nanhai, Sanshui and Sihui). In October, the clusters include Yuexiu, Haizhu and Tianhe districts, with 7,943
cover more districts in Foshan and Guangzhou (Huangpu, observed cases (832.89 expected). It was observed that
Chancheng, Nanhai, Qingcheng and Huadu), as well as the most likely clusters through the four periods were
Qingcheng District in Qingyuan. After that, the clusters always concentrated in the city of Guangzhou, but as
scattered around cities of Guangzhou, Foshan, Qingyuan the infection propagated, the cluster center vary from
and Jiangmen, will relatively low relative risk and small Liwan, Baiyun, to Luogang, with different radius and
log likelihood ratio. The first likely cluster existed in relative risk.
October, as a circle center in Baiyun district and a
Spatial MOI distributions
Figure 5 illustrate the spatial distributions of MOI. About
Table 1 Spatial autocorrelation statistics on dengue epidemics 6 hundred records of MOI are collected during July
in Guangdong (GD) Province in 2014 and October 2014. These records were marked around
Period Incidence(1/10000) Moran’s I z-score p-value GD, mostly in Guangzhou, Foshan, Shenzhen, Zhong-
June-August 0.184 0.164 3.327 < 0.01 shan, Zhuhai and Dongguan), which are also the high
dengue prevalence areas in recent decade. Based on these
September 1.651 0.499 8.375 < 0.01
records, it was found three clusters with high MOI. locat-
October 2.267 0.494 8.517 < 0.01
ing in Shaoguan and Qingyuan, Shanwei, and Guangzhou,
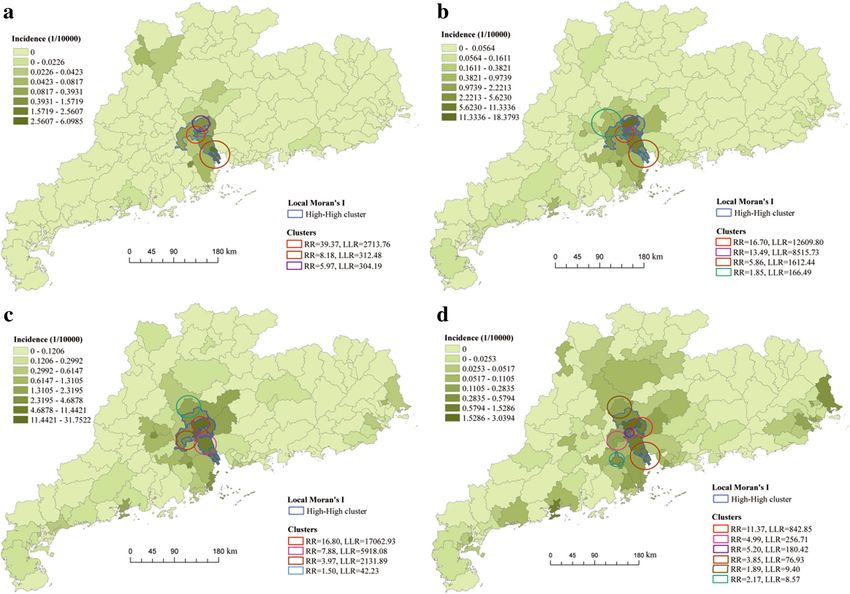
November-December 0.177 0.369 6.778 < 0.01 respectively.Zhu et al. BMC Infectious Diseases (2019) 19:493 Page 6 of 11 Fig. 4 SaTScan-generated cluster circles and local Moran’s I clusters overlain on the map of dengue incidence in Guangdong Province for the study period: (a) June - August, (b) September, (c) October, and (d) November - December of 2014. The RR and LLR represent relative risk and log likelihood ratio, respectively. The maps are our own Endemic-epidemic components Some special features are observed: (1) Dengue cases in Figures 6 and 7 show that the endemic-epidemic com- Yuexiu, Baiyun, Huadu and Nanhai have vast autore- ponents of dengue data by the multivariate time series gressive components, indicating that these districts were model, where the cases were decomposed into endemic, predominantly affected by the previous infection in their autoregressive and spatiotemporal components. own regions; (2) Baoan, Chaoyang and Jiangcheng have The variances of the random effect for the three parts extremely big endemic distributions and thus admitted were estimated to be 0.485, 1.731 and 2.635, respectively. high risk of local transmission; (3) Dengue cases in most It means that there was little variation in the autoregres- districts have spatiotemporal components of dengue sive component, but vast variation in the endemic and cases, especially in Huangpu, Luogang, Zengcheng, spatiotemporal components. As shown in Fig. 6, it is found Dongguan and Zhongshan, indicating that these dis- a homogeneously low random effect of the autoregres- tricts easily suffered dengue infection from the adjacent sion in most of the districts, but a little high value in districts; (4) Liwan, Haizhu, Tianhe, Panyu, Nansha, Guagnzhou and Foshan, as well as Leizhou district, indi- Zengcheng, Conghua, Xiangzhou, Chancheng, Shunde, cating that these regions were affected by large local out- Pangjiang, Jianghai and Qingcheng have similarly big com- breaks. Further, it is observed that the random intercepts ponents of autoregressive and spatiotemporal incidence, of the endemic and spatiotemporal components exhibited which means that the risk of dengue infection in these significant heterogeneity across districts, in which south- districts mainly come from local and neighboring regions. ern and central GD admitted a relatively high endemic incidence with a few cases from other districts. Discussion Figure 7 shows the time series of fitted components This study explored the spatiotemporal variation and for the 25 districts/counties with most dengue cases. association of the dengue transmission in GD Province
Zhu et al. BMC Infectious Diseases      (2019) 19:493                                                                                      Page 7 of 11

 Fig. 5 The marked oviposition positive index (MOI) data during July and October 2014 in Guangdong and the corresponding estimation of the
 spatial MOI distributions by using inverse distance weighting. The labeled name is the 21 prefecture-level cities. The map is our own

in 2014. By using Moran’s I statistics and Spatial scan                       level. Several notable findings could provide meaningful
method, as well as a multivariate time series model, we                       clues for public health authorities to implement effective
were able to clarify the spatiotemporal distribution pat-                     interventions on dengue infection.
terns, detect the dengue clusters, and evaluate the spa-                        We found a significant positive spatial autocorrelation
tiotemporal components of dengue infections. To our                           on the dengue incidence in the four time periods. Further
knowledge, this is the first attempt to infer the dengue                      analysis on the spatial autocorrelation of the yearly inci-
transmission patterns in GD Province at district/county                       dence between 2015 and 2018, yields the global Moran’s I

 Fig. 6 Maps of the estimated random intercepts at district/county level based on a multivariate time series model, which is divided into three parts:
 (a) spatiotemporal, (b) autoregressive and (c) endemic components. The maps are our own
Zhu et al. BMC Infectious Diseases     (2019) 19:493                                                                                     Page 8 of 11

 Fig. 7 Fitted components of dengue cases in 25 districts/counties with most cases by a multivariate time series model. Black dots are drawn for
 weekly counts. The light gray, blue, and orange area shows the estimated endemic, autoregressive, and spatiotemporal contributions. X-axis
 represents the days in the whole year 2014

as 0.147, 0.041, 0.139 and 0.315, respectively. These pos-                   in October. Both cluster detection methods identified
itive values highlight that the districts and counties at                    similar significant clustering, suggesting that the result
geographical proximity shared a similar level of vulnera-                    is robust. It is found that the cluster center, the radius,
bility to dengue, and such feature was more evident as the                   and the relative risk varied across different districts as
disease developed. In other words, dengue infections do                      the infection propagated, but the 5 districts, i.e., Liwan,
not spread uniformly or randomly but occurred in clus-                       Yuexiu, Haizhu, Tianhe and Baiyun, always recorded
ter, and thus suggest possible measures of early detection                   in clustering, indicating their important role in dengue
for disease surveillance. Our results are consistent with                    transmission. Compared to other regions, eastern Foshan,
previous findings that dengue is inclined to spatially cor-                  southwestern and central Guangzhou are more vulner-
relate with clusters [8]. It is possible because that dengue                 able to dengue, which appeared as a dengue hotspot
transmission are affected by a series of factors related to                  in mapping and cluster assessment. The outbreak infor-
environment, climate, society, demography and vectors                        mation in one district of the hotspots can serve as an
[6, 22, 23], and such factors have similar attributions in                   early warning device for a possible outbreak in neigh-
adjacent sites.                                                              boring districts. Our findings are consistent with previ-
   To locate the hotspots for future surveillance strategy,                  ous analysis, where they found similar dengue clusters
we identified the prominent spatial clustering covering                      at rough scale [7, 9–12]. To further verify the location
specific districts. In 2014, though dengue infection rapidly                 of dengue clusters, we performed similar analysis on the
spread over most of districts in GD, it was highly localized                 incidence data in 2016 and 2017. As shown in Fig. 8,
in particular locations and times. We identified 12 sig-                     beside a new cluster observed in east GD (Chaoan and
nificant clusters during the four periods, which included                    Xiangqiao), the districts in Guangzhou (except Nansha,
about 22 districts lied in the cities of Guangzhou, Fos-                     Panyu and Conghua) and in Foshan (except Gaoming)
han, Qingyuan and Jiangmen. The most likely cluster with                     are also marked as the hot regions. The almost over-
the largest relative risk occurred in central Guangzhou                      lapped clusters in recent years indicated that the marked
Zhu et al. BMC Infectious Diseases     (2019) 19:493                                                                                   Page 9 of 11

 Fig. 8 SaTScan-generated cluster circles and local Moran’s I clusters overlain on the map of dengue incidence in Guangdong Province in (a) 2016
 and (b) 2017. The RR and LLR represent relative risk and log likelihood ratio, respectively. The maps are our own

hotspots are not made by chance. Possible reasons that                      necessary for dengue intervention. As a matter of fact,
contribute to such clustering patterns could be: (1) South-                 simultaneous intervention in multi-area since October
western and central Guangzhou is the downtown, with                         2014 had significant effect to control the dengue out-
particular features: dense population density [4], higher                   break in Guangzhou [24]. For those districts with more
temperature (due to the urban heat island effect) [10],                     autoregressive components (Yuexiu, Baiyun, Huadu and
in the process of urbanization [6], and a transporta-                       Nanhai), rigorous intervention strategies should be imple-
tion hub [4, 10]; (2) Eastern Foshan is near Guangzhou,                     mented in case of sudden local infection. For those dis-
which share large human mobility between these two                          tricts with more endemic component, active surveillance
regions [9, 12].                                                            should be adopted since they are more susceptible to
  Using the recorded MOI data, we found three signif-                       dengue infection.
icant high-MOI areas located in Shaoguan, Qingyuan,                            The spatiotemporal analysis presented in this paper
Shanwei and Guangzhou. The proportions of positive                          differs from the existing studies, both in methodology
mosquito ovitraps in Shaoguan and Qingyuan are almost                       and scope. By using Richards model and G* statistic [7],
ninety percent, which signifies high mosquito density                       wavelet analysis [9], and compartmental model [10], these
there. However in reality, these regions admitted low                       researchers found that the initial hot spot for the out-
dengue incidence. That is probably due to the sparsity of                   break was Yuexiu district, and then the disease spread to
human population and human movement, yielding sel-                          its neighboring districts in Guangzhou and other cities
dom circulation of dengue viruses. But in Guagnzhou,                        in GD province in 2014. By using Moran’s I method and
relative high MOI combined with the above-mentioned                         geographical detector, Cao et al. [6] found that central
features easily triggers dengue occurrence.                                 Guangzhou was the hot spot of dengue infection, and that
  By fitting a multivariate time series model to dengue                     temperature, precipitation and road density were the main
cases, we further clarified the spatiotemporal pattern of                   factors leading to dengue transmission in Guangzhou in
dengue transmission. First, we found significant spatial                    2014. By using geographically weighted regression model,
variation in the endemic and spatiotemporal component                       Ren et al. [12] found that population size, road density,
across the districts, while the autoregressive component                    and economic status are the determinants of spatial vari-
was more spatially homogenous, similarly to the pat-                        ability of the 2014 dengue epidemic across Guangzhou
terns in city level [11]. Second, we observed that the                      and Foshan. Cheng et al. [11] decomposed dengue risk in
autoregressive, endemic and spatiotemporal components                       the 21 cities of GD by a multivariate time series model.
have different contributions to each district/county. It is                 They found that endemic component contributed much
important to note that nearly all districts have cases that                 more in the Pearl River Delta area, while areas with rel-
were infected in adjacent regions. Such feature is more                     atively low incidence are highly dependent on spatiotem-
evident in and around urban area, possibly because fre-                     poral and local autoregressive spread. These analyses were
quent human mobility resulted in many interconnected                        mainly based on the city level of GD [6, 7, 9, 11] or dis-
infections between these places. The result reminds us                      trict level of Guangzhou [7, 10, 11]. Our study focus on
that joint control efforts in surrounded regions could be                   the 128 districts and counties of GD, a finer scale and
Zhu et al. BMC Infectious Diseases            (2019) 19:493                                                                                          Page 10 of 11

a larger area, allowing for better understanding dengue                              Consent for publication
transmission patterns.                                                               Not applicable.
  Several limitations existed in our study worth noting.                             Competing interests
(1) The incidence data are based on passive surveillance                             The authors declare that they have no competing interests.
system. We were unable to calculate the unreported and
                                                                                     Publisher’s Note
asymptomatic cases. (2) The cases were recorded in the                               Springer Nature remains neutral with regard to jurisdictional claims in
residence of the patients, which could lead to inconfor-                             published maps and institutional affiliations.
mity with the real location where they were infected. (3)
                                                                                     Author details
The statistic model employed here could not explicitly                               1 School of Mathematics and Computing Science, Guilin University of

incorporate climatic and socio-ecological factors, such as                           Electronic Technology, Guilin 541004, China. 2 Guangdong Provincial
climate and human migration. More efforts are needed to                              Institution of Public Health, Guangdong Provincial Center for Disease Control
                                                                                     and Prevention, No. 160, Qunxian Road, Panyu District, Guangzhou, China.
assess the effects of these factors on the spatiotemporal                            3 Department of Medical Statistics and Epidemiology, School of Public Health,

evolutions of dengue.                                                                Sun Yat-sen University, 510080 Guangzhou, China.

                                                                                     Received: 16 May 2018 Accepted: 24 April 2019
Conclusions
This paper analyzed the spatiotemporal diffusion pat-
terns contributed to the large dengue outbreak in GD in                              References
2014. The results showed that dengue distribution was                                1.   WHO. Dengue and severe dengue. 2017. Available http://www.who.int/
                                                                                          mediacentre/factsheets/fs117/en/. Accessed Oct 2017.
strongly correlated in space, and was highly clustered                               2.   Bhatt S, Gething PW, Brady OJ, et al. The global distribution and burden
around Guangzhou and Foshan, with a slight movement                                       of dengue. Nature. 2013;496:504–7.
of clustering over time. Further analysis revealed that                              3.   Lai S, Huang Z, Zhou H, et al. The changing epidemiology of dengue in
                                                                                          China, 1990-2014: a descriptive analysis of 25 years of nationwide
autoregressive, endemic and spatiotemporal transmission                                   surveillance data. BMC Med. 2015;13:100.
in each district and county had different contributions                              4.   Xiao J, He J, Deng A, et al. Characterizing a large outbreak of dengue
to human infection, and most of districts/counties (espe-                                 fever in Guangdong Province, China. Inf Dis Poverty. 2016;5:44.
                                                                                     5.   Banu S, Hu W, Guo Y, et al. Dynamic spatiotemporal trends of dengue
cially the urban area) had cases that were infected in
                                                                                          transmission in the Asia-Pacific region, 1955-2004. PLoS ONE. 2014;9(2):
adjacent regions. This study can help to clarify the het-                                 e89440.
erogeneity and the associations of dengue transmission                               6.   Cao Z, Liu T, Li X, et al. Individual and interactive effects of socio-
                                                                                          ecological factors on dengue fever at fine spatial scale: A geographical
in time and space, and thus provide insightful informa-
                                                                                          detector-based analysis. Int J Env Res Publ Health. 2017;14(7):795.
tion for public health authorities to plan dengue control                            7.   Sanna M, Wu J, Zhu Y, et al. Spatial and temporal characteristics of 2014
strategies.                                                                               dengue outbreak in Guangdong, China. Sci Rep. 2018;8:2344.
                                                                                     8.   Azil AH, Bruce D, Williams CR. Determining the spatial autocorrelation of
Abbreviations                                                                             dengue vector populations: influences of mosquito sampling method,
GD: Guangdong; GDCDC: Guangdong Provincial Center for Disease Control                     covariables, and vector control. J Vector Ecol. 2014;39(1):153–63.
and Prevention; LISA: Local indicators of spatial association; MOI: Mosquito         9.   Zhu G, Xiao J, Zhang B, et al. The spatiotemporal transmission of
ovitrap index                                                                             dengue and its driving mechanism: A case study on the 2014 dengue
                                                                                          outbreak in Guangdong, China. Sci Total Environ. 2018;622:252–9.
Acknowledgements                                                                     10. Zhu G, Liu J, Tan Q, et al. Inferring the spatio-temporal patterns of
The authors would like to thank the handling editor and the anonymous                     dengue transmission from surveillance data in Guangzhou, China. PLoS
reviewers for their constructive comments.                                                Negl Trop Dis. 2016;10(4):e0004633.
                                                                                     11. Cheng Q, Lu X, Wu JT, et al. Analysis of heterogeneous dengue
Funding                                                                                   transmission in Guangdong in 2014 with multivariate time series model.
This research was jointly supported by the National Key R&D Program of                    Sci Rep. 2016;6:33755.
Ministry of Science and Technology of China (No. 2018YFB0505500 and                  12. Ren H, Zheng L, Li Q, et al. Exploring determinants of spatial variations
2018YFB0505503), the National Natural Science Foundation of China                         in the dengue fever epidemic using geographically weighted regression
(11661026 and 81773497), and Guangxi Natural Science Foundation                           model: A case study in the joint Guangzhou-Foshan area, China, 2014.
(2017GXNSFAA198235), as well as the Natural Science Foundation of                         Int J Environ Res Publ Health. 2017;14(12). https://doi.org/10.3390/
Guangdong Province (2017A030313699). The funders had no role in study                     ijerph14121518.
design, data collection and analysis, decision to publish, or preparation of the     13. Paul M, Held L. Predictive assessment of a non-linear random effects
manuscript.                                                                               model for multivariate time series of infectious disease counts. Stat Med.
                                                                                          2011;30(10):1118–36.
Availability of data and materials
                                                                                     14. Meyer S, Held L, Hohle M. Spatio-temporal analysis of epidemic phenomena
The dataset used in the study is available from the corresponding author.
                                                                                          using the R package surveillance. J Stat Softw. 2017;77(1):1–55.
Authors’ contributions                                                               15. Moran PAP. Notes on continuous stochastic phenomena. Biometrika.
W.M. and Y.H. conceived and designed the experiments; G.Z. and J.X.                       1950;37(1/2):17–23.
performed the experiments; G.Z., J.X., T.L. and B.Z. analyzed the data; G.Z., J.X.   16. Anselin L. Local indicators of spatial association-LISA. Geogr Anal.
and W.M. drafted the manuscript. All authors read and approved the final                  1995;27(2):93–115.
manuscript.                                                                          17. Kulldorff MA. Spatial scan statistic. Commun Stat-Theory Methods.
                                                                                          1997;26(6):1481–96.
Ethics approval and consent to participate                                           18. Banu S, Hu W, Hurst C, et al. Space-time clusters of dengue fever in
The present study was fully reviewed and approved by the Ethics Committee                 Bangladesh. Trop Med Int Health. 2012;17(9):1086–91.
of Guangdong Provincial Center for Disease Control and Prevention. All the           19. Acharya BK, Cao CX, Lakes T, et al. Spatiotemporal analysis of dengue
patient data were de-identified and the data were analysed anonymously.                   fever in Nepal from 2010 to 2014. BMC Publ Health. 2016;16(1):849.
Zhu et al. BMC Infectious Diseases (2019) 19:493 Page 11 of 11
20. Coleman M, Coleman M, Mabuza AM, et al. Using the SaTScan method
to detect local malaria clusters for guiding malaria control programmes.
Malar J. 2009;8(1):68.
21. Meyer S, Held L. Power-law models for infectious disease spread. Ann
Appl Stat. 2014;8(3):1612–39.
22. Xiao J, Liu T, Lin H, et al. Weather variables and the El Nino Southern
Oscillation may drive the epidemics of dengue in Guangdong Province,
China. Sci Total Environ. 2018;624:926–34.
23. Xu L, Stige LC, Chan KS, et al. Climate variation drives dengue dynamics.
Proc Natl Acad Sci. 2017;114(1):113–8.
24. Lin H, Liu T, Song T, et al. Community involvement in dengue outbreak
control: An integrated rigorous intervention strategy. PLoS Negl Trop
Dis. 2016;10(8):e0004919.You can also read