Spatiotemporal spread pattern of the COVID-19 cases in China
←
→
Page content transcription
If your browser does not render page correctly, please read the page content below
Spatiotemporal spread pattern of the COVID-19 cases in China Yongjiu Feng ( yjfeng@tongji.edu.cn ) Tongji University Qingmei Li Tongji University Xiaohua Tong ( xhtong@tongji.edu.cn ) Tongji University Rong Wang Shanghai Ocean University Shuting Zhai Shanghai Ocean University Chen Gao Shanghai Ocean University Zhenkun Lei Shanghai Ocean University Shurui Chen Shanghai Ocean University Yilun Zhou Tongji University Jiafeng Wang Tongji University Xiongfeng Yan Tongji University Huan Xie Tongji University Peng Chen Tongji University Shijie Liu Tongji University Xiong Xv Tongji University Sicong Liu Tongji University Yanmin Jin Page 1/20
Tongji University C. Wang Tongji University Zhonghua Hong Shanghai Ocean University Kuifeng Luan Shanghai Ocean University Chao Wei Tongji University J. Xu Tongji University Hua Jiang Tongji University Changjiang Xiao Tongji University Yiyou Guo Tongji University Research Article Keywords: COVID-19, spatiotemporal spread, in uencing factors, epidemics trend, China DOI: https://doi.org/10.21203/rs.3.rs-32520/v1 License: This work is licensed under a Creative Commons Attribution 4.0 International License. Read Full License Page 2/20
Abstract
COVID-19 is currently spreading widely around the world, causing huge threats on public safety and global
society. This study analyzes the spatiotemporal spread pattern of the COVID-19 in China, reveals China’s
epicenters of the epidemic through spatial clustering, and delineates the substantial effect of distance to
Wuhan on the COVID-19 spread. The results show that the daily new COVID-19 cases mostly occurred in
and around Wuhan before March 6, and then moved to the Grand Bay Area (Shenzhen, Hong Kong and
Macau). The total COVID-19 cases in China were mainly distributed in the east of the Huhuanyong Line,
where the epicenters account for more than 60% of the country’s total on 24 January and 7 February, half
on 31 January, and more than 70% from 14 February. The total cases nally stabilized around 84,000, and
the in ection point for Wuhan was on 14 February, one week later than those of Hubei (outside Wuhan)
and China (outside Hubei). The generalized additive model-based analysis shows that population density
and distance to provincial cities signi cantly associated with the total number of the cases, while
distances to prefecture cities and inter-city tra c stations, and population in ow from Wuhan after 24
January, had no strong relationships with the total number of cases. The results and ndings should
provide valuable insights for understanding the changes in the COVID-19 transmission and controlling the
global COVID-19 spread.

Introduction
At present, many countries have reported a high number of COVID-19 cases and the epidemic is raging
around the world. As of May 27, the world has accumulated 5.7 million of COVID-19 cases, threating
people’s health, economic development and social stability. In the era of globalization, China has not been
immune from the epidemic. In early January 2020, COVID-19 in China broke out in Wuhan, the capital of
Hubei Province, and quickly spread throughout China during the Chinese New Year (Wu et al., 2020). China
had con rmed about 84,000 cases and 4,642 deaths as of April 20 (GMT 24:00+8), according to the
National Health Commission, China (National Health Commission of the PRC, 2020). China has now
successfully controlled the COVID-19 spread, but still needs to strictly prevent and treat the oversea
imported cases.

With the rapid spread of COVID-19 in the world, it is of great signi cance to analyze the spatial evolution of
the epidemic in China, especially the transmission pattern and spread trend, improving our understanding
of the spatiotemporal mechanisms. Some have applied mathematical models to simulate and project the
COVID-19 spread (Arenas et al., 2020; Chinazzi et al., 2020). Li et al. (2020) conducted a preliminary
evaluation of the epidemiological characteristics of COVID-19, indicating that human-to-human
transmission caused by close contacts began to emerge in mid-December and gradually spread over the
following month. The stochastic transmission models with the COVID-19 cases were established to
quantify the effectiveness of contact tracking, cases separation and travel control in curbing the epidemic
(Hellewell et al., 2020; Kucharski et al., 2020). Danon et al. (2020) modi ed the existing national-scale
metapopulation model to establish a spatial model for the COVID-19 spread in England and Wales to
predict the early and peaking time. Wu et al. (2020) estimated the size of COVID-19 in Wuhan and

 Page 3/20
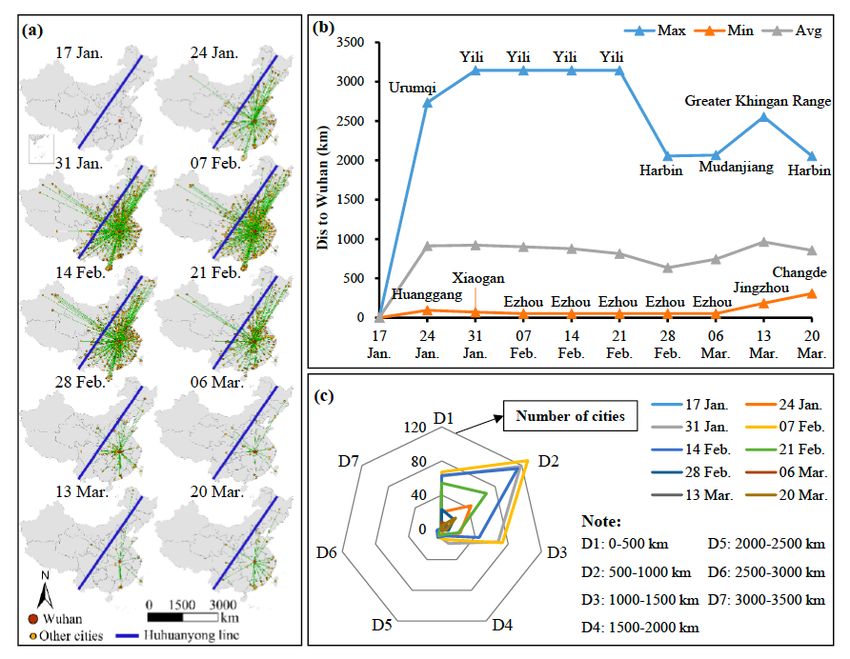
predicted the public health risks of the pandemic in China, and Leung et al. (2020) used a susceptible-
infectious-recovered model to present the potential effects of loosening restrictions after the rst- wave
transmission and project potential second-wave infection. Despite of these useful studies, it is of great
scienti c and practical signi cance for us to understand the COVID-19’s spatiotemporal changes, by
conducting spatiotemporal analysis of the epidemic in China through spatial analysis methods and by
revealing the spatial dynamics of the epidemic regarding its occurrence, development to shrinking.

The purpose of this study is to probe the spatiotemporal spread pattern of COVID-19 in China and analyze
the relationships between the number of cases and its potential in uencing factors, providing brief results
and valuable insights for understanding COVID-19’s spatial transmission and controlling the global COVID-
19 spread.

Results
Spatiotemporal distribution of cities with COVID-19 cases
Distribution of cities con rming cases
Figure 1 shows that the COVID-19 cases in China, initially occurred in Wuhan and spread to all parts of
China, were majorly distributed in cities on the east side of the Huhuanyong Line and only a few on the
west side. The cases peaked on 7 February and were effectively curbed after 21 February. Figure 1a shows
the distribution of cities where new COVID-19 cases have been reported per week. Before 17 January, the
COVID-19 cases con rmed in Wuhan only. Despite the government imposed a lockdown on Wuhan at
10:00 am on 23 January, the COVID-19 epidemic quickly spread to surrounding cities and other areas in
China during the Chinese New Year transport season, and the number of new cases increased sharply.
Figure 1b shows that, as early as the week between 17-24 January, the epidemic spread to nearby city
Ezhou and Huanggang, and to other cities adjacent to Wuhan; since 24 January, the COVID-19 cases even
found in Urumqi and Ili Kazakh Autonomous Prefecture cities that are more than 2,500 km from Wuhan. In
the week between 14-20 March, the COVID-19 epidemic in Hubei Province were substantially under control,
and Changde of Hunan Province (300 km away from Wuhan) is the nearest city that reported new cases.
Figure 1c shows that the cases are mainly distributed in regions that are less than 1,000 km from Wuhan.
From the end of February, the growth rate of new cases gradually slowed down, which indicates that China
effectively controlled the spread of the COVID-19 within two months.

Figure 2 shows the spread trend of COVID-19 from Wuhan to its surroundings as well as a few
metropolises with large population, and that the total cases gradually stabilized at 84,000 after rapid
increases in middle February. Figure 2a illustrates that most cities with high cases are located on the east
side of the Huhuanyong Line while only a few cities reported cases are located on the west side.
Speci cally, the epidemic is serious in Wuhan and surrounding cities, and considerable cases also
occurred in Guangzhou, Shenzhen, Shanghai, and Beijing, as well as cities along the coast of Zhejiang
Province where many people doing business in Wuhan. Figure 2b compares the new and total cases in
Wuhan, Hubei (outside Wuhan) and China (outside Hubei), where the number of new cases in Wuhan

 Page 4/20
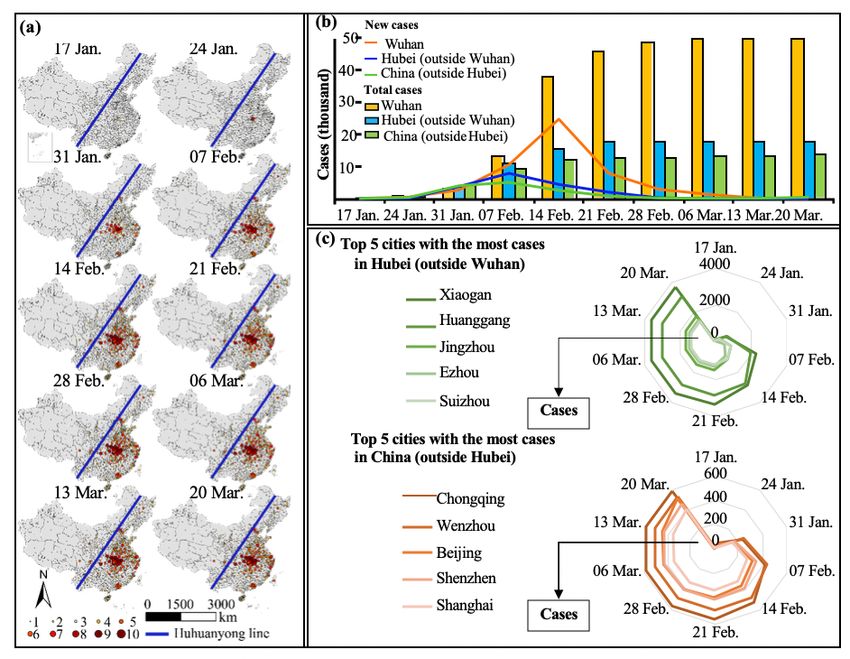
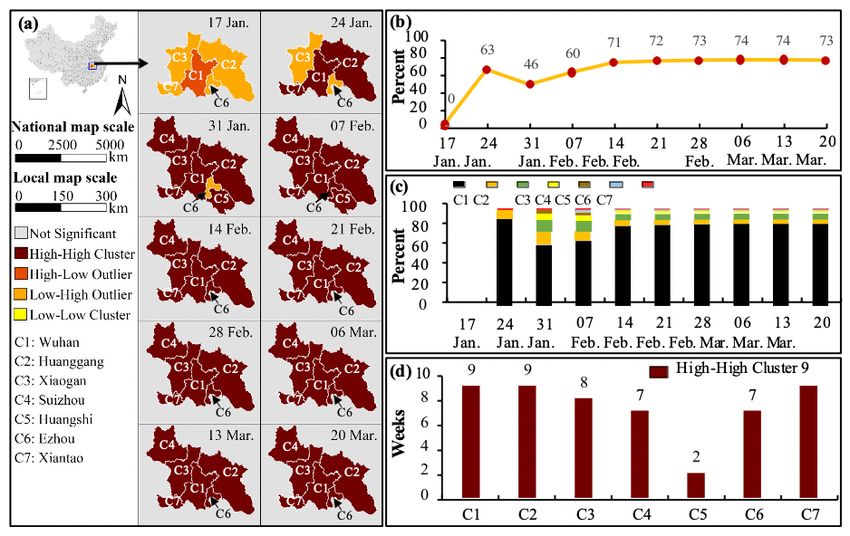
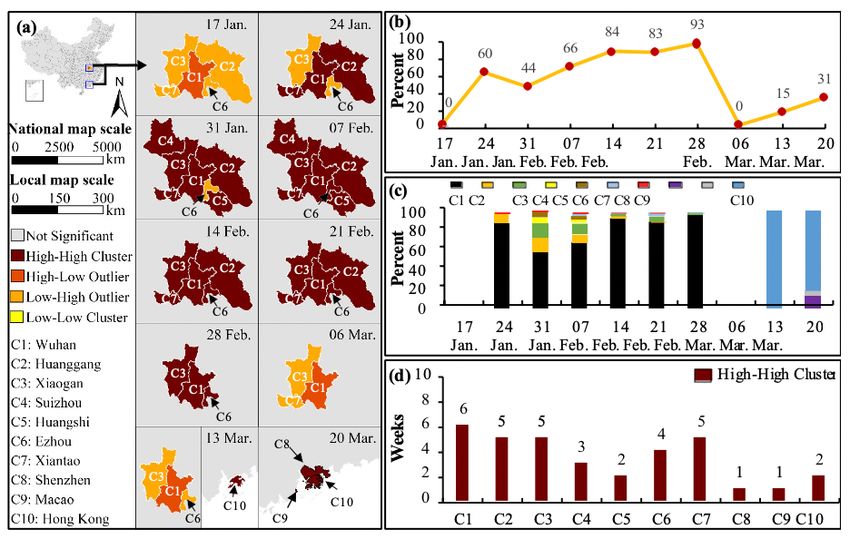
peaked in the week between 8-14 February and those in Hubei and China peaked in the week between 1-7
February. This indicates that the in ection point for Wuhan was on 14 February, one week later than those
of Hubei and China. Two weeks after the rst Fangcang shelter hospitals started to accept patients on 5
February, the number of new cases in Wuhan declined sharply. Figure 2c presents the top-5 cities with
serious COVID-19 in Hubei (outside Wuhan), including Xiaogan, Huanggang, Jingzhou, Ezhou and Suizhou
in descending order, and the top-5 cities in China (outside Hubei) including Chongqing, Wenzhou, Beijing,
Shenzhen and Shanghai in descending order. These suggest that the changes in the COVID-19 cases and
the epidemic spread were signi cantly affected by population movements between Wuhan and the
destinations.

Spatial clustering of total cases
Clustering analysis of the new cases shows that there was a high-high cluster (serious COVID-19) around
Wuhan before 6 March, which moved to the Grand Bay Area (Hong Kong, Shenzhen and Macau) after 6
March (Figure 3a). The high-high cluster occurred in Wuhan, Huanggang and Xiantao on 24 January, and it
expanded to include Xiaogan, Suizhou and Huangshi one week later, then Ezhou was jointed into the high-
high cluster on 7 February when the cluster peaked in its acreage. With the alleviation of the shortage of
medical resources, from 14 February to 28 February, the high-high cluster gradually shrank and it were still
in Hubei. During the week between 28 February and 6 March, there was no statistically signi cant cluster.
The high-high cluster nally occurred in the Grand Bay Area from 7 March to 20 March, including Hong
Kong, Macau and Shenzhen into the cluster sequentially. Figure 3b shows that the new cases in Hubei
(outside Wuhan) accounted for at least 44% (peaked with 93% on 28 February) of the total new cases in
China, while the new cases in the Grand Bay Area only account for fewer than 31%. Figure 3c shows that
Wuhan was ascribed to most cases in the rst cluster while Hong Kong was ascribed to most cases in the
second cluster. This indicates that the COVID-19 outbreak was highly concentrated in Wuhan before March
and then in Hong Kong. Figure 3d illustrates that Wuhan lasted in the most serious area for 6 weeks, and
Huanggang, Xiaogan and Xiantao lasted for 5 weeks, Ezhou lasted for 4 weeks, and the other cities lasted
fewer than 3 weeks. These suggest that the ve cities including Wuhan, Huanggang, Xiaogan, Xiantao and
Ezhou were the most serious areas being affected by COVID-19.

Figure 4a demonstrates that the cities with high incidence of COVID-19 cases were clustered in Hubei,
including seven cities: Wuhan, Huanggang, Xiaogan, Suizhou, Huangshi, Ezhou and Xiantao. Figure 4b
indicates that COVID-19 was rst reported in Wuhan, and the total cases in the high-high clusters account
for more than 60% of the country’s total cases in/on 24 January and 7 February, half on 31 January, and
more than 70% from 14 February. When the SARS-CoV-2 virus spread in Wuhan, the citizens had a weak
awareness of self-protection and participated in a few large-scale social events such as a large
neighborhood party held in Baibuting community on 18 January. This has led to the community-level
cluster infections and outbreaks of COVID-19. As a result, Wuhan’s total cases account for more than 60%
of the total cases in the high-high clusters from 24 January (Figure 4c). Figure 4d shows that since 24
January, all cities lasted for more than 7 weeks in the high-high clusters except Huanggang. Different from

 Page 5/20

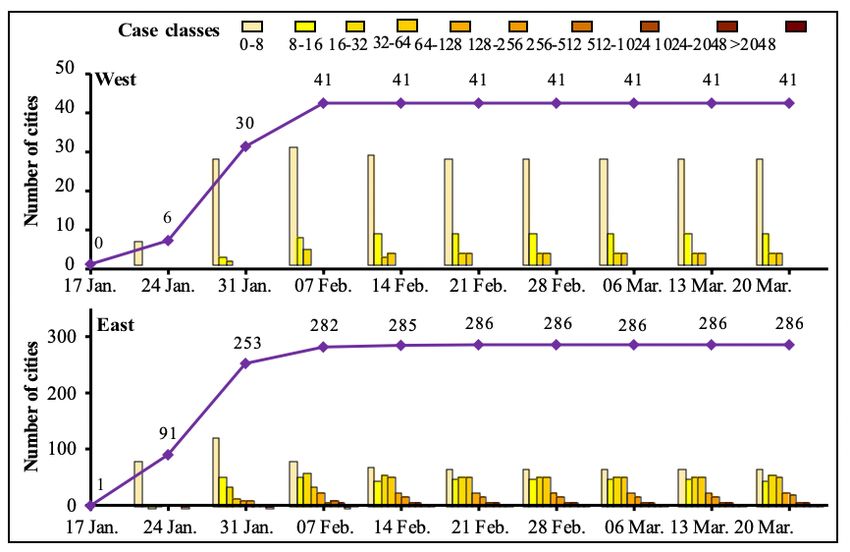
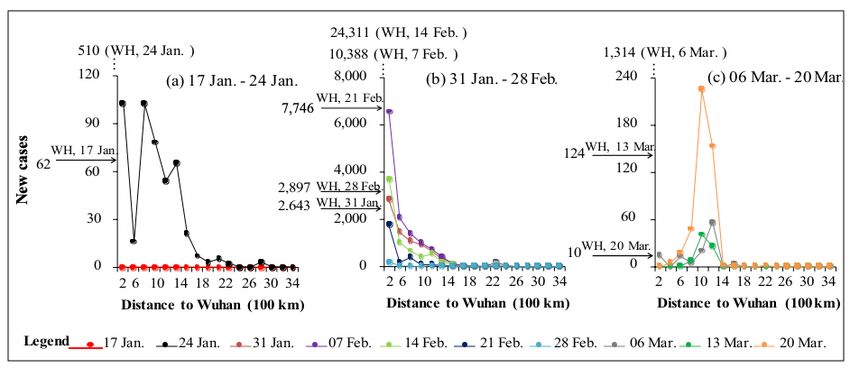
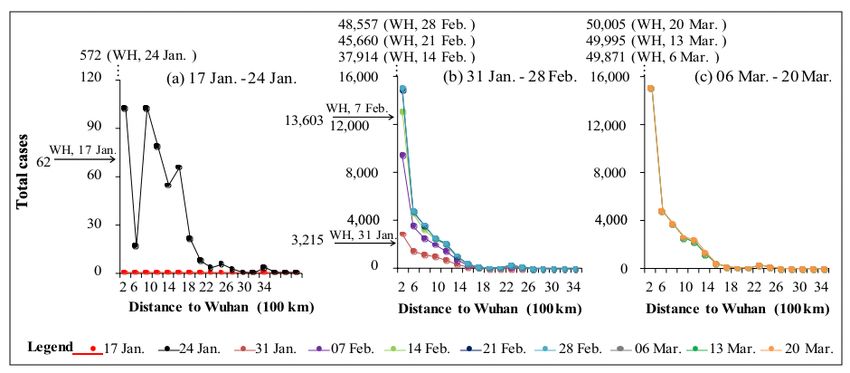
the clusters of new cases, Hubei had been the most serious COVID-19 area, which contributed to the
highest number of the total COVID-19 cases since the outbreak.

Spatial pattern characterized by the Huhuanyong Line
Figure 5 indicates that the number of cities occurring new COVID-19 cases are much more on the east side
than on the west side of the Huhuanyong Line. During the study period, the total cities on the west side
occurring new cases were fewer than 32, while many cities on the east side reporting more than 64 new
cases per week and more than 200 cities reporting new cases during 31 January and 21 February. During 7
March and 13 March, fewest cities on the east side occurring new local cases, but there are more new
cases after 13 March because of the oversea transmission cases. Since then, China begun to guard
against the oversea transmission cases to avoid a soar in potential COVID-19 infections.

Figure 6 shows that, for both sides, cities occurring COVID-19 have increased gradually from 17 January to
7 February when the number of cities peaked by 41 on the west and 286 on the east. The total number of
cases in all west cities are all fewer than 64 and most of them have no more than 8 cases. After 7
February, the epidemic situation in western cities were under control basically, while the situation in eastern
cities continued to deteriorate, with the cities reporting much more COVID-19 cases. A few cities on the east
side reported more than 500 cases. The epidemic peak of China's current epidemic has passed, but the
alarm of the second spread wave in local areas (e.g. frontier cities and international metropolis) does not
stop.

Impact of distance to Wuhan
Figure 7 shows that the distance to Wuhan substantially affects the occurrence of the COVID-19 cases as
revealed by the 200 km radius-based buffer rings. There are three distinct periods of the COVID-19 spread:
1) Period 1 from 17 January to 24 January (Figure 7a), 2) Period 2 from 25 January to 28 February (Figure
7b), and 3) Period 3 from 29 February to 24 March (Figure 7c). In the period 1, cities with distance of
200~400 km to Wuhan reporting few new cases, and those with distance of 600~1200 km to Wuhan
reporting more cases (Figure 7a). In the period 2, the new cases in Wuhan increased dramatically and a
closer region had more new cases each week (Figure 7b). The curve also shows a small bulge at 2,200 km,
which is attributed to the new cases of the northeast city Harbin around February 7. COVID-19 was more
severe in a small city Jining than in megacities such as Hangzhou and Zhengzhou within distance to
Wuhan (600~800 km). In the week of 8-14 February, new cases in most cities decreased compared with
the last week, but the new cases in Wuhan increased sharply, which can be attributed to the new scheme to
diagnose the epidemic and more than 10,000 were reported on 12 February. Then the new cases in Hubei
began to decrease, with the assistance of medical staff and resources across the country. In the period 3,
except Wuhan, cities with distance of 800~1400 km to Wuhan reporting the most of the new cases (Figure
7c). Although nearby cities such as Huanggang and Xiaogan had high total cases, they had no increase
later (Figure 7c). New cases surged in Shenzhen and Beijing were largely due to the oversea imported

 Page 6/20
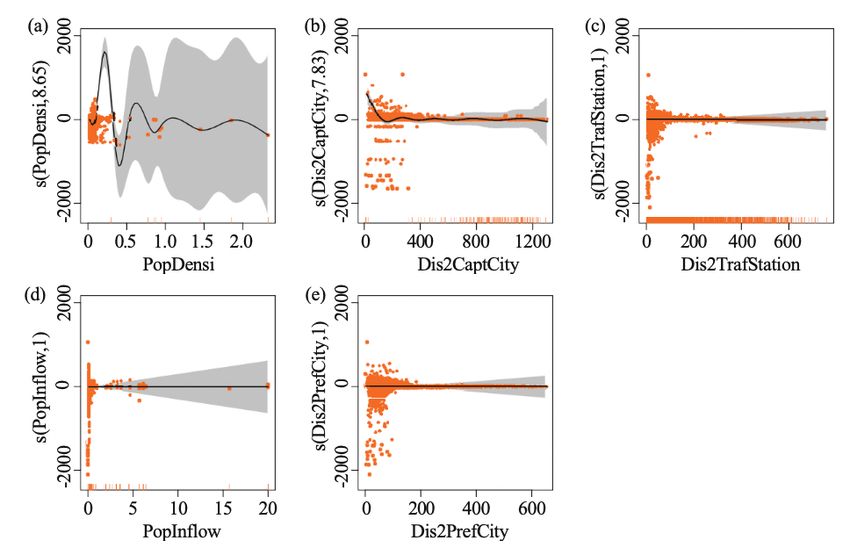
cases in the week of 16-20 March. Overall, for local cases in China, the distance to Wuhan substantially
re ect the regional population ow thus the spatial diffusion of the infected COVID-19 cases across cities.

Figure 8 shows that except for cities (e.g. Beijing, Shanghai, Wenzhou and Guangzhou) with large
population ow with Wuhan, within distance of 1,600 km, the closer to Wuhan the greater the number of
total cases. The total cases have weak relations with the distance to Wuhan when it is further than 1,600
km. Figure 8a shows that in the early stage of the outbreak, the distribution of total cases was similar to
that of the new cases (Figure 7a). Figures 8b-c show that the total cases are signi cantly affected by the
distance to Wuhan since 25 January. There are thousands of cases in Xiaogan, Xiangyang and
Huanggang, nearby cities of Wuhan; while the Jiamusi, Altay and Rikaze cities that are far away from
Wuhan had very few cases. The curves of the last two weeks show minor changes, indicating the COVID-
19 cases in China have already peaked.

Impact of potential in uencing factors
We further analyzed the impact of potential in uencing factors on the COVID-19 spread using GAM. The
degree of freedom (DOF) of the GAM’s smoothing function has a substantial in uence on the model’s
estimation and stability. We applied the Akaike Information Criterion (AIC) to de ne the best DOF to
addressing the potential in uencing factors (Table 1).

 Table 1 The best degree of freedom of the potential influencing factors using AIC.

 Factors DOF Implication

 PopDensi 8.65 A strong relationship between the total COVID
 19 cases and the factor.
 Dis2CaptCity 7.83 A strong relationship between the total COVID
 19 cases and the factor.
 Dis2TrafStation 1 A weak relationship between the total COVID-
 19 cases and the factor.
 PopInflow 1 A weak relationship between the total COVID-
 19 cases and the factor.
 Dis2PrefCity 1 A weak relationship between the total COVID-
 19 cases and the factor.

The loess plots (95% con dence level) show that the relationships between the total cases and the ve
potential factors (Figure 9). The PopDensi and Dis2CaptCity have higher DOF values, which signi cantly
associated with the total number of cases. The Dis2PrefCity, Dis2TrafStation and PopIn ow factors have a
DOF of 1, which indicates their weak correlations with the total cases. The provincial capitals outside
Hupei have more cases than other prefecture-level cities, where the capitals have higher population density
and more frequent population movement than the prefecture-level cities, relating to higher cases in the
capitals as revealed by the PopDensi and Dis2CaptCity factors. In prefecture-level cities, some counties
have serious epidemics while others may have none cases, thus the total number of cases is much weakly
related to Dis2PrefCity (the distance to the prefecture-level city centers). Since 23 January, the population
out ow from Wuhan is extremely minor because of the lockdown and the strict quarantine measures,
 Page 7/20
resulting the weak relationship between the total COVID-19 cases and the PopIn ow and Dis2TrafStation
factors. However, the out ow of population before lockdown and the long incubation period of the disease
caused the rapid spread of the epidemic later.

Discussion
The outbreak of COVID-19 is a great challenge to people's health, medical systems, economic development
and social stability. It is valuable to conduct spatial analysis of COVID-19 in China at the prefecture-level
cities. This study used data of the weekly new and total cases to delineate the spatiotemporal pattern and
dispersal trend of COVID-19 during 17 January (the rst day Wuhan o cially reporting the COVID-19
cases) and 20 March (no new domestic COVID-19 cases).

Our analysis shows that the COVID-19 epidemic spread in China is closely associated with geographic
factors and human activities. In China, the epidemic rst broke out in Wuhan, and subsequently Hubei and
its neighboring Henan, Hunan, Anhui, Jiangxi, and Chongqing became the core affected areas. In the early
days of the epidemic, the cities with a high number of cases are provincial capitals (e.g. Changsha of
Hunan) and transportation hubs (e.g. Bengbu of Anhui). The epidemic then rapidly spread in these cities
initially caused by the imported transmission from Wuhan then by local transmission. For cities such as
Jining (in Shandong) and Kunming (in Yunnan) that are far away from Hubei, COVID-19 has spread rapidly
in local transmission because the public and personal preventive measures were not su cient at rst.

According to WHO, the infection was mainly transmitted through contact with respiratory droplets that are
generally caused by short social distance (World Health Organization, 2020); macroscopically, COVID-19 in
China is greatly affected by population movements between Wuhan and other cities and the subsequent
local transmission. Thus, personal preventive measures such as wearing a mask and maintaining a long
social distance are very important to protect each individual and others from being infected. A ood of
people leaving Wuhan during the Chinese New Year could spread the virus across the country before all
entrances and exits were closed on 23 January. Four metropolises (e.g. Beijing, Shanghai, Shenzhen, and
Guangzhou) that are more than 700 km from Wuhan experienced serious epidemics, where a large number
of passengers going in and out of Wuhan. As one of China's major trading cities, Wenzhou has many
businessmen working in Wuhan who returned home before Chinese New Year, ascribing to the rapid spread
of COVID-19 in this city. Harbin and Sanya, which are far away (more than 1,400 km) from Wuhan, e.g.
also unexpectedly experienced serious COVID-19 epidemic, which may be attributed to the tourists coming
from Wuhan and some of them have carried the SARS-CoV-2 virus.

For the analysis of macro impacts, we considered population density, population in ow from Wuhan, and
distances to provincial cities, prefecture-level cities and tra c stations. The ndings revealed that
PopDensi and Dis2CaptCity are the most in uential factors of the COVID -19 spread while Dis2TrafStation,
Dis2PrefCity and PopIn ow only weakly affect the COVID-19 spread. According to the authoritative
records, many cases were initially found in stations, docks and airports, but these may not be re ected on
the map and only reported in the statistics of the new and total cases. After the lockdown of Wuhan,
population out ow was minor thus the data we acquired from Baidu migration (in percentage) may be
 Page 8/20
insu cient to conduct a systematic analysis. Because COVID-19 has its incubation period (some even
more than 40 days), these people out ow from Wuhan could cause community-level infections in other
cities. Population social gathering together with the infection source from exposure in Wuhan have
occurred in many cities such as Tianjin, Beijing and Chengdu, which was an essential cause leading to the
rapid deterioration of the COVID-19.

It was acknowledged that nonpharmaceutical public health interventions can effectively curb the COVID-19
spread (Pan et al., 2020). From 23 January, Wuhan began to build two makeshift hospitals: Huoshenshan
(Fire God Mountain) and Leishenshan (Thunder God Mountain) in 10 days to treat the severe COVID-19
patients by replicating Beijing’s SARS treatment model in 2003. To treat the mild COVID-19 patients, the
 rst three Fangcang shelter hospitals were built in 3 days since its construction started on 2 February.
From 5 February to 10 March, a total of 16 Fangcang shelter hospitals opened in Wuhan to provide
isolation, detection, treatment and shelter for patients with mild symptoms of COVID-19, curing more than
12,000 patients (People's Daily Online, 2020). More than 42,000 medical personnel from all over the
country gathered to ght against COVID-19 with local medics in Wuhan, and China has established a
"pairing up support for Hubei" relationship, which requested provinces and municipalities to support 16
cities in Hubei. All levels of nancial departments have allocated 121.8 billion Chinese Yuan for epidemic
prevention and control, of which the Central Ministry of Finance spent 25.75 billion Chinese Yuan as of 21
March (China News Service, 2020). All these are main reasons for the rapid control of COVID-19 in China.

In addition, community-based countermeasures are strictly carried out in all cities, which include
suspending mass gathering, and using online health QR code to enter and exit communities and public
places. The government guides the residents to enhance self-protection, maintain on- and-off social
distancing, and comply with the prevention and controlling regulations according to laws. Some
unprecedented moves have also been introduced, such as extending the Spring Festival holiday and
postponing the spring semester of schools and universities (Guangming Daily, 2020). At present, the
COVID-19 epidemic in China has been controlled substantially, but yet to be eliminated completely. Most
recently, many overseas imported cases were con rmed in Harbin of northeast China and Guangzhou of
southern China. This may lead to the second epidemic wave and affect the spread pattern of the epidemic
in China, but the recent medical experiences and the increased awareness of the public will greatly reduce
the spread speed and scope of the epidemic.

Conclusion
This study analyzes the spatiotemporal spread pattern of COVID-19 in China, and the impacts of potential
in uencing factors on the epidemic spread. We conclude that 1) the COVID-19 cases were mainly
distributed in the east of the Huhuanyong Line, where the epicenters account for a high proportion of the
country’s total; 2) restricted by medical resources and the ability to detect the SARS-CoV-2 virus, the
in ection point of COVID-19 in Wuhan was on 14 February, one week later than Hubei (outside Wuhan) and
China (outside Hubei); and 3) population density and distance to provincial cities signi cantly associated
with the total number of cases. On-and-off social distancing is a powerful and cost-effective approach

 Page 9/20
until targeted vaccines and speci c drugs are available. All results and ndings provide valuable insights
into the transmission evolution and curbing the spread of COVID-19.

Data And Methods
Data collection
The number of new and total COVID-19 cases and their locations are the key data to delineate the spatial
spread of the epidemic. We collected the daily number of new and total COVID-19 cases, for each
prefecture-level and county-level city, reported by the National Health Commission of China (en.nhc.gov.cn)
and the Health Commissions of local governments from 17 January to 20 March, 2020. We reclassi ed the
data by week to better capture the critical changes in the epidemic spread while reducing the data
redundancy.

To brie y illustrate the impacts of determinants on the epidemic spread, we considered the
sociodemographic and human disturbance aspects. Among these, the sociodemographic impacts were
represented using the total persons per pixel (PopDensi measured in remote sensing images) provided by
WorldPop (www.worldpop.org), and the population movements (PopIn ow) between Wuhan and other
Chinese cities. The human disturbances were measured using the proximity to provincial cities
(Dis2CaptCity), prefecture cities (Dis2PrefCity), and inter-city tra c stations (Dis2TrafStation). The
proximity factors were produced using the Euclidean Distance based on vector maps collected from
OpenStreetMap (www.openstreetmap.org) and Baidu (qianxi.baidu.com). The potential factors were all
resampled to a resolution of 500 m. Although higher resolutions could offer more details, they would also
result in negative effects such as data redundancy and lower computational e ciency. The base map of
China was provided by the Resource and Environment Data Cloud Platform (www.resdc.cn). All the spatial
data were projected using the Albers equal-area conic projection.

Analysis methods
To better present the COVID-19 pattern, we classi ed the case number into 10 levels: (0, 8], (8,16], (16, 32],
(32,64], (64,128], (128,256], (256,512], (512,1024], (1024,2048], and (2048,∞]. To clarify the spatial trend of
the COVID-19 transmission, we applied the Anselin Local Moran’s I statistic to delineate the spatial
distribution of the weekly new and total cases. This statistic divides the study area into ve categories of
regions: 1) high-high cluster (severely infected area, cities with high cases surrounded by cities with high
cases), 2) high-low outlier (spatial outlier, cities with high cases surrounded by cities with low cases), 3)
low-high outlier (spatial outlier, cities with low cases surrounded by cities with high cases), 4) low-low
cluster (secure area, clustered areas with similar low cases), and 5) not statistically signi cant area (the
number of cases in cities was not statistically clustered). The clusters were de ned at a signi cant level of
0.05. We applied the Huhuanyong Line to describe the COVID-19 patterns in the east and west sides of
China, and described the impact of distance to Wuhan on the spatial pattern of COVID-19 using concentric
buffer rings with Wuhan as the center.
 Page 10/20
Using a generalized additive model (GAM), we linked each potential factor with the COVID- 19 cases to
quantify its effect on the epidemic. Because linear regression cannot address the COVID-19 changes
across space, we used the GAM’s exible smooth method to build the complex relationships between the
COVID-19 spread and its in uencing factors. GAM is a nonparametric extension of the generalized linear
model, which makes the model exible to deal with the nonlinear relationship between response and
multiple explanatory variables by using an unspeci ed smoothing function (Hastie and Tibshirani, 1990;
Wood, 2006). The rank-order of factors plays a key role in GAM, where a prior factor is more statistically
signi cant and indicates a stronger explanatory ability (Feng et al., 2018). After de ning the sort-order of
factors, the GAM can be written as:

 ( )~ 0 + 1(PopDensi) + 2(Dis2CaptCity) + 3(Dis2TrafStation) + 4(PopIn ow) +
 5(Dis2PrefCity) + (1)

where ( ) is a link function that represents the effects of in uencing factors on the COVID- 19
cases, 0 donates a constant, () is a smoothing function that describes the relationships between
 ( ) and the ith factor, and is the model residual.

Declarations
On behalf all authors, we declare no competing interests.

References
Arenas, A., Cota, W., Gomez-Gardenes, J., Gómez, S., Granell, C., Matamalas, J. T., Soriano-Panos, D., and
Steinegger, B., 2020, A mathematical model for the spatiotemporal epidemic spreading of COVID19:
medRxiv, p. 2020.2003.2021.20040022.

China News Service, 2020, Various levels of nance have allocated 121.8 billion yuan for epidemic
prevention and control, Available at www.chinanews.com/cj/2020/03-24/9136320.shtml (In Chinese).

Chinazzi, M., Davis, J. T., Ajelli, M., Gioannini, C., Litvinova, M., Merler, S., Pastore y Piontti, A., Mu, K., Rossi,
L., Sun, K., Viboud, C., Xiong, X., Yu, H., Halloran, M. E., Longini, I. M., and Vespignani, A., 2020, The effect of
travel restrictions on the spread of the 2019 novel coronavirus (COVID-19) outbreak: Science, p. eaba9757.

Danon, L., Brooks-Pollock, E., Bailey, M., and Keeling, M. J., 2020, A spatial model of CoVID-19 transmission
in England and Wales: early spread and peak timing: medRxiv, p. 2020.2002.2012.20022566.

Feng, Y., Liu, Y., and Tong, X., 2018, Spatiotemporal variation of landscape patterns and their spatial
determinants in Shanghai, China: Ecological Indicators, v. 87, p. 22-32.

Guangming Daily, 2020, China has taken strictest measures to curb epidemic, Available at
http://en.gmw.cn/2020-02/01/content_33515369.htm.

 Page 11/20
Hastie, T. J., and Tibshirani, R. J., 1990, Generalized Additive Model, CRC Press.

Hellewell, J., Abbott, S., Gimma, A., Bosse, N., Jarvis, C., Russell, T., Munday, J., Kucharski, A., Edmunds, W.,
group, C., Funk, S., and Eggo, R., 2020, Feasibility of controlling 2019-nCoV outbreaks by isolation of cases
and contacts.

Kucharski, A. J., Russell, T. W., Diamond, C., Liu, Y., Edmunds, J., Funk, S., Eggo, R. M., Sun, F., Jit, M.,
Munday, J. D., Davies, N., Gimma, A., van Zandvoort, K., Gibbs, H., Hellewell, J., Jarvis, C. I., Clifford, S.,
Quilty, B. J., Bosse, N. I., Abbott, S., Klepac, P., and Flasche, S., 2020, Early dynamics of transmission and
control of COVID-19: a mathematical modelling study: The Lancet Infectious Diseases.

Leung, K., Wu, J. T., Liu, D., and Leung, G. M., 2020, First-wave COVID-19 transmissibility and severity in
China outside Hubei after control measures, and second-wave scenario planning: a modelling impact
assessment: The Lancet.

Li, Q., Guan, X., Wu, P., Wang, X., Zhou, L., Tong, Y., Ren, R., Leung, K., Lau, E., Wong, J. Y., Xing, X., Xiang, N.,
Wu, Y., Li, C., Chen, Q., Li, D., Liu, T., Zhao, J., Li, M., and Feng, Z., 2020, Early Transmission Dynamics in
Wuhan, China, of Novel Coronavirus–Infected Pneumonia: New England Journal of Medicine, v. 382.

National Health Commission of the PRC, 2020, March 21: Daily brie ng on novel coronavirus cases in
China, Available at http://en.nhc.gov.cn/2020-03/21/c_78058.htm.

Pan, A., Liu, L., Wang, C., Guo, H., Hao, X., Wang, Q., Huang, J., He, N., Yu, H., Lin, X., Wei, S., and Wu, T.,
2020, Association of Public Health Interventions With the Epidemiology of the COVID-19 Outbreak in
Wuhan, China: JAMA.

People's Daily Online, 2020, Patients and medical workers bid farewell before nal Fangcang makeshift
hospital shuts down, Available at http://en.people.cn/n3/2020/0314/c98649-9668313.html.

Wood, S., 2006, Generalized Additive Models: An Introduction With R, CRC Press, 391 p.:

World Health Organization, 2020, Q&A on coronaviruses (COVID-19), Available at www.who.int/news-
room/q-a-detail/q-a-coronaviruses.

Wu, J. T., Leung, K., and Leung, G. M., 2020, Nowcasting and forecasting the potential domestic and
international spread of the 2019-nCoV outbreak originating in Wuhan, China: a modelling study: The
Lancet, v. 395.

Figures

 Page 12/20
Figure 1

Spatiotemporal pattern of cities where new COVID-19 cases were reported each week, from 17 January
2020 to 20 March 2020. (a) Location of the cities; (b) The nearest, farthest and average distance from
Wuhan to the cities; and (c) The number of cities with new COVID-19 cases at different distances to
Wuhan. Note: The designations employed and the presentation of the material on this map do not imply
the expression of any opinion whatsoever on the part of Research Square concerning the legal status of
any country, territory, city or area or of its authorities, or concerning the delimitation of its frontiers or
boundaries. This map has been provided by the authors.

 Page 13/20
Figure 2

Spatiotemporal pattern of the total COVID-19 cases each week, from 17 January 2020 to 20 March 2020.
(a) Levels of the number of the total cases in different cities; (b) The new and total cases in Wuhan, Hubei
(outside Wuhan) and China (outside Hubei); and (c) Top 5 cities with the most cases in Hubei (outside
Wuhan) and China (outside Hubei). Note: The designations employed and the presentation of the material
on this map do not imply the expression of any opinion whatsoever on the part of Research Square
concerning the legal status of any country, territory, city or area or of its authorities, or concerning the
delimitation of its frontiers or boundaries. This map has been provided by the authors.

 Page 14/20
Figure 3

Spatial clusters of the new COVID-19 cases each week from 17 January 2020 to 20 March 2020. (a)
Spatiotemporal change in the clusters of new cases; (b) The percent of new cases in the high-high clusters
compared to the total new cases in China; (c) The percent of the new cases in each city in each high-high
cluster; and (d) The number of weeks each city included in the high-high clusters. Note: The designations
employed and the presentation of the material on this map do not imply the expression of any opinion
whatsoever on the part of Research Square concerning the legal status of any country, territory, city or area
or of its authorities, or concerning the delimitation of its frontiers or boundaries. This map has been
provided by the authors.

 Page 15/20
Figure 4

Spatial clusters of the total COVID-19 cases each week from 17 January 2020 to 20 March 2020. (a)
Spatiotemporal change in the clusters of the total cases; (b) The percent of the total cases in the high-high
clusters compared to the total cases in China; (c) The percent of the total cases in each city in each high-
high cluster; and (d) The number of weeks each city included in the high-high clusters. Note: The
designations employed and the presentation of the material on this map do not imply the expression of
any opinion whatsoever on the part of Research Square concerning the legal status of any country,
territory, city or area or of its authorities, or concerning the delimitation of its frontiers or boundaries. This
map has been provided by the authors.

 Page 16/20
Figure 5

Cities categorized by the levels of the new COVID-19 cases on both sides of the Huhuanyong Line.

 Page 17/20
Figure 6

Cities categorized by the levels of the total COVID-19 cases on both sides of the Huhuanyong Line.

 Page 18/20
Figure 7

The distribution of weekly new COVID-19 cases with distance to Wuhan. (a) Period 1 from 17 January to
24 January; (b) Period 2 from 31 January to 28 February; and (c) Period 3 from 6 March to 20 March.

Figure 8

The distribution of the total COVID-19 cases with distance to Wuhan. (a) Period 1 from 17 January to 24
January; (b) Period 2 from 31 January to 28 February; and (c) Period 3 from 6 March to 20 March.

 Page 19/20
Figure 9

Relationships between the number of COVID-19 cases and their potential impact factors with 95%
con dence level.

Supplementary Files
This is a list of supplementary les associated with this preprint. Click to download.

 COVID19DataChina.zip

 Page 20/20
You can also read