SPATS TASK 1-650 - REVIEW OF UPDATES TO EMISSION CURVES FOR NON-CONVENTIONAL ICE AND ULTRA-LOW EMISSION VEHICLES
←
→
Page content transcription
If your browser does not render page correctly, please read the page content below
SPaTS Task 1-650 – Review of updates to
emission curves for non-conventional ICE
and ultra-low emission vehicles
Task in: Production of updated emission curves for NTM and
WebTAG
___________________________________________________

Report for Department for Transport

DFT: 1-650 P04102073
through Arup, ref no: 268492-13

                  ED 11852 | ULEV evidence review, Issue 3 | Date 26/03/2019

                                      Ricardo in Confidence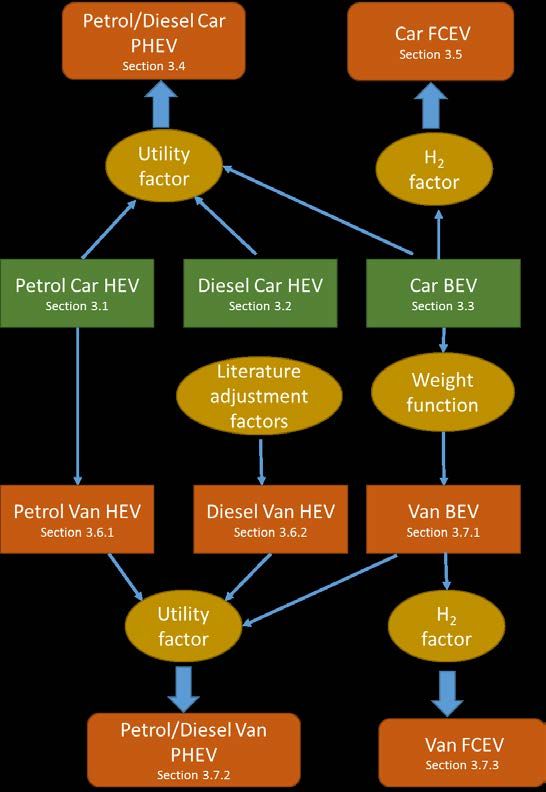
SPaTS Task 1-650 – Review of updates to emission
                                  curves for non-conventional ICE and ultra-low emission vehicles | i

Customer:                                            Contact:

Department for Transport                             John Norris

                                                     Ricardo Energy & Environment
Customer reference:
                                                     Gemini Building, Harwell, Didcot, OX11 0QR,
DfT: 1-650 P04102073                                 United Kingdom
Through Arup; Arup ref no: 268492-13
Confidentiality, copyright & reproduction:           t: +44 (0) 1235 75 3685
                                                     e: John.Norris@ricardo.com
This report is the Copyright of Department for
Transport. It has been prepared by Ricardo
Energy & Environment, a trading name of
Ricardo-AEA Ltd, under contract to Department        Ricardo-AEA Ltd is certificated to ISO9001 and
for Transport dated 03/09/2018. The contents of      ISO14001
this report may not be reproduced in whole or in
part, nor passed to any organisation or person
without the specific prior written permission of     Author:
Department for Transport. Ricardo Energy &
Environment accepts no liability whatsoever to
any third party for any loss or damage arising       John Norris (Ricardo Energy & Environment)
from any interpretation or use of the information
contained in this report, or reliance on any views
expressed therein.
                                                     Approved By:
                                                     Tim Murrells

                                                     Date:
                                                     26 March 2019

                                                     Ricardo Energy & Environment reference:
                                                     Ref: ED11852- ULEV evidence review, Issue 3

Ricardo – In confidence                         Ref: Ricardo/ED11852/ULEV evidence review, Issue 3
SPaTS Task 1-650 – Review of updates to emission
                                                    curves for non-conventional ICE and ultra-low emission vehicles | ii

Table of contents
1          Introduction ...................................................................................................................2

1.1        Overview ....................................................................................................................................... 2

1.2        Scope and overview of the methodology ...................................................................................... 2
2          Résumé of data and method tables used in the original report ...............................4

2.1        Overview of the core data sources ............................................................................................... 4

2.2        Summary of key data sources used ............................................................................................. 9
3          LDV - Detailed consideration of data available ........................................................10

3.1        Emission models ......................................................................................................................... 10

    3.1.1 COPERT 10

    3.1.2 Swiss-German-Austrian Handbook of Emission Factors (HBEFA) ......................................... 11

    3.1.3 PHEM and other Vehicle simulation models ............................................................................ 11

3.2        Manufacturers’ data .................................................................................................................... 11

    3.2.1 VCA new vehicle emissions database ..................................................................................... 11

    3.2.2 Change in type approval process............................................................................................. 12

3.3        Utility factor ................................................................................................................................. 13

3.4        Independently gathered emissions data ..................................................................................... 14

    3.4.1 Laboratory testing..................................................................................................................... 14

    3.4.2 PHEM simulation data and PEMS data from Emission Analytics ............................................ 15

    3.4.3 RDE measurements using PEMS ............................................................................................ 15

    3.4.4 Remote sensing data ............................................................................................................... 15
4          HDV - Detailed consideration of data available .......................................................16

4.1        Overview ..................................................................................................................................... 16

4.2        Significance of various ultra-low emission HDV in the fleet........................................................ 16

    4.2.1 Dedicated methane fuelled HGV.............................................................................................. 16

    4.2.2 Diesel/methane dual fuelled HGV ............................................................................................ 17

    4.2.3 Battery electric and hydrogen fuelled HGV .............................................................................. 18

    4.2.4 Ultra-low emission buses (hybrids, battery electric, methane and hydrogen) ......................... 18
5          Conclusions ................................................................................................................21

Ricardo – In confidence                                                   Ref: Ricardo/ED11852/ULEV evidence review, Issue 3
SPaTS Task 1-650 – Review of updates to emission
                                           curves for non-conventional ICE and ultra-low emission vehicles | iii

 5.1.1 Recommendations for LDV ...................................................................................................... 21

 5.1.2 Recommendations for HDV ..................................................................................................... 21

5.2    Priorities of recommendations .................................................................................................... 22

Ricardo – In confidence                                         Ref: Ricardo/ED11852/ULEV evidence review, Issue 3
SPaTS Task 1-650 – Review of updates to emission
                                   curves for non-conventional ICE and ultra-low emission vehicles | 1

Glossary of abbreviations
ANPR              Automatic Number Plate Recognition
BEV               Battery Electric Vehicle
CI                Compression Ignition
COPERT            Software tool for calculating pollutant emissions from road transport
DfT               UK Department for Transport
ERMES             European Research on Mobile Emission Sources
EV                Electric Vehicle
FCEV              Fuel Cell Electric Vehicle
GSR               Gas Substitution Rate
HBEFA             HandBook of Emission Factors
HDV               Heavy Duty Vehicle (both HGVs and buses/coaches)
HEV               Hybrid Electric Vehicle
HGV               Heavy Goods Vehicle
ICE               Internal Combustion Engine
ITS Leeds         Institute of Transport Studies at Leeds University
LDV               Light duty vehicle (both passenger cars and LGV, see below)
LGV               Light Goods Vehicle
NAEI              National Atmospheric Emissions Inventory
NTM               National Transport Model
PC                Passenger cars
PEMS              Portable Emissions Monitoring Systems
PHEM              Technical University of Graz’s vehicle and powertrain simulation model
PHEV              Plug-in Hybrid Electric Vehicle
PM                Particulate matter
SI                Spark Ignition
TfL               Transport for London
TRL               Transport Research Laboratory
UF                Utility factor
ULEV              Ultra-Low Emission Vehicle
VCA               Vehicle Certification Agency
VERSIT            Instantaneous traffic emissions model developed by TNO
WebTAG            DfT Web-based Transport Analysis Guidance
WLTC              Worldwide harmonised Light vehicles Test Cycle
WLTP              Worldwide harmonised Light vehicles Test Procedure

Ricardo – In confidence                          Ref: Ricardo/ED11852/ULEV evidence review, Issue 3
SPaTS Task 1-650 – Review of updates to emission
curves for non-conventional ICE and ultra-low emission vehicles | 2
1 Introduction
1.1 Overview
DfT require an update to the speed-emission factor and fuel consumption curves in a specified format
for use in the NTM and WebTAG consistent with the exhaust emission factors in the European COPERT
5 model, now used in the compilation of the UK’s National Atmospheric Emissions Inventory (NAEI) on
behalf of Defra and BEIS (http://naei.beis.gov.uk/) and in national air quality modelling under the MAAQ
contract for Defra. This includes modelling that underpinned the UK’s Plans for reducing roadside
nitrogen dioxide concentrations. The update to these speed-emission curves has been reported
separately.
The updated emission curves provided for the NTM and WebTAG are restricted to vehicles running on
conventional petrol and diesel engines. In this separate project we revisit evidence on speed-emission
curves for non-conventional Internal Combustion Engine (ICE) and other ultra-low emission (ULEV)
vehicles developed by Ricardo in 2015 in a report “Speed emission/energy curves for ultra-low emission
vehicles”. This project comprises a short scoping study that will examine whether there is sufficient
new evidence to merit revisiting and possibly updating the emission curves for these vehicles. The
conclusions from this provides DfT with the basis for a fuller discussion to decide whether an update of
the 2015 curves is appropriate.
1.2 Scope and overview of the methodology
The vehicles and technologies which are covered by the project are shown in Table 1. For each
vehicle/technology type except buses, speed emission/energy curves were previously developed for
fuel or energy use, and CO2, NOx and PM10 emissions.
Table 1 Low Emission Vehicles in scope for this review
Vehicle Type Fuel/Technology Type
Cars Petrol Hybrid Electric Vehicle (Petrol HEV)
Diesel Hybrid Electric Vehicle (Diesel HEV)
Petrol Plug-in Hybrid Electric Vehicle (Petrol PHEV)
Diesel Plug-in Hybrid Electric Vehicle (Diesel PHEV)
Battery Electric Vehicle (BEV)
Fuel Cell Electric Vehicle (FCEV)
Light Goods Vehicles Petrol Hybrid Electric Vehicle
Diesel Hybrid Electric Vehicle
Petrol Plug-in Hybrid Electric Vehicle
Diesel Plug-in Hybrid Electric Vehicle
Battery Electric Vehicle
Fuel Cell Electric Vehicle
Rigid Heavy Goods Vehicles Biomethane/ Natural Gas Vehicle
Dual Fuel Diesel & Biomethane/ Natural Gas Vehicle
Battery Electric Vehicle (3.5t -12t GVW only)
Ricardo – In confidence Ref: Ricardo/ED11852/ULEV evidence review, Issue 3SPaTS Task 1-650 – Review of updates to emission
curves for non-conventional ICE and ultra-low emission vehicles | 3
Vehicle Type Fuel/Technology Type
Articulated Heavy Goods vehicles Biomethane/ Natural Gas Vehicle
Dual Fuel Diesel & Biomethane/ Natural Gas Vehicle
Buses Biomethane/ Natural Gas Vehicle
(not included in the original 2015 Hybrid buses
review) Battery Electric buses
Fuel Cell Electric buses
Buses are a new vehicle type introduced in this study because of their increasing importance, although
they were not within the scope of the 2015 study.
This report starts with a résumé of the data and methodologies used in the earlier 2015 report, using
summary data Tables 5, 6 and 7 of the earlier report. From these a complete list of key data sources
that were used is drawn up, and coloured to highlight those sources where significant new evidence
has become available. The new evidence for these sources is then systematically discussed in the
following chapters with Chapter 3 covering light duty vehicles, and Chapter 4 covering heavy duty
vehicles, including buses.
Ricardo – In confidence Ref: Ricardo/ED11852/ULEV evidence review, Issue 3SPaTS Task 1-650 – Review of updates to emission
curves for non-conventional ICE and ultra-low emission vehicles | 4
2 Résumé of data and method tables used in the
original report
2.1 Overview of the core data sources
For the original study a number of data sources were used to assess, derive and validate the emissions
curves reported. The key data sources cover:
• Existing emissions models
• Manufacturers’ type approval data
• Literature results on real world emissions
• Simulation data using the PHEM model
• PEMS data from vehicle tests in the UK
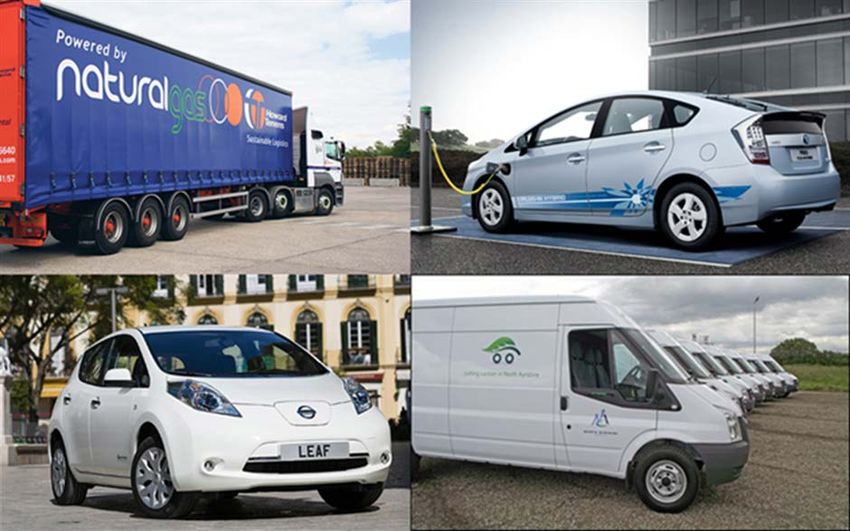
In terms of quantities of data for different vehicle categories, the 2015 study used the speed related
emission factor curves for some ULEV for which there were considerable data, to derive the speed
related emission factor curves for others. Figure 1 below summarises these relationships for light duty
vehicles.
Figure 1 Relationship between data sources and ULEV light duty vehicle categories for curve fitting
Ricardo – In confidence Ref: Ricardo/ED11852/ULEV evidence review, Issue 3SPaTS Task 1-650 – Review of updates to emission
curves for non-conventional ICE and ultra-low emission vehicles | 5
This shows that for LDV the primary data sources were for petrol and diesel HEV and BEV cars. (The
section numbers refer to subsections in the original 2015 report.) In the figure:
• Green cells denote core technologies for which a substantial quantity of emissions data existed
and which comprise the starting data from which other emission factors are extrapolated;
• Red cells denote technologies whose emissions performance was extrapolated from the core
technologies;
• Mustard coloured circles contain key factors/assumptions involved in the extrapolations.
Figure 2 summarises what data sources were used for heavy duty vehicles. (The section numbers refer
to subsections in the original 2015 report.) It shows that for HDV there is much less primary data than
was the case for LDV and curves for BEV vans were used to estimate energy curves for small HGVs.
We cite some studies Ricardo undertook on methane fuelled vehicles for the DfT. The gas substitution
rate (GSR), i.e. the amount of diesel substituted by methane, is the other primary input parameter
determining the emissions from dual fuel diesel/methane HGV.
Figure 2 Relationship between data sources and ULEV heavy duty vehicle categories for curve fitting
Legend: green is new data, mustard is scaling factors, orange are derived emission curves.
In more detail, the following two tables summarise the methodology used to generate the speed related
emission functions for light duty vehicles. An analogous table for HDVs is given in Table 4.
Ricardo – In confidence Ref: Ricardo/ED11852/ULEV evidence review, Issue 3SPaTS Task 1-650 – Review of updates to emission curves for non-conventional ICE and ultra-low emission
vehicles | 6
Table 2 Summary of curve generation for cars (Table 5 of 2015 study)
Petrol HEV Diesel HEV BEV Petrol PHEV Diesel PHEV Fuel Cell EV
NOx
Curve data PHEM data for HEV PEMS data N/A Extrapolated from Extrapolated from N/A
and ICE, normalised COPERT scaling HEV and BEV data HEV and BEV data
to COPERT for Euro 6 using utility factor using utility factor
Validation data PEMS data Manufacturers’ data N/A Manufacturers’ data Manufacturers’ data N/A
Manufacturers’ data
Vehicle categories 1 vehicle size 1 vehicle size N/A 1 vehicle size 1 vehicle size N/A
Euro 5 and 6 Euro 5 and 6 3 utility factors 3 utility factors
Euro 6 Euro 6
PM
Curve data No data, assume No data, assume N/A Extrapolated from Extrapolated from N/A
HEV same as HEV same as HEV and BEV data HEV and BEV data
COPERT ICE COPERT ICE using utility factor using utility factor
Validation data None None N/A Manufacturers’ data Manufacturers’ data N/A
Vehicle categories 1 vehicle size 1 vehicle size N/A 1 vehicle size 1 vehicle size N/A
Euro 5 and 6 Euro 5 and 6 3 utility factors 3 utility factors
Euro 6 Euro 6
CO2/Energy
Curve data PHEM data for HEV PEMS data PHEM data Extrapolated from Extrapolated from Extrapolated from BEV
and ICE, normalised TRL data for Single speed curve HEV and BEV data HEV and BEV data using H2 conversion
to TRL factors scaling to Euro 6 using utility factor using utility factor factor based on
manufactures data.
Validation data PEMS data Manufacturers’ data Manufacturers’ Manufacturers’ data Manufacturers’ data None
Manufacturers’ data data
Vehicle categories 3 vehicle sizes, 1 vehicle size 3 vehicle sizes, 3 vehicle sizes 3 vehicle sizes 1 vehicle size
same as COPERT Euro 5 and 6 scaled based on related to HEV/BEV related to BEV sizes
Euro 5 and 6 mass sizes 3 utility factors
3 utility factors Euro 6
Euro 6
Ricardo – In confidence Ref: Ricardo/ED11852/ULEV evidence review, Issue 3SPaTS Task 1-650 – Review of updates to emission curves for non-conventional ICE and ultra-low emission
vehicles | 7
Table 3 Summary of curve generation for vans (Table 6 of 2015 study)
Petrol HEV Diesel HEV BEV Petrol PHEV Diesel PHEV Fuel cell EV
NOx
Curve data Same as car petrol Scaled to diesel car N/A Same as car petrol Extrapolated from N/A
HEV using same ratio as PHEV HEV and BEV data
ICE diesel to van using utility factor
from TRL data
Validation data None None N/A None None N/A
Vehicle categories 1 size 3 sizes N/A 1 size 3 sizes N/A
Euro 6 Euro 6 3 utility factors 3 utility factors
Euro 6 Euro 6
PM
Curve data Same as car petrol Scaled to diesel car N/A Same as car petrol Extrapolated from N/A
HEV using same ratio as PHEV HEV and BEV data
ICE diesel to van using utility factor
from TRL data
Validation data None None N/A None None N/A
Vehicle categories 1 size 3 sizes N/A 1 size 3 sizes N/A
Euro 6 Euro 6 3 utility factors 3 utility factors
Euro 6 Euro 6
CO2/Energy
Curve data Same as car petrol Scaled to diesel car Scaled to car HEV Same as car petrol Extrapolated from Extrapolated from
HEV using same ratio as by weight PHEV HEV and BEV data BEV using H2
ICE diesel to van using utility factor conversion factor
from TRL data based on
manufactures data
Validation data None None Manufacturers’ None None None
data
Vehicle categories 1 size 3 sizes 3 sizes 1 size 3 sizes 3 sizes
Euro 6 Euro 6 3 utility factors 3 utility factors
Euro 6 Euro 6
Ricardo – In confidence Ref: Ricardo/ED11852/ULEV evidence review, Issue 3SPaTS Task 1-650 – Review of updates to emission curves for non-conventional ICE and ultra-low emission
vehicles | 8
Table 4 Summary curve generation for HGVs (Table 7 of 2015 study)
Dedicated gas-fuelled rigid Dedicated gas-fuelled artic Dual fuel rigid HGV Dual fuel artic HGV Electric rigid HGV
HGV HGV
NOx
Curve data Test data from DfT Extrapolate from Infer from test data from Infer from test data from N/A
Methane slip project dedicated rigid HGV DfT methane slip project DfT methane slip project
and low carbon truck trial and low carbon truck trial
Validation data Existing Ricardo-AEA non- Existing Ricardo-AEA non- Literature Literature N/A
speed dependent speed dependent
emission factors emission factors
Vehicle categories 2 rigid truck GVWs Single articulated truck 2 rigid truck GVW 2 rigid truck GVW N/A
Euro V and Euro VI GVW Euro V and Euro VI Euro V and Euro VI
Euro V and Euro VI
PM
Curve data Existing Ricardo-AEA non- Extrapolate from Same as existing ICE Same as existing ICE N/A
speed dependent dedicated rigid HGV diesel curve diesel curve
emission factors
Validation data None Existing Ricardo-AEA non- Literature Literature N/A
speed dependent
emission factors
Vehicle categories 2 rigid truck GVWs Single articulated truck 2 rigid truck GVW 2 rigid truck GVW N/A
Euro V and Euro VI GVW Euro V and Euro VI Euro V and Euro VI
Euro V and Euro VI
CO2/Energy
Curve data Test data from DfT Extrapolate from Infer from test data from Infer from test data from Extrapolate from Class 3
Methane slip project dedicated rigid HGV DfT methane slip project DfT methane slip project BEV van
and low carbon truck trial and low carbon truck trial
Validation data Existing Ricardo-AEA non- Existing Ricardo-AEA non- Literature Literature Literature
speed dependent speed dependent
emission factors emission factors
Vehicle categories 2 rigid truck GVWs Single articulated truck 2 rigid truck GVW Single articulated truck 2 rigid truck GVWs
GVW GVW
Ricardo – In confidence Ref: Ricardo/ED11852/ULEV evidence review, Issue 3SPaTS Task 1-650 – Review of updates to emission
curves for non-conventional ICE and ultra-low emission vehicles | 9
2.2 Summary of key data sources used
For the original study the key data sources used to assess, derive and validate the emissions curves
reported are summarised in Table 5. The right-hand column indicates where new data are available in
relation to each data source since the 2015 study was undertaken.
Table 5 Key data sources used to assess, derive and validate the emissions curves in the 2015 study
For light duty vehicles
Data type Data source Availability of new
data
COPERT 4 (v10/11) Moderate new data
Handbook of Emission Factors (HB EFA) v3.1 Revised
Models Passenger and Heavy duty Emissions Model No new data
(PHEM
Other hybrid vehicle simulation models Moderate new data
VCA new car CO2 and emissions database Much new data
Manufacturers data
PEMS measurements including for RDE Much new data
Utility Factor Much new data
TRL factors No new data
Other studies
Quantification of real driving emissions (RDE) Much new data
Independently gathered emissions data Much new data 1
For heavy duty vehicles
Data type Data source Availability of new
data
Research studies DfT Methane slip test data No new data
Existing Ricardo non-speed dependent emission Revised
factors
Dedicated rigid HGV PM & NOx emission factors Revised
Low carbon truck trial Moderate new data
Literature Moderate new data
1
These data include real driving emissions testing and remote sensing
Ricardo – In confidence Ref: Ricardo/ED11852/ULEV evidence review, Issue 3SPaTS Task 1-650 – Review of updates to emission
curves for non-conventional ICE and ultra-low emission vehicles | 10
3 LDV - Detailed consideration of data available
3.1 Emission models
3.1.1 COPERT
The 2015 study used COPERT 4 (v10/11) for normalising or scaling NOx and PM emissions rates from
petrol and diesel hybrid vehicles available from other sources. These emissions curves were then used
to derive analogous emission factors for hybrid light commercial vehicles and for plug-in versions of
both car and van PHEVs (see Figure 1).
The COPERT road transport hot emission factors database is available as an Excel file. The latest
version is COPERT version 5.2.0, which was published in August 2018 2. The only LDV ULEV category
in Table 1 for which emission factors are available are petrol HEVs (as was the case for the earlier
review). However, emission factors for NOx for these hybrids are likely to have been changed.
The “EMISIA SA COPERT Versions” site lists the following changes between since COPERT 4 (v10/11)
that are pertinent to this study 3:
COPERT Version Publication date Updates pertinent to this study
New PC Euro 6 2020+ and LDV Euro 6 2021+ vehicle
category
Updated NOx emission factors for PC Diesel & LDV
COPERT v 4.11.4 September 2016 Diesel, Euro6 and on.
PC Diesel post Euro 6
LDV Diesel post Euro 5
COPERT v 5.0.1039 September 2016 Updated NOx emission factors for PC Diesel & LDV
Diesel, Euro 6 and on.
COPERT v 5.0.1067 October 2016 Corrected NOx hot emission parameters for PC Diesel
Medium
COPERT v 5.2.0 August 2018 Little change pertinent to this study
The 2013 guidebook (which gives the emission factors for hybrids used in COPERT 4 (v10) gives
emission factors for a single vehicle category (hybrid petrol passenger cars < 1.6 litres) and gives NOx
emissions for urban, rural and highway roads. Examination of the COPERT 5.2 emission factors
indicates that there are 52 vehicle categories (Euro standard, vehicle type, fuel technology) and speed
functions are expressed as a polynomial for, amongst other species, NOx and fuel/energy consumption.
2
COPERT Emission Factor database available from: https://www.eea.europa.eu/publications/emep-eea-guidebook-2016/part-b-sectoral-
guidance-chapters/1-energy/1-a-combustion/1-a-3-b-i-1/view
3
For details of changes to COPERT see the site: https://www.emisia.com/utilities/copert/versions/
Ricardo – In confidence Ref: Ricardo/ED11852/ULEV evidence review, Issue 3SPaTS Task 1-650 – Review of updates to emission
curves for non-conventional ICE and ultra-low emission vehicles | 11
However, although there are a large number of vehicle categories listed, many of the coefficients are
the same, i.e. the same polynomial emission factors cover a range of vehicle categories.
Notwithstanding, it is clear that the COPERT factors for HEVs have been updated.
In their list of future plans, EMISIA say the next expected update is due in December 2018, and among
the planned changes are “an update of alternatively fuelled vehicles (LPG, CNG, hybrids, electric).
However, this update has not yet happened (as of February 2019)
3.1.2 Swiss-German-Austrian Handbook of Emission Factors (HBEFA)
The 2015 study used some data from the Swiss-German-Austrian Handbook of Emission Factors
(HBEFA 3.1). The current version was updated to HBEFA 3.3 on 25th April 2017.
3.1.3 PHEM and other Vehicle simulation models
The NOx, PM and CO2/energy emission curves for petrol HEVs in the 2015 study were generated from
a petrol HEV PHEM model run specifically for the project. This has not been added to.
However, more sophisticated HEV models have been developed. For example, Ricardo have an HEV
vehicle simulator. Recent research activities have developed and validated this model.
Also, another key model from the ERMES (European Research on Mobile Emissions) group is TNO’s
VERSIT+ model.
3.2 Manufacturers’ data
3.2.1 VCA new vehicle emissions database
The 2015 study used the 2013 VCA database of car fuel and CO2 emissions data. The latest version of
this database now available was published in August 2017 (no 2018 data are available yet). The
numbers of the different ULEV vehicle categories in the databases are summarised in Table 6.
Table 6: Vehicles categorised by fuel type and technology
Data available in Data available in Change
2013 database 2017 database
Passenger cars
Petrol HEV 22 models 82 models + 270%
Petrol PHEV 6 models 45 models + 650%
Diesel HEV 6 models 3 models - 50% Peugeot & Citroen models no
longer available
Diesel PHEV 1 model 3 models + 300%
EVs 12 models 30 models + 150%
Vans
Petrol HEV None None
Petrol PHEV None 1 model
Diesel HEV few None
Diesel PHEV None None
EVs 13 models 4 models
Ricardo – In confidence Ref: Ricardo/ED11852/ULEV evidence review, Issue 3SPaTS Task 1-650 – Review of updates to emission
curves for non-conventional ICE and ultra-low emission vehicles | 12
Large increases in the numbers of available petrol HEV and PHEV, and of BEV models have occurred.
However, not only do there remain very few diesel HEV and PHEV in the database, but the numbers of
available models have reduced. This leads to the important recommendation that hybrid diesel
vehicles should be de-emphasised, and arguably should be removed from the emission factors
supplied because fleet numbers will be minimal.
For the petrol HEV and PHEV, their type approval CO2 values are in the public domain and could be
analysed to obtain current/updates average emissions over the whole regulatory cycle. The data
therefore does not provide speed related information but could be used to update/ scale the previously
derived curves.
It is noted that no analogous 2018 database has yet been published. In part this may be caused by
changes in the light duty type approval process.
3.2.2 Change in type approval process
At the time of the 2015 study the VCA published two sets of data because light duty vehicles could be
type approved to meet either Euro 5 or Euro 6b emissions standards. The driving cycle for both these
emission standards was the NEDC.
More recently new emissions standards have come into force, as summarised below for passenger
cars and N1 Class 1 vans. Implementation dates for large N1 vans, Classes 2 and 3 are 12 months
later.
Implementation PM and NOx emission Driving Other Implications for
date standards cycle changes emission factors+
1/9/2015 All vehicles to meet Euro 6b NEDC Baseline values
1/9/2017 All new models cars and N1 class WLTP RDE becomes Certification CO2
1 vans to meet Euro 6d-Temp mandatory figures will change
1/9/2018 All vehicles registered to be type NEDC Baseline values
approved to Euro 6c
1/9/2019 All vehicles registered to be type WLTC RDE becomes Certification CO2
approved to Euro 6d-Temp mandatory figures will change
even for old models
The NEDC comprises two driven components and data for a whole vehicle type were given for the two
phases, and for their distance weighted average.
Vehicle certification using WLTP involves four driven components, and each vehicle registered will be
given its own CO2 emission factor averaged over the whole WLTC, calculated from the vehicle’s
configuration (based on its weight, tyres fitted, air drag) and extrapolated from the extremes for the
vehicle’s type approval family.
It is not known how VCA will report these data.
For the annual monitoring of CO2 emissions from passenger cars (and vans) undertaken by the EEA,
the database from vehicle registrations is changing from grouping vehicle registrations according to
their “type” and recording how many of each vehicle type were registered, to recording individually each
vehicle registered.
Ricardo – In confidence Ref: Ricardo/ED11852/ULEV evidence review, Issue 3SPaTS Task 1-650 – Review of updates to emission
curves for non-conventional ICE and ultra-low emission vehicles | 13
The reporting of “Vehicles registered in 2015: final data 4” comprises around 440,000 rows of data and
is a 73 MB uncompressed file. For the 2017 data, vehicles are registered following certification using
the NEDC and WLTP regulations. The 2017 provisional data (volume 15 of the series) is 1,700 MB
uncompressed file that will not load into Excel because it contains more than 1,000,000 rows of data.
(It is estimated to contain around 6 million rows of data. The number of columns has also been
expanded to include key WLTP certification data, e.g. vehicle family identification number and WLTP
test mass (rather than mass in running order) and CO2 emissions measured over the WLTC.
Communications with the EEA indicate that for the 2019 database, where all registrations are recorded
using the WLTP regulation, the database will comprise around 15 million rows of data.
Therefore, relative to the 2015 study, vehicle certification recording of the Type 1 test of WLTP is
generating much new data on CO2 emissions/energy consumption. This will include test data for HEV
and PHEV models, over the WLTP, that were not previously available. However, it may not be trivial
to extract these data and use it to develop new speed-emission curves.
3.3 Utility factor
For PHEVs their driving can be sub-divided into the fraction driven using mains derived electricity, for
which there are no tailpipe emissions, but there is an electric energy requirement, and the fraction where
the vehicle behaves like a conventional hybrid vehicle. The utility factor (UF) weights the consumption
in each driving mode according to a modelled consumer behaviour that is based on travel survey data.
Widely used standardized methods are the European ECE R101 method and the US SAE J2841
method. The emission factor curves reported in the 2015 study came from the weighting of these two
emission factor curves using this function, shown in Figure 3.
EC regulations and the VCA use a very simple UF calculated as follows:
UF = electric range/(electric range +25km)
This gives the simple curve shown in Figure 3 where the proportion of electric only operation increases
as the electric range increases.
Since 2015 further evidence has been amassed on the “real world” ratio of the driving using the two
modes. The Miles Consultancy has been highlighting discrepancies between the VCA figure and the
real world performance of some PHEVs. This was also reported by LowCVP, and made the UK national
headlines in November 2018 5. In extreme cases this involved PHEVs that were never charged with
mains electricity.
Two suggested alternatives have been provided by (chronologically) the International Council on Clean
Transportation, and the Joint Research Council of the European Commission 6. The latter paper is
entitled: ““Alternative utility factor versus the SAE J2841 standard method for PHEV and BEV
applications” was published on 30th September 2018, and is available in the journal Transport Policy.
4
This is in the EEA Report: “Monitoring of CO2 emissions from passenger cars:Data 2015: final data (Volume 12 in this series of reports)
5
Original story available from Miles Consultancy blog https://themilesconsultancy.com/new-analysis-plug-hybrid-car-mpg-emissions-expected-
spark-debate-suitability-fleet-operation/ with further highlighting by LowCVP https://www.lowcvp.org.uk/news,fleet-operator-consultancy-
finds-plugin-hybrid-vehicles-are-not-efficient-for-all-types-of-operation_3706.htm, and then BBC news
https://www.bbc.co.uk/news/business-46152853?intlink_from_url=https://www.bbc.co.uk/news/topics/cljev49lzr4t/electric-
cars&link_location=live-reporting-story
6
ICCT paper available from: https://www.theicct.org/sites/default/files/publications/EU-PHEV_ICCT-Briefing-Paper_280717_vF.pdf , and EC JRC
paper study published in Transport Policy, 68, (2018) 80 – 97.
Ricardo – In confidence Ref: Ricardo/ED11852/ULEV evidence review, Issue 3SPaTS Task 1-650 – Review of updates to emission
curves for non-conventional ICE and ultra-low emission vehicles | 14
Figure 3 Utility factors as a function of electric range
100%
90%
80%
BMW i3 PHEV
70%
60%
Utility factor
Current market average
50%
40%
30%
20%
Prius, PHEV
10%
0%
0 20 40 60 80 100 120 140 160 180 200
Electric range, km
This new evidence and these considerations make a strong case for reviewing the nature of this
function. This would impact the emissions curves for all PHEVs (diesel and petrol, both cars and vans).
3.4 Independently gathered emissions data
Measurement studies
There are three types of measurement studies that have been carried out:
• Laboratory tests using a chassis dynamometer and real world drive cycles, which is the
traditional testing approach;
• Portable Emissions Monitoring Systems (PEMS) where emissions tests are carried out on
vehicles in real traffic situations;
• Remote sensing data that uses a static beam projected across a road to analyse tailpipe
emissions from passing vehicles.
3.4.1 Laboratory testing
These are chassis dynamometer tests using full emissions characterisation. The changes in light duty
vehicle type approval processes have meant much recent laboratory emissions testing has been
undertaken. Communications with test houses indicate they are over-subscribed with demands for their
services outstripping supply. Therefore, there will be much recent laboratory testing undertaken,
including for the new ULEV vehicles, as highlighted in Table 6.
A key question for generating emissions curves for ULEVs is its accessibility. It is anticipated that
anonymised data, in terms of the modal emissions from the chassis dynamometer tests, of ULEVs with
Ricardo – In confidence Ref: Ricardo/ED11852/ULEV evidence review, Issue 3SPaTS Task 1-650 – Review of updates to emission
curves for non-conventional ICE and ultra-low emission vehicles | 15
representative emissions over the whole cycle, could be obtained and analysed to generate updated
emissions curves. (This would need to be done in such a way so as to maintain client confidentiality.)
3.4.2 PHEM simulation data and PEMS data from Emission Analytics
These were important sources of data for the original, 2015 study. However, no new data have
been purchased nor analysed since that study.
3.4.3 RDE measurements using PEMS
PEMS data are collected on vehicles operating in real traffic on the road. Whilst they are less repeatable
than laboratory tests and will have less detail in terms of emissions monitored, they are a very useful
source of data indicating what the performance of technologies might be on the road.
The changes in light duty vehicles type approval regulations (Section 3.2.2), and specifically the
introduction of Euro 6d-temp mandates the augmenting of the traditional chassis dynamometer testing
(the Type 1 emissions test) with real driving emissions (RDE). Implementation dates are 1/9/2017 for
new models and for all new passenger cars and N1 Class 1 vans such testing will be required from
1/9/2019. The regulations specify that the on-the-road driving emissions should be measured on a
second-by-second basis, using PEMS (that meet various accuracy and precision specifications).
The important consequence for this work is that much more modal emissions data are being collected
from ULEVs. Also, the regulations require that such data are publicly available. This provides a rich
source of new data from which speed related emission factors for NOx can be derived. However, further
work would need to be carried out to establish exactly what data on ULEVs are available and how this
data could be used to generate new emission curves.
3.4.4 Remote sensing data
Remote sensing allows the collection of emissions data from vehicles as they pass a fixed monitoring
point on a road. It is effectively a snap shot of emissions at one location and is matched with automatic
number plate recognition (ANPR) data to link emissions to vehicles. It is a good way of collecting
emission data from a very large sample of vehicles, albeit under one traffic situation, and is being used
to characterise emissions from local traffic. A disadvantage of the technique is that it does not measure
absolute emission factors, but ratios in pollutant emissions relative to CO2. However, since CO2
emission factors are relatively well understood, the technique provides a useful way of showing the
range of factors for a given technology and comparing real world pollutant emissions for a range of
technologies under a given traffic situation. Some studies have been used to show the ratio in NO2/NOx
emissions for different technologies, potentially useful for this project.
The 2015 study discussed a number of studies using this approach undertaken by Kings College in
London and the Institute of Transport Studies at Leeds University (ITS Leeds). Within these studies a
few LEV’s were captured and provide a small but useful snapshot of the emissions of these vehicles
operating on the road.
Since the 2015 study Ricardo Energy & Environment have been undertaking remote sensing
measurements using the AccuScan RSD 5000 system provided to Ricardo by OPUS RSE. In total over
350,000 measurements have been made. This includes around 100,000 valid vehicle emissions
measurements in London as part of The Real Urban Emissions Initiative (TRUE) which seeks to supply
cities with data regarding the real-world emissions of their car fleets and equip them with technical
information that can be used for strategic decision-making. The TRUE initiative was established by the
International Council on Clean Transportation along with the FIA Foundation, Global NCAP, Emissions
Analytics, Transport and Environment and the C40 Cities. The database includes emissions from
hybrids, and potentially PHEVs and would be available for Ricardo to use to develop or adjust existing
emission curves for these vehicle types. Its analysis could provide comparative emissions data, e.g.
comparing emissions from Euro 6b petrol hybrids with their non-hybrid counterparts.
Ricardo – In confidence Ref: Ricardo/ED11852/ULEV evidence review, Issue 3SPaTS Task 1-650 – Review of updates to emission
curves for non-conventional ICE and ultra-low emission vehicles | 16
4 HDV - Detailed consideration of data available
4.1 Overview
Vehicle categories for which speed related emission functions were generated in the 2015 study are
given in Table 1. This is expanded in Table 5 where the availability of new data sources is reviewed in
the final column. Generally, whilst some new data have become available there have not been major
studies adding to this. So for HDV, this review of evidential data available for generating emission factor
curves is structured by considering the ultra-low emission HDV available in the current fleet. This
defines the potential need for such curves. The subsections below give further details on a vehicle
category by vehicle category basis.
Because some ULEV vehicle categories, i.e. buses, are now more widely in service, even though they
were not considered in the earlier study, Table 7 is expanded to include them.
Table 7 HGV technology categories
Vehicle fuel Vehicle type Emission-curves that were generated in
2015 study
Trucks
Dedicated methane Rigid 16 and 26 t CO2, NOx and PM
Articulated CO2, NOx and PM
Diesel/methane dual fuel Rigid 16 and 26 t CO2, NOx and PM
Articulated CO2, NOx and PM
Battery electric truck Rigid 3.5 – 7.5 t Energy
Rigid 7.5 – 12 t Energy
Buses
Hybrid City buses Not included in earlier study
Dedicated methane City buses Not included in earlier study
Battery electric buses City buses Not included in earlier study
Fuel cell buses City buses Not included in earlier study
4.2 Significance of various ultra-low emission HDV in the fleet
4.2.1 Dedicated methane fuelled HGV
A LowCVP study on the “Emissions testing of Gas Powered Commercial Vehicles”, has been completed
and published in January 2017. The overall view of this study, and consultation with the relatively
recently formed LowCVP's Commercial Vehicle Working Group, recommends that the Government:
“should continue to support the development of gas vehicle infrastructure and gas-powered vehicles,
Ricardo – In confidence Ref: Ricardo/ED11852/ULEV evidence review, Issue 3SPaTS Task 1-650 – Review of updates to emission
curves for non-conventional ICE and ultra-low emission vehicles | 17
particularly dedicated gas, while increasing the supply of low carbon/renewable methane as a
sustainable transport fuel in order to realize these benefits.” 7
This study does contain some emissions data which are available to Ricardo and could be added to the
evidence base included in the generation of emission curves.
In terms of penetration into the fleet, unlike diesel/methane dual fuelled HGV, see the section below,
where penetration into the fleet has stalled/reversed, dedicated methane fuelled HGV continue to be
seen as viable. There are large commercial attractions because of the differential in tax between the
fuel duty on diesel and methane (around £0.40 per taxed unit when VAT is included).
Iveco, who claim to be the methane engine leaders and Scania have both relatively recently announced
13 litre dedicated methane engines, of 345 kW and 300 kW peak power, respectively 8
In addition to the largest power units described above, smaller dedicated methane fuelled engines
appropriate to powering buses are being manufactured. These are considered in further detail in sub-
section 4.2.4.
4.2.2 Diesel/methane dual fuelled HGV
Dual fuel methane/diesel vehicles retain the existing diesel compression ignition (CI) engine but run
using a combination of diesel and methane gas fuels. The diesel provides the ignition source because
it auto-ignites, but some (to most) of the power stroke’s energy comes from the combustion of methane.
The amount of diesel substituted by methane is called the gas substitution ratio (GSR) and depends on
the duty cycle of the vehicle. The need to have some diesel present to provide the ignition source means
that under low power conditions little gas is used. Overall the emissions of dual fuel methane/diesel
vehicles are much more similar to their diesel counterparts than the dedicated SI methane vehicles
discussed above.
The attraction of dual fuel vehicles is that the basic engine remains unaltered, and in the absence of
methane refuelling infrastructure, the vehicle can revert to being a standard diesel vehicle. The principal
challenge is adjusting the methane fuelling over the engine’s operational envelop to ensure drivability,
but at the same time to meet the Euro VI emission standards, including limits on methane slip for dual
fuel vehicles.
For dual fuel vehicles, in 2015 there had been very little data. However, data generated by the Low
Carbon Truck Demonstration Trial and a LowCVP project on the “Emissions testing of Gas Powered
Commercial Vehicles, has since been published. However, most of the vehicles studies were Euro V
compliant after-market conversions.
Summarising the key features about the diesel/methane dual fuelled trucks are:
• Most diesel/methane dual fuelled trucks that have been placed on the road were aftermarket
conversions;
• The two largest companies involved were Clean Air Power, and Hardstaffs;
7
See LowCVP report on “Emissions testing of gas-powered commercial vehicles”, study for DfT, published January 2017, available from
https://assets.publishing.service.gov.uk/government/uploads/system/uploads/attachment_data/file/581859/emissions-testing-of-gas-
powered-commercial-vehicles.pdf
8
See, for example https://www.iveco.com/uk/products/pages/gas-engine-stralis-natural-power-truck.aspx and
https://www.scania.com/global/en/home/experience-scania/news-and-events/events/2017/latest-gas-engine-designed-for-long-distance-
transport.html
Ricardo – In confidence Ref: Ricardo/ED11852/ULEV evidence review, Issue 3SPaTS Task 1-650 – Review of updates to emission
curves for non-conventional ICE and ultra-low emission vehicles | 18
• Clean Air Power went into voluntary liquidation in Sept 2015, and was sold to Vayon Holdings
Ltd;
• Harstaff too were bought by Vayon Holdings Ltd in Sept 2015;
• Vayon closed Clean Air Power https://www.greencarcongress.com/2016/04/20160405-
vayoncap.html ;
• Vayon Hardstaffs creditors meeting occurred in Nov 2016 as Hardstaffs too ceased trading:
https://www.thegazette.co.uk/notice/2638898.
Consequently, the principal suppliers of dual fuel vehicles have ceased trading since 2015. There are
other companies who undertake aftermarket conversions, modifying pure diesel engines to be dual
fuelled (e.g. Prins and G-Volution) but our research has not indicated there are any vehicles that meet
Euro VI emissions standards on the market.
With regards to vehicle OEMs, rather than aftermarket conversions, Volvo do appear to have a product 9.
The overall conclusion from this review of evidence regarding diesel/methane dual fuel trucks is that
these vehicles are not being used in significant numbers, and there is no clear route to market, so
currently there is no reason to seek to update the emission curves.
Similarly, it is also noted that there do not appear to be diesel/methane dual fuel buses, and so there is
no recommendation that emission curves are generated for this vehicle category.
4.2.3 Battery electric and hydrogen fuelled HGV
We are not aware of major significant additional data becoming available for this group of ULEV trucks.
Moreover, DfT’s “Road to zero” report summarises the current position in its appendices, stating that
for both 18 tonne HGV (Figure A4) and 44 tonne HGV (Figure A5) “Electric and hydrogen trucks are
not yet market ready, but would offer the most significant GHG and pollutant emission reductions.”.
Therefore, at present it is not suggested that energy consumption (or emissions) data are estimated
from available evidence as an immediate priority.
4.2.4 Ultra-low emission buses (hybrids, battery electric, methane and hydrogen)
DfT statistics (December 2017) indicate there are around 40,300 buses and coaches in Great Britain,
with around 35,000 in England 10. This is shown in Figure 4. Around 10,150 of these are in London
(25.2% of the overall total, and 29% of the English total). The DfT statistics do not publish data on the
powertrains used for these vehicles.
9
Information on Volvo dual fuel product from https://dieselnet.com/news/2017/10volvo.php
10
DfT bus statistics taken from https://assets.publishing.service.gov.uk/government/uploads/system/uploads/attachment_data/file/666759/annual-
bus-statistics-year-ending-march-2017.pdf with further detailed analysis coming from https://www.gov.uk/government/statistical-data-
sets/bus06-vehicle-stocks-technology-and-equipment#table-bus0602
Ricardo – In confidence Ref: Ricardo/ED11852/ULEV evidence review, Issue 3SPaTS Task 1-650 – Review of updates to emission
curves for non-conventional ICE and ultra-low emission vehicles | 19
Figure 4 Numbers of buses and coaches in Great Britain
Scotland and
Wales, 13.2%
London,
25.2%
English non- English
metropolitan metropolitan
areas, 39.1% areas, 22.6%
Transport for London (TfL) operate around 9,550 of London’s buses. The powertrain of these include
hybrids, electrics and 8 hydrogen buses, see Figure 5 11. This shows how around 30% are hybrid buses,
and electric buses are approaching 1% of the fleet. The NAEI already uses data provided by TfL on
the proportions of hybrid buses in the fleet and the reductions in emissions they lead to relative to
conventional diesel buses. These are based on emissions measured over a London bus test cycle.
TfL do not operate any methane fuelled buses.
However, a brief survey of the literature indicates that other operators and areas are increasingly using
ULEV buses. Specific examples include:
• One of the UK’s biggest national bus operators, Arriva, has invested in a new fleet of 174 hybrid
buses, with the help of grants from OLEV, the government’s Office for Low Emission Vehicles 12.
• Both Merseytravel and Transport for London were beneficiaries under the £30 million Low
Emission Bus Scheme, allowing 123 of the new Volvo diesel-electric hybrid buses to enter
service in London, while a further 51 will operate on selected routes around Merseyside12.
• Oxford bus company have recently added 14 brand new hybrid buses which are the very first
of a new design by Alexander Dennis (who built the bodies for the 200-series Scanias). They
are the first “Euro VI” buses for service in Oxford, and also the first roll-out of the Gyrodrive
hybrid power system. (Williams engineering KERS system). This takes the number of hybrids
in the Oxford Bus Company’s fleet to 83 out of a fleet of 182 buses and coaches (45.6%) 13.
11
Data taken from 2017 source: https://data.london.gov.uk/dataset/number-buses-type-bus-london Non-corroborated data indicates that current
non-conventional powertrain fraction has continued to increase
12
See SMMT announcement: https://www.smmt.co.uk/2017/01/major-uk-operator-invests-in-new-hybrid-bus-fleet/
13
For announcement about latest additions to Oxford Bus Company’s fleet see https://www.oxfordbus.co.uk/hybrids/. Statistics taken from
October 2018 fleet list, downloaded from
https://assets.goaheadbus.com/media/cms_page_media/72/Oxford%20Bus%20Group%20Current%20Fleet%20List.pdf
Ricardo – In confidence Ref: Ricardo/ED11852/ULEV evidence review, Issue 3SPaTS Task 1-650 – Review of updates to emission
curves for non-conventional ICE and ultra-low emission vehicles | 20
Figure 5 Powertrain types for TfL's buses in London
Hybrid
30.60%
Electric
0.76%
Conventional Hydrogen
68.53% 0.10%
Scope in terms of
• The other major operator in Oxford city, Stagecoach, has a lower percentage of hybrids,
although that is in the context of a larger fraction of their fleet being coaches that shuttle
between Oxford and London 14.
• Reading has adopted a different approach with over half its fleet being ULEV buses, including
31 hybrid buses, and 57 methane fuelled vehicles. These are more than half their total fleet of
168 buses 15. Bids for the provision of methane fuelled buses came from Scania and MAN –
indicating companies with commercially available methane buses at the time of tendering.
The above references emphasise the importance of ULEV buses in terms of their penetration into the
fleet. Combined with these rapid increases in numbers, there has been a rapid collection of data
regarding their use. TfL in particular have invested considerable resources into quantifying the
environmental impact of the bus powertrain options they use. Detailed measurement campaigns,
principally undertaken in collaboration with the VTEC facility at Millbrook Proving Ground, and published
high level overviews 16. Another example are case studies published following the introduction of new
vehicles (e.g. Reading indicating that their methane fuelled buses lead to a 30 – 50% reduction in NOx
emissions relative to comparable diesel technologies) 17. Together these indicate that there is already
a strong body of emissions evidence that is available on which emissions curves could be based.
Conversations with these operators indicate that they are willing to share, up to a point, data that could
be used to generate new emission curves, which, at the same time, promotes their use of these ULEVs.
Further avenues for potentially acquiring data include LowCVP’s Bus Working Group, and the OLEV
Low Emission Bus scheme where £30 million has been allocated to low emission buses. As for chassis
laboratory testing of LDVs, provided that customer confidentiality is preserved, recently collected data
could be used for generating new emission curves for these important ULEVs that operate in urban
areas.
14
For Stagecoach’s Oxford fleet list see: http://www.ukbuses.co.uk/fleet/stagecoachoxfordshire.pdf
15
Data taken from Reading Buses website: https://www.reading-buses.co.uk/about-us
16
See for example a presentation by F Coyle on “Cutting carbon from the London bus fleet”,
https://www.lowcvp.org.uk/assets/presentations/Transport%20for%20London%20-%20Finn%20Coyle.pdf
17
See for example http://www.clean-fleets.eu/fileadmin/files/documents/Publications/Reading_CleanFleets_CaseStudy.pdf
Ricardo – In confidence Ref: Ricardo/ED11852/ULEV evidence review, Issue 3SPaTS Task 1-650 – Review of updates to emission
curves for non-conventional ICE and ultra-low emission vehicles | 21
5 Conclusions
In this project we revisit the evidence used to develop speed-emission curves for non-conventional
Internal Combustion Engine (ICE) vehicles, completed by Ricardo in 2015 in a report to DfT “Speed
emission/energy curves for ultra-low emission vehicles”. This project comprises a short scoping study
that examines whether there is sufficient new evidence to merit revisiting and possibly updating the
emission curves for these vehicles.
5.1.1 Recommendations for LDV
Key sources of data, and how they have changed since the 2015 published study, are summarised in
Table 5. The recommendation regarding what could be undertaken, based on this analysis, is:
1. Revisiting the CO2 emissions/energy consumption based on most recent data within VCA new
car CO2 database for petrol and diesel HEV and BEV passenger cars. (foundational data as
shown in Figure 1). This data is in the public domain and whilst it does not provide speed
related information, it could be used to update/ scale the previously derived curves.
2. Potentially augmenting/checking conclusions from 1 (above) by assessing what data is
available within the annual monitoring of CO2 emissions from passenger cars (and vans)
published by the EEA, using the new WLTP reporting format. Like the VCA data, this data is
in the public domain but the format of the information has changes markedly, and it is somewhat
unknown as to what data can be extracted and analysed.
3. Revisiting the “utility factors” used to obtain emission curves from PHEVs (both cars and vans)
from HEV curves based on information from JRC. This is based on public domain research
papers, i.e. is accessible information.
4. Remote sensing – examination of new Ricardo Energy & Environment database, especially for
validation of NOx emissions curves for light duty ULEVs. Because these are our data they are
accessible.
5. Investigating the accessibility of data gathered for “Real driving emissions” testing, with
emissions monitored by PEMS. A potentially rich source of new modal data. However, it is not
known how accessible these data may be.
6. Checking whether emission factors within COPERT 5.2.0 for ULEV categories have changed
markedly for PM, NOx or energy from those use from COPERT 4 (v10/11). This, like the
following item, is based on public domain information and emission factors.
7. Keeping a watching brief on next release of COPERT because indications are an update “of
alternatively fuelled vehicles (LPG, CNG, hybrids, electric)” is planned.
8. De-emphasising the importance of diesel HEV and PHEV (and arguably removing these vehicle
categories from the emission factors supplied because fleet numbers will be minimal).
Additional recommendations are the consideration of the disaggregating of petrol HEV into different
powertrain architectures – e.g. parallel and series HEV. This is because the different powertrain types
(e.g. the Electric London taxi, and BMW i3 series hybrids may well have markedly different emission
curves relative to parallel hybrids, e.g. from Toyota and Lexus.
5.1.2 Recommendations for HDV
For heavy duty vehicles, the details of Chapter 4 lead to the following two key recommendations:
a) Dual fuel vehicles should be de-emphasised – since anticipated future vehicle numbers are
expected to be very low;
b) ULEV buses should be included. These include: hybrids, dedicated methane/natural gas,
battery electric and (hydrogen) fuel cell buses. Data are potentially available from bus fleet
Ricardo – In confidence Ref: Ricardo/ED11852/ULEV evidence review, Issue 3You can also read