SPECIAL CLIMATE STATEMENT 70-DROUGHT CONDITIONS IN EASTERN AUSTRALIA AND IMPACT ON WATER RESOURCES IN THE MURRAY-DARLING BASIN - 09 APRIL 2019 - BOM
←
→
Page content transcription
If your browser does not render page correctly, please read the page content below
Special Climate Statement 70—drought conditions in
eastern Australia and impact on water resources in the
Murray–Darling Basin
09 April 2019
Special Climate Statement 70—drought conditions in eastern Australia and impact on water resources in the Murray–Darling
Basin
Version number/type Date of issue
1.0 09 April 2019
Unless otherwise noted, all images in this document are licensed under the Creative Commons
Attribution Australia Licence.
© Commonwealth of Australia 2019
Published by the Bureau of Meteorology
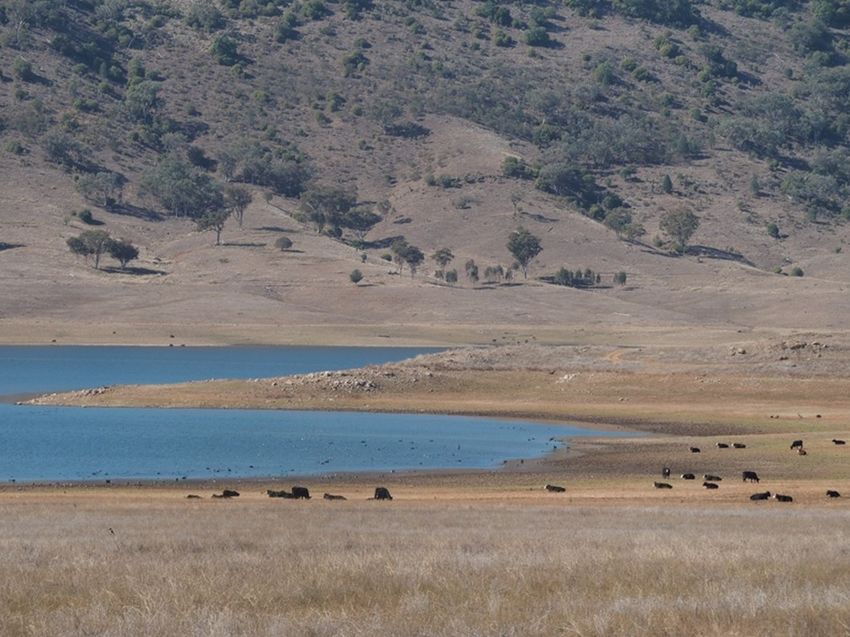
Cover image: Water storage, New South Wales, 2018 (Photo: Mark Wilgar).
2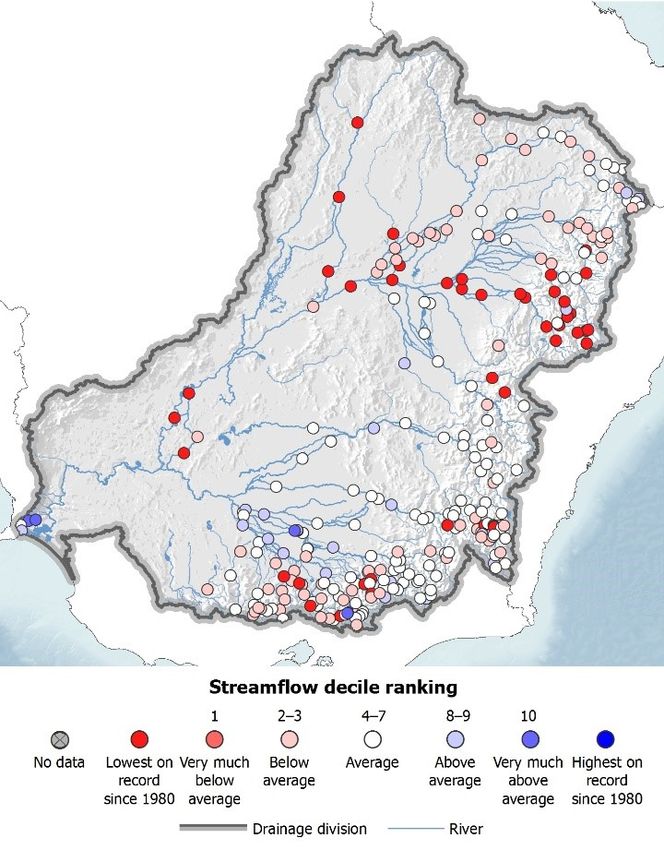
Special Climate Statement 70—drought conditions in eastern Australia and impact on water resources in the Murray–Darling
                                                                                                                  Basin

Table of contents
Introduction ............................................................................................................................................................. 4
1.       Rainfall deficiencies ...................................................................................................................................... 4
         1.1      Timeline of the drought ....................................................................................................................... 5
         1.2      Notably poor cool season rainfall ........................................................................................................ 6
         1.3.            January 2018 to March 2019 (15 months) ................................................................................... 7
         1.4.            April 2017 to March 2019 (24 months) ......................................................................................... 9
         1.5.            Lack of rain days and heavy rain days ....................................................................................... 10
2.       Temperature and evaporation .................................................................................................................... 11
3.       Water resources in the Murray–Darling Basin ........................................................................................... 13
         3.1.            Soil moisture ............................................................................................................................... 13
         3.2.            Water availability......................................................................................................................... 14
         3.3.            Streamflow .................................................................................................................................. 16
         3.4.            Groundwater ............................................................................................................................... 19
         3.5.            Hydrological impacts of recent rainfall ........................................................................................ 21
4.       The current event in a longer-term context ................................................................................................ 22
         Tables and figures ...................................................................................................................................... 24
References and further information ...................................................................................................................... 29

                                                                                                                                                                          3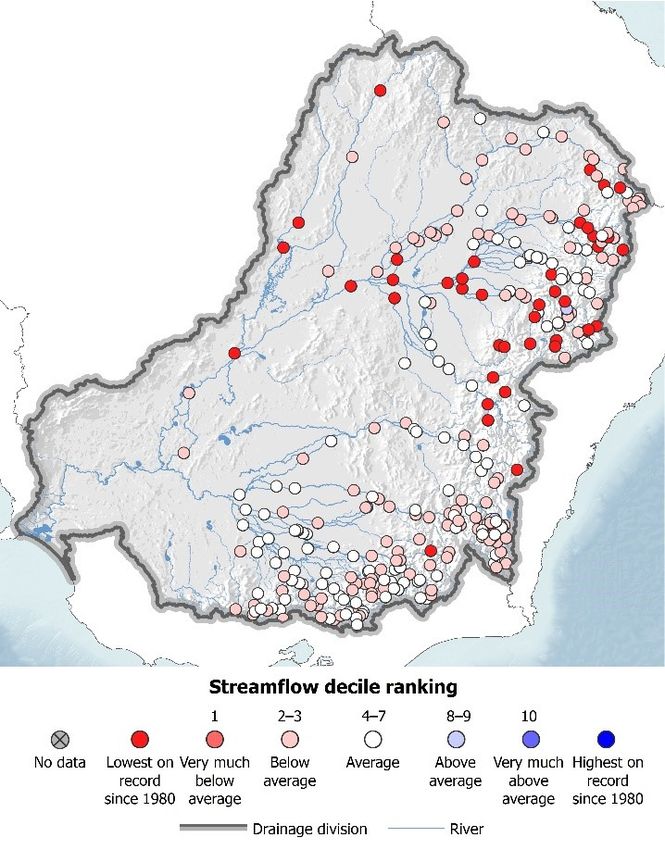
Special Climate Statement 70—drought conditions in eastern Australia and impact on water resources in the Murray–Darling
                                                                                                                  Basin

Introduction
The past two years have seen notable dry conditions over much of eastern Australia, with 2018 being especially
dry. A Special Climate Statement (Special Climate Statement 66—an abnormally dry period in Eastern
Australia) on the drought conditions, released in November 2018, described in detail the rainfall up to that point,
including broadscale drivers influencing the dry conditions.

This Statement (Special Climate Statement 70) focuses on the persistence of dry conditions since then, with an
intensification of drought and the growing impact on water resources in the Murray–Darling Basin (MDB). New
South Wales has been the focus of the notable dry conditions. On 1- to 2-year timeframes (to the end of March
2019), the rainfall deficiencies in the Murray–Darling Basin are third-lowest on record behind similar length
timeframes between 1901 and 1903, and between 1918 and 1920. These impacts have been exacerbated by
record high temperatures, including Australia's hottest summer on record in 2018–19. The extended nature and
timing of the dry conditions means that natural resource management, agriculture, water resources, and
emergency services organisations have all been significantly impacted.

Other areas affected by rainfall deficiencies include southern inland Queensland, central and east Gippsland in
Victoria, and parts of eastern South Australia. The dry conditions of the last two years follow a period of long-
term rainfall deficiencies from April 2012 to April 2016, which primarily affected two regions—most of inland
Queensland (and adjacent border areas of northern New South Wales), and central and western Victoria. The
most significant long-term rainfall deficits being currently experienced are in those areas affected by both the
2012–2016 and 2016–2018 dry periods. In these areas, below-average rainfall has prevailed for most of the last
six to seven years, interrupted only briefly by wet conditions in mid-2016. A major rain event in northern
Queensland in February 2019 resulted in extensive flooding,1 but largely missed regions to the south that are
most severely affected by the current drought.

This Statement has a focus on the severe hydrological impacts of drought in the MDB. There is a particular
focus on the northern MDB, where consistent low inflows to major catchments have resulted in storage levels
lower than those witnessed during the Millennium Drought and long periods of low flows. This analysis includes
a high-level look at trends that extend beyond the duration of the current drought and can be explored more
deeply at www.bom.gov.au/water.

       1. Rainfall deficiencies
Significant rainfall deficiencies have occurred on a range of timescales across eastern Australia since early
2017. Across eastern Australia many regions have seen peaks in the area covered by rainfall deficiencies
ending March 2019.

A rainfall total of 644.7 mm for the 24-month period since April 2017 was recorded for the MDB. This is the
third-lowest on record for the Basin since national records began in 1900, for all equivalent April to March 24-
month periods (Table 3). At this timescale, only April 1918 to March 1920 (626.2 mm) and April 1901 to
February 1903 (638.2 mm) had less rainfall for the MDB. If dry conditions continue through 2019, this event
may approach these records, noting that 1903 and 1920 brought increased rainfall as the year progressed.

Rainfall deficiencies since April 2017 affected most of inland New South Wales, extending into parts of southern
Queensland, and have also occurred in Gippsland and eastern South Australia. For the 15 months from
January 2018 to March 2019, rainfall totals are the fourth-lowest on record for the MDB for any equivalent
January to March period. New South Wales is third-driest on record at both the 15- and 24-month timescales.

1   See Special Climate Statement 69—An extended period of heavy rainfall and flooding in tropical Queensland

                                                                                                                      4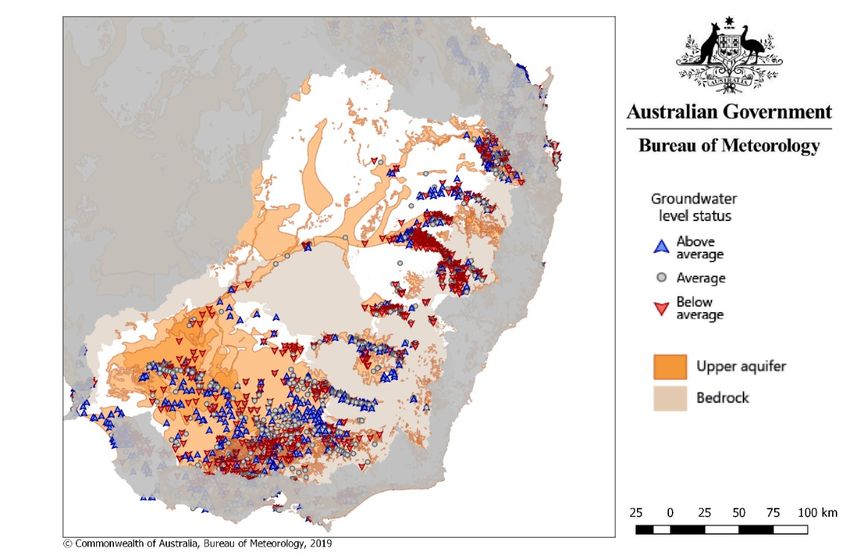
Special Climate Statement 70—drought conditions in eastern Australia and impact on water resources in the Murray–Darling
                                                                                                                  Basin

    1.1 Timeline of the drought
A particularly strong negative Indian Ocean Dipole (IOD) occurred in 2016, resulting in one of the wettest years
in recent decades across the MDB. Since this time, drier than average conditions have largely prevailed. Drier
than average conditions were observed across eastern Australia in 2017, especially across northern and
eastern areas of the MDB. In 2017, May to September rainfall was below average for most of Australia,
particularly over the southeast. Unusually high atmospheric pressure across the country during June 2017 was
associated with a southward shift of the belt of westerly winds, resulting in fewer rain-bearing low pressure
systems and cold fronts crossing southern Australia. It was the second-driest June on record nationally, and the
driest on record for Victoria. September 2017 was the driest on record for New South Wales and the MDB. This
is reflected in the rainfall deficiencies, with the area of very much below average rainfall (decile 1—lowest 10%
of all years) across the MDB peaking for the April to September 2017 period. Across this period, 42.7% of the
MDB was in decile 1, with large parts of Queensland and coastal New South Wales also very much below
average.

Rainfall deficiencies eased somewhat in late 2017, with above average rainfall through southeastern
Queensland, inland New South Wales, and northern Victoria. The Bureau of Meteorology declared La Niña in
December 2017, noting that it was unusual for one to develop so late in the year, but not unprecedented.
La Niña events typically result in above average summer rainfall over eastern Australia. However, this event
was weak and short-lived and drier than average conditions returned to large areas of eastern Australia.
Autumn rainfall in 2018 was the second-lowest on record for southern Australia (those areas south of 26°S),
meaning a very dry start for the southern wet season. Winter 2018 was also drier than average for the eastern
mainland and much of the north. While winter did see a strengthening of the westerly winds and some frontal
systems, there was little linkage by these systems to the tropics to provide the moisture needed for widespread
rainfall; and humidity remained unusually low over the south.

Rainfall in September 2018 was below average across much of eastern Australia, and it was the driest
September on record for Australia as a whole. A positive IOD was active from early September contributing to
reduced rainfall. In 2018, as in 2017, the peak of the dry conditions was across the April to September period,
with 82.9% of the MDB by area, in decile 1. These drier than average conditions can be seen in the rainfall
deficiency maps (see Figure 1).

As in 2017, the last quarter of 2018 saw average to above average rainfall across the MDB and surrounding
areas, especially during October and November. A positive phase of the Southern Annular Mode (SAM) from
late October to late December brought some relief from the dry conditions in eastern mainland Australia during
late spring. Positive SAM during spring and early summer is typically associated with increased onshore flow in
parts of eastern Australia, which typically increases rainfall in the affected regions. The start of 2019 has seen
very much below average rainfall over northeastern New South Wales and southeastern Queensland, with large
areas of lowest on record rainfall for the January to February period.

The sustained nature of these rainfall deficiencies means that water resources have been severely impacted,
especially in the Darling River catchments, with subsequent large impacts on streamflow, soil moisture and
water storages. Consequently, above average rainfall over a sustained period would be needed to relieve these
deficiencies. For systems more dependent on in-season rainfall, rainfall would not necessarily need to be
sustained over as long a period.

                                                                                                                      5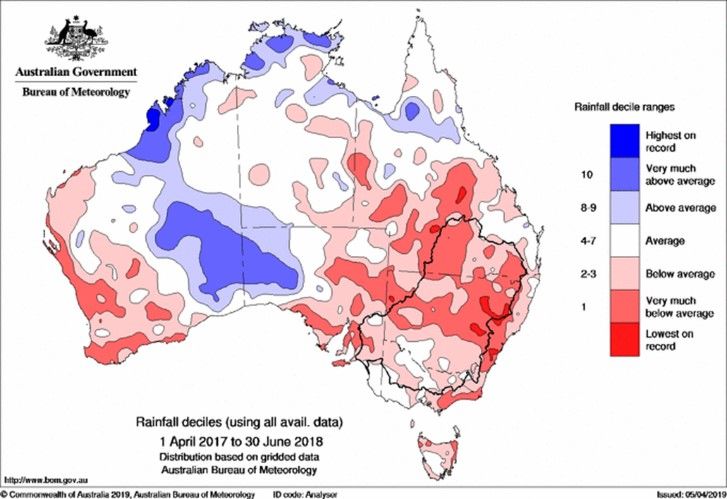
Special Climate Statement 70—drought conditions in eastern Australia and impact on water resources in the Murray–Darling
                                                                                                                  Basin

Figure 1. Deciles of rainfall for periods from 3 months to 24 months from April 2017 to March 2019. The
boundary of the Murray–Darling Basin is marked in black.

    1.2 Notably poor cool season rainfall
The recent dry periods have been especially severe during the cooler months of April to September (Figure 2),
an important time for agriculture and replenishment of surface and groundwater storages across southern
Australia. Averaged over the Murray–Darling Basin (MDB), total rainfall over two consecutive April to
September periods was the lowest on record, at 217.5 mm; around 15% below the previous record of 255.7 mm
for the 1940–41 April to September period. It was also the only instance of an April to September rainfall total

                                                                                                                      6
Special Climate Statement 70—drought conditions in eastern Australia and impact on water resources in the Murray–Darling
                                                                                                                  Basin

below 125 mm in two consecutive years. Rainfall for the combined two-year 2017 and 2018 April to September
period was lowest on record and very much below average (lowest 10% of all such periods) for large parts of
southeastern and southwestern Australia (nearly 97% of New South Wales was in the lowest 10 percent of such
periods). Around 50% of New South Wales was lowest on record for these two periods combined.

Lower than average rainfall totals across the cool season months in southern Australia has become a regular
feature of our climate in the past 20 years (State of the Climate 2018), particularly for southwest and southeast
Australia, including much of the MDB. This recurrent pattern has been linked to a southward shift in rain-bearing
systems, which increases the vulnerability to drought associated with natural factors such as El Niño or IOD.
However, the recent combined cool season anomalies in 2017 and 2018 have been more extensive and more
severe than those that have characterised the most recent 20 years.

Figure 2. Australian rainfall deciles for the combined two-year 2017 and 2018 April to September periods.

   1.3. January 2018 to March 2019 (15 months)
An intense phase of the dry period to date has occurred in the months since January 2018. Almost 80 percent
of New South Wales has received rainfall totals that are in the lowest 10% of all such periods on record (Figure
3). New South Wales also received totals between 40% to 60% of average over much of the State, and
between 20% and 40% of average in the northwest of New South Wales and in southwestern Queensland. The
very dry conditions have also extended to cover large parts of Victoria and the eastern half of South Australia.

                                                                                                                      7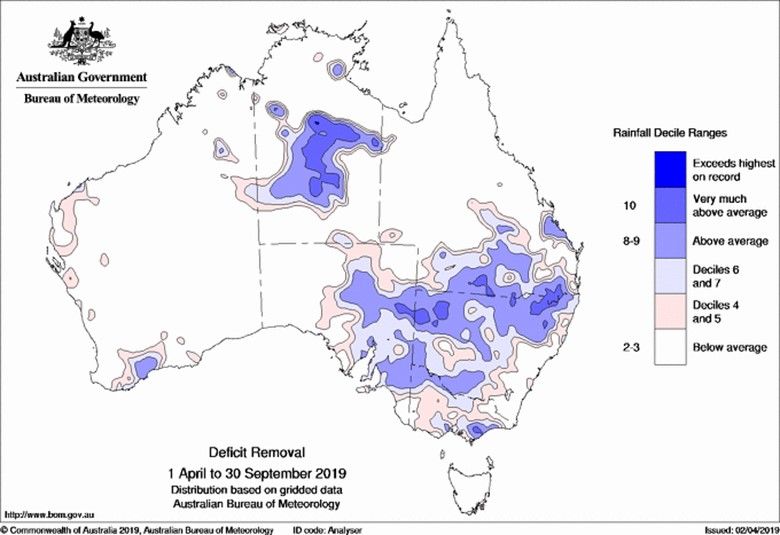
Special Climate Statement 70—drought conditions in eastern Australia and impact on water resources in the Murray–Darling
                                                                                                                  Basin

Figure 3. Australian rainfall deciles (left) and percentages (right) for the 15 months from January 2018 to March
2019.

To examine the severity of the deficiencies, we can also look at the rainfall needed to lift these areas out of the
lowest 10%. To lift areas of rainfall deficiency out of the lowest 10% of such periods on record for the period
January 2018 to September 2019, rainfall would have to be above average (deciles 8 and 9) over much of the
areas of rainfall deficiency for the six-month period to September 2019 (see Figure 4). This rainfall would only
lift the totals for the whole period above the 10th percentile. The rainfall needed to restore conditions nearer to
average is much higher again, noting that large areas have missed more than half a year's worth of average
rainfall (Figure 3). This is an indication of the scale and depth of the low rainfall received over the last
14 months.

Figure 4. Rainfall deciles needed for April to September 2019 period to lift current areas in rainfall deficiency at
14 months out of the lowest 10%.

                                                                                                                       8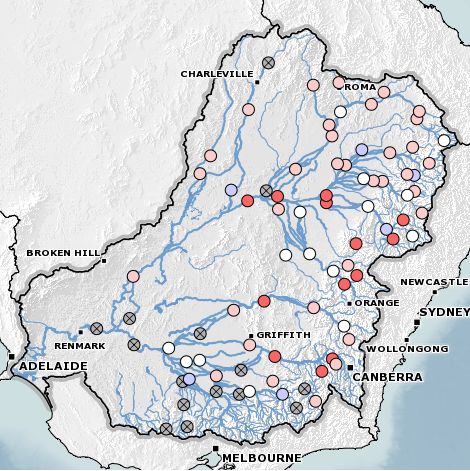
Special Climate Statement 70—drought conditions in eastern Australia and impact on water resources in the Murray–Darling
                                                                                                                  Basin

   1.4. April 2017 to March 2019 (24 months)
Significant rainfall deficiencies also exist at longer time scales, particularly for the inland east. For the period
April 2017 to March 2019, around 74% of New South Wales and around 73% of the MDB was in the lowest
10% of such periods on record. Both 2017 and 2018 had rainfall that was well below average through much of
New South Wales and southern inland Queensland, with only a brief period of near-to above-average rainfall in
the last quarter of 2017 and October 2018.

For the period April 2017 to March 2019, lowest on record rainfall was observed over southern inland
Queensland and areas northwestern New South Wales. Over most of this area, rainfall for the period has been
less than 50% of the 1961–1990 average. Large areas from central to southwestern Queensland and
northcentral and northwestern New South Wales, into northeastern South Australia, have seen rainfall totals
between 40% to 60% of average (compared to the 1961–1990 average), implying that nearly one year's worth
of average rainfall has been missed in the past two years.

Another area of notable rainfall deficits at this timescale has been central and East Gippsland in Victoria, from
the Latrobe Valley east to the New South Wales border. This region was very dry in both 2017 and 2018, with
the area missing out on the near average rains that fell further west in Victoria in 2017. The very dry conditions
coincide with numerous large and long-lived fires in forested areas in early 2019, where fuels have become very
dry over a long period of time.

Over the 24-month period there has been a large decline in water resources in the northern half of the MDB
including over the Namoi and Upper Macquarie catchments, important for inflows into the Darling system.
Considering the rainfall districts (RD) that cover these catchments, RD55 for the Namoi (Table 2), has had the
second lowest on record rainfall for equivalent 24-month periods, with rainfall around 62% of the 1961–1990
average. Rainfall districts RD62 and RD63 cover much of the Upper Macquarie catchment area and have also
seen low totals across the 24-month period to March 2019, both around 71% of the average. Areas of lowest on
record rainfall at the district level are RD44 (Warrego) in southern central Queensland and RD46 Western (Far
Northwest) in northwestern New South Wales.

Figure 5. Australian rainfall deciles (left) and percentages (right) for the 24 months from April 2017 to March
2019.

To examine the severity and depth of the deficiencies, we again look at the rainfall needed to lift these areas out
of the lowest 10% of historical values for such periods. To lift areas of rainfall deficiency out of the lowest 10%
of such periods on record for the period April 2017 to September 2019, rainfall would have to be above average
(deciles 8 and 9) over a large area that includes Gippsland in Victoria for the six-months from April to
September 2019. In areas of northeastern New South Wales and southeastern Queensland, this rainfall would
have to be very much above average (top 10% of all such periods). Areas including northeastern New South

                                                                                                                       9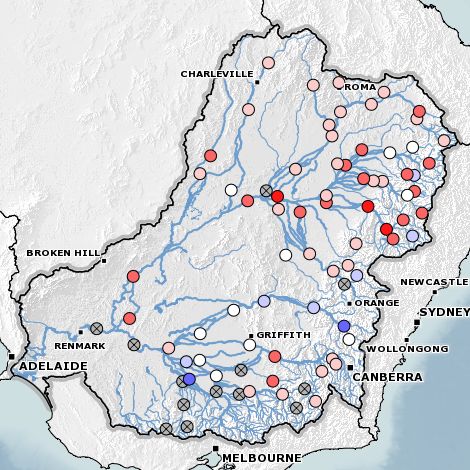
Special Climate Statement 70—drought conditions in eastern Australia and impact on water resources in the Murray–Darling
                                                                                                                  Basin

Wales and southern inland Queensland need more than 150% of the average rainfall for the coming April to
September period. This rainfall is just to lift the rainfall totals for the whole period above the 10th percentile, with
higher rainfall totals needed to restore conditions nearer to average.

Figure 6. Rainfall deciles (left) and percentages (right) needed for April to September 2019 to lift current areas
in rainfall deficiency at 24 months out of the lowest 10%.

   1.5. Lack of rain days and heavy rain days
Notable over the period is the lack of rain days (where rainfall is greater than 1 mm for a 24 hour period) and
heavy rain days (greater than 10 mm for a 24 hour period). Looking at Figure 7, large parts of mainland
southeast Australia into southern Queensland are recording very much below average (decile 1) counts of rain
days and heavy rain days. This could be expected during a period of drought, but it does point to the
compounding effect of both the lack of rain days and lack of heavy rainfall days.

2018 saw low numbers of heavy rainfall days in comparison to the wet year of 2016 across the MDB. For
example, up until heavy rainfall days on the 13th and 14th of December 2018 the next highest (third highest for
the year) daily rainfall total averaged across the MDB was 7.75 mm on the 22nd of November. In 2016 there
were 20 days higher than this threshold across the MDB, including eight in September alone.

Figure 7. Deciles of the number of rain days (rainfall greater than 1 mm) and heavy rain days (rainfall greater
than 10 mm) for the 14-month period ending February 2019.

                                                                                                                      10
Special Climate Statement 70—drought conditions in eastern Australia and impact on water resources in the Murray–Darling
Basin
2. Temperature and evaporation
The dry conditions experienced over the past two years were exacerbated by record-high temperatures.
Unusually warm temperatures have dominated Australia's climate in recent years, and particularly so in the
drought affected regions. Mean temperatures in 2017 (+1.53 °C) were the highest on record for the MDB to that
point, with the record being broken in 2018 with an anomaly of +1.66 °C above the 1961–1990 average. While
droughts are often associated with above average temperatures, these values are typically 1 °C or more above
values for comparable periods experienced in historical dry years such as 1972, 1982, and 1994. The combined
occurrence of high temperatures with the dry conditions is significant, as it is typically associated with increased
water demand, increased fire danger, and increased stress on vegetation and animals.
Summer 2018–19 was Australia's warmest summer on record. The national mean temperature for summer was
2.14 °C warmer than the 1961–1990 average, exceeding the previous record (+1.28 °C in 2012–13). Day and
night-time temperatures were both warm, with the mean maximum temperature 2.60 °C above average (almost
a degree higher than the previous record of +1.64 °C in summer 2012–13). The mean minimum temperature
broke the record by a smaller, but still substantial, margin at 1.67 °C warmer than average (previous record was
+1.09 °C in summer 2017–18). March was also warm and was Australia's warmest March on record.
Modelled and observed evaporation shows the impact of the warm temperatures and drier than average
conditions in the northern half of the Murray–Darling Basin, which saw highest on record summer potential
evaporation for the most recent 30-year period. Potential evaporation (evaporative demand) and pan
evaporation was well above average over most of Australia leading up to and during the winter of 2018.
Figure 8. Maximum temperature deciles for April to August 2018 (left) and summer 2018–19 (right). Deciles are
calculated with respect to the whole period from 1911.
Estimated potential evaporation is also examined in the modelled data to look at the impacts of the below
average rainfall, reduced cloudiness, and increased temperatures. April to August 2018 saw highest on record
potential evaporation across large parts of the MDB (Figure 9). The actual evaporation varies from these
numbers, being dependent on how much water remains in the landscape and plant water use efficiency.
11Special Climate Statement 70—drought conditions in eastern Australia and impact on water resources in the Murray–Darling
Basin
Figure 9. Potential evapotranspiration from the Australian Landscape Water Balance version 6 model for April
to August 2018 (left) and December 2018 to February 2019 (right). Deciles are calculated with respect to the
most recent 30-year period from 1990.
12Special Climate Statement 70—drought conditions in eastern Australia and impact on water resources in the Murray–Darling
Basin
3. Water resources in the Murray–Darling Basin
Water resource conditions are impacted heavily by the occurrence and frequency of rainfall across the
landscape, and further impacted by temperature and consumptive and environmental water use. Given the
historic low rainfalls and high temperatures reported earlier in this statement, water availability across the MDB
is also significantly impacted. Key aspects of water resources availability and condition are described below.
3.1. Soil moisture
Average soil moisture levels in the top 100 cm of soil over the past 24 months (April 2017 – March 2019) have
set new low records in parts of the MDB. These values provide an estimate of the moisture stress experienced
by vegetation and the severity of agricultural drought.
1. Paroo 14. Upper Murray
2. Warrego 15. Kiewa
3. Condamine- 16. Ovens
Culgoa 17. Broken
4. Moonie 18. Goulburn
5. Border Rivers 19. Murray-
6. Gwydir Riverina
7. Namoi 20. Campaspe
8. Castlereagh 21. Loddon
Figure 10. Soil moisture deciles for the past 24 months in the root 9. Macquarie-Bogan 22. Avoca
zone (top 100 cm of the soil profile) in the Murray–Darling Basin. 10. Darling 23. Benanee
From the AWRA-L version 6 model. 11. Lachlan 24. Wimmera-Avon
12. Murrumbidgee 25. Mallee
13. Lake George 26. Lower Murray
13Special Climate Statement 70—drought conditions in eastern Australia and impact on water resources in the Murray–Darling
Basin
Catchment Root zone soil moisture (0–100cm) for past 24 months
Namoi Lowest on Record
Murrumbidgee Lowest on Record
Castlereagh Lowest on Record
Condamine–Culgoa Lowest on Record
Macquarie–Bogan Lowest on Record
Warrego Lowest on Record
Paroo 2nd Lowest (lowest since Feb 2019)
Lake George 3rd Lowest (lowest since 1981)
Darling 4th Lowest (lowest since 1945)
Lachlan 4th Lowest (lowest since 1920)
Gwydir 9th Lowest (lowest since 1981)
Border Rivers 10th Lowest (lowest since 1981)
Table 1. The past 24 months (April 2017 – March 2019) ranked against all the other 24-month periods (model
data record January 1911 – March 2019).
March rainfall in the MDB was close to average in most areas, with above average rainfall in the far north and
below average in the south (Figure 11, left). However, root zone soil moisture across most of the Basin is still
below average to very much below average (Figure 11, right).
Figure 11. March rainfall deciles (left) and soil moisture deciles for March in the root zone soil moisture (top 100
cm of the soil profile) across the Murray–Darling Basin from the AWRA-L version 6 model.
3.2. Water availability
Storage levels in the southern Murray–Darling Basin are approaching their lowest levels in three years (Figure
12). If the winter of 2019 is as dry as the winter of 2018, then it is expected that storage levels may decline to
similar levels to what were seen during the Millennium Drought. Storage levels in the northern MDB are nearly
down to 8 per cent and are lower than at any point during the Millennium Drought. Rainfall in the northern Basin
is generally summer-dominant and the last three summers have failed to deliver any significant inflows. Runoff
in the major storage catchments in the Gwydir, Namoi and Macquarie valleys was well below average for every
month in the past year (Figure 13).
This low runoff has severely impacted system inflows. Over the past two years, observed inflows in the
Macquarie and Namoi valleys have been well below the lowest inflows of the New South Wales Government's
14Special Climate Statement 70—drought conditions in eastern Australia and impact on water resources in the Murray–Darling
Basin
records, which extend back more than a century. Between August 2017 and March 2019 just 85 gigalitres of
water has flowed into Burrendong Dam in the Macquarie Valley. This is 37 per cent of the previous record low
inflow of about 228 gigalitres for the 20 months ending March 1939. The observed inflows to Keepit and Split
Rock Dams in the Namoi Valley in the 23 months ending March 2019 were 66.5GL, compared with the previous
record low of 69.7GL for the 23 months ending March 1920. These storages play a crucial role in supplying
water for communities, the environment, stock and domestic use and irrigated agriculture.
Figure 12. Total storage volumes in the northern and southern Murray–Darling Basin at end of March 2019.
15Special Climate Statement 70—drought conditions in eastern Australia and impact on water resources in the Murray–Darling
Basin
Burrendong Reservoir catchment runoff Copeton Reservoir catchment runoff
100 40
Modelled Runoff (GL)
Modelled Runoff (GL)
80
30
60
20
40
10
20
0 0
Apr May Jun Jul Aug Sep Oct Nov Dec Jan Feb Mar Apr May Jun Jul Aug Sep Oct Nov Dec Jan Feb Mar
Average 2018/19 Average 2018/19
Split Rock and Keepit reservoirs Figure 13. Modelled runoff in major northern MDB
catchment runoff
storage catchments, from the AWRA-L version 6
40
model.
Modelled Runoff (GL)
30
20
10
0
Apr May Jun Jul Aug Sep Oct Nov Dec Jan Feb Mar
Average 2018/19
3.3. Streamflow
Streamflows have been below average across the MDB since 2012, particularly in the Namoi, Warrego and
Darling rivers, several of the Victorian tributaries to the River Murray, and the upper-Murrumbidgee (Figure 14).
More detail on the hydrological trends across the 2017–18 year (July to June) will be provided in the Bureau's
Water in Australia report, to be released in May 2019. The exceptionally dry conditions across the northern
Basin from July 2017 to June 2018 resulted in further periods of very low streamflows, particularly at locations in
the upper catchments of all northern Basin tributaries (Figure 15). These upper reaches of northern Basin
catchments, along the western side of the Great Dividing Range, is where the majority of inflows to the Darling
River originate. The impact of drought on streamflow has continued to worsen over the past nine months with
an increasing number of sites registering lowest months streamflows on record (Figure 16).
16Special Climate Statement 70—drought conditions in eastern Australia and impact on water resources in the Murray–Darling
Basin
Figure 14. Streamflow deciles at key sites in the Figure 15. Streamflow deciles at key sites in the
MDB July 2012 to June 2018 based on records back MDB July 2017 to June 2018 based on records back
to 1980. to 1980.
17Special Climate Statement 70—drought conditions in eastern Australia and impact on water resources in the Murray–Darling
Basin
July 2018 August 2018 September 2018
October 2018 November 2018 December 2018
January 2019 February 2019 March 2019
Figure 16. Monthly streamflow deciles at key sites in the MDB July 2018 to March 2019 based on records back
to 1980.
Due to these ongoing, dry conditions across the northern Basin, flows into the Darling River and downstream to
the Menindee Lakes, Lower Darling and in to the Murray River have been very low (Figure 17). Since 2014,
streamflow in the Darling has mostly been very much below average or lowest on record. While this low flow
period has not yet lasted for as long as during the Millennium Drought, it is noticeably more intense during the
18Special Climate Statement 70—drought conditions in eastern Australia and impact on water resources in the Murray–Darling
Basin
summer months, with closer to average flows during winter months. Conversely, throughout many of the
summer months during the Millennium Drought, the Darling River received small flows which were close to
monthly averages or above average, while winter and autumn months were very dry. The wet winter of 2016
(see storage levels at Figure 17) only provided a brief increase in flows to the Darling, with below average flows
observed from January 2017.
Figure 17. Daily streamflow deciles for Darling River inflows from upstream catchments as measured at
Wilcannia.
3.4. Groundwater
Groundwater resources across the MDB have also been significantly affected by the prolonged dry period.
Aquifer systems are impacted by reduced rainfall and stream recharge and by increased pumping for
consumptive use, especially given the scarcity of surface water supplies. Thus, less water is getting into the
aquifers; and aquifer systems are under further stress due to increased extractions. Information from the
2017–18 year shows that for the MDB, 39 per cent of monitoring bores across the MDB had a below average
level in 2017–18, with 40 per cent being in the average range and 21 per cent being above average. The
number of bores with below average levels across the basin rose slightly, increasing by 5 per cent when
compared to the 2016–17 levels.
However, in the most drought-affected areas in New South Wales, including the Namoi, Gwydir and Macquarie
catchments, the majority of bores are at below average levels, correlating with areas where increased
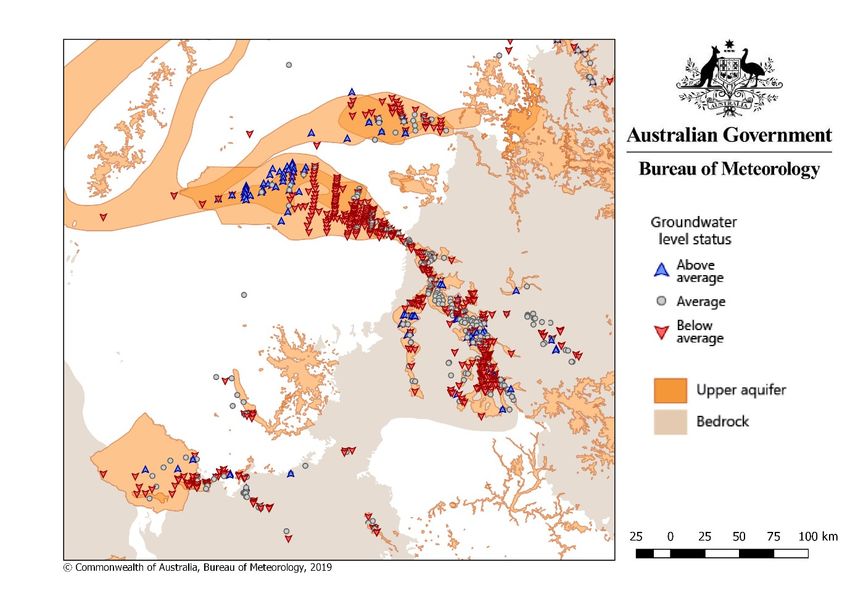
groundwater extraction and reduced streamflow recharge have occurred. Figure 18 shows this assessment for
the upper aquifer across the Basin.
19Special Climate Statement 70—drought conditions in eastern Australia and impact on water resources in the Murray–Darling
Basin
Figure 18. Status of groundwater levels in the MDB, July 2017 to June 2018.
The Namoi catchment has been particularly affected by well below average rainfall and streamflow over the
past two years. Figure 19 shows groundwater level status across the Namoi.
Most bores in the upper and lower Namoi show below average groundwater levels, with small areas at average
and above average. The long-term trends in groundwater levels in the Namoi are typically declining.
Significant volumes of groundwater are extracted from aquifers in the Namoi catchment. Drought can cause
groundwater use to increase as surface water becomes scarce and allocations are reduced, and this appeared
to occur in the upper and lower Namoi catchment, in 2017–18, with licenced extractions using 200,049
megalitres of groundwater from aquifers. This was almost the full allowable take of 203,800 megalitres. This
number does not include unlicensed extractions for stock watering or domestic purposes.
A decline in groundwater levels can impact streamflow and, as Figure 14 shows, streamflow in the Namoi has
been consistently below average in recent years. Where groundwater is connected to surface water, it can
provide baseflow to rivers, streams and springs. Persistent declines in water level in the upper aquifer may lead
to baseflow ceasing, or even streamflow being lost to the aquifer.
20Special Climate Statement 70—drought conditions in eastern Australia and impact on water resources in the Murray–Darling
Basin
Figure 19. Status of groundwater levels in the Namoi catchment, July 2017 to June 2018.
3.5. Hydrological impacts of recent rainfall
Notable rainfall occurred over parts of the MDB in the last two weeks of March (Figure 20). However, there was
minimal runoff due to the dry soil conditions (Figure 21). In the northern MDB, there was a considerable,
isolated runoff event in the upper-Warrego catchment. Flows at Wyandra exceeded the minor flood level from
March 31 to April 3, peaking at around 110,000 megalitres per day on April 2, meaning a significant volume of
water will be transported to the lower catchment. However, the lower catchment is very dry and most of the flow
will spill into the neighbouring Paroo catchment via the Cuttaburra Channel from late in the second week of
April. The Warrego system ends at Toorale National Park, which is a large, presently dry, floodplain. Low flows
are expected to arrive at Toorale in the last week of April. If the flows are sustained for long enough it is
possible that some water may flow into the Darling. However, at the time of writing there are high uncertainties
in these estimates.
The Namoi catchment received widespread rainfall during 30 and 31 March. Totals of 30 to 50 mm were
recorded over much of the catchment and several locations recorded totals of 70 to 110 mm. While this rainfall
has gone some way to alleviating severe soil moisture deficiencies there has been little impact on streamflow
and no impact on storage levels. Most rain fell in the mid catchment, downstream of the major storages. Local
streamflow rises were observed in parts, but these flows are unlikely to have any impact downstream at
Walgett, where the Namoi River joins the Barwon River.
The Castlereagh River catchment received notable rainfall on Friday 29 March overnight into Saturday 30
March. Coonamble Airport in the mid-catchment received 94 mm, Coonabarabran Airport received 69 mm and
Purlewaugh received 60 mm. Keveline in the lower catchment received 30 mm. This rainfall resulted in rapid
21Special Climate Statement 70—drought conditions in eastern Australia and impact on water resources in the Murray–Darling
Basin
river rises in the Castlereagh River between Coonabarabran and Mendooran. However, these small flows are
unlikely to have any impact on the lower catchment.
In the southern MDB there was also a small amount of runoff in the Upper Murray, Kiewa and Ovens
catchments. However, this runoff was insufficient to generate significant flows and increase overall resource
availability. No further rainfall is forecast for the MDB during the first two weeks of April.
Figure 20. Rainfall February 18–24 (left) and 24–31 (right) in the Murray–Darling Basin.
1. Paroo 15. Kiewa
2. Warrego 16. Ovens
3. Condamine- 17. Broken
Culgoa 18. Goulburn
4. Moonie 19. Murray-
5. Border Rivers Riverina
6. Gwydir 20. Campaspe
7. Namoi 21. Loddon
8. Castlereagh 22. Avoca
9. Macquarie- 23. Benanee
Bogan 24. Wimmera-
10. Darling Avon
11. Lachlan 25. Mallee
12. Murrumbidgee 26. Lower
13. Lake George Murray
14. Upper Murray
Figure 21. Modelled runoff in southeastern Australia during March from the AWRA-L version 6 model (left) and
MDB catchment legend (right).
4. The current event in a longer-term context
The Murray–Darling Basin (MDB) previously experienced major multi-year droughts in 1895–1903, 1938–1946,
and 2001–2009. The general pattern in inland New South Wales and Queensland has been one of a relatively
dry first half of the 20th Century, a relatively wet second half of the 20th Century (with especially wet decades in
the 1950s and the 1970s), then a return since 2001 to rainfall more typical of the drier 1900–1950 period
(except during the extremely wet conditions of the 2010–11 and 2011–12 La Niña events). The more limited
evidence available suggests that rainfall in the late 19th Century was comparable to that of the 1950–2000 wet
period.
There are downward trends in rainfall since the 1990s in southern parts of eastern Australia, particularly
Victoria, and in the higher rainfall areas of the MDB that are generally located in the highlands of the Great
22Special Climate Statement 70—drought conditions in eastern Australia and impact on water resources in the Murray–Darling
Basin
Dividing Range. These trends are concentrated in the cool season (April to October), with little change during
summer. A major influence on this drying has been the strengthening and extension of the subtropical high
pressure ridge during winter, shifting rain-bearing weather systems south.
The current drought has taken place against a backdrop of consistently rising temperatures. Warming was
slower to develop in the MDB than it was over most other parts of the country, with little trend in mean
temperatures over most of the 20th Century, but in recent decades the Basin has seen some of the most rapid
warming in Australia. Since 1970, most of the region has been warming at a rate of between 0.2 °C and 0.4 °C
per decade. The last five years, all of which have had mean temperatures at least 1 °C above the 1961–1990
average, have ranked amongst the nine warmest on record for the Basin (with 2017 being the warmest), and
nine of the Basin's ten warmest years have occurred since 2005. This warming has placed additional moisture
stress on many systems within the region, over and above that associated with variations in rainfall.
23Special Climate Statement 70—drought conditions in eastern Australia and impact on water resources in the Murray–Darling
Basin
Tables and figures
Figure 22. Map of Australia showing the rainfall districts.
Table 2: District rainfall averages (percentage of the 1961–1990 average) and rankings for the 24-month period
ending in March 2019. National rainfall records start in 1900.
District District name State Rank (of Average Fraction
number 118) (mm) of mean
17 Far North SA 7 162.7 48% 7th-lowest; lowest since 1945
19 Upper North SA 4th-lowest (record 324.4 mm in
4 347.8 57%
1930)
20 Northeast SA 11 276.8 62%
21 Lower North SA 3rd-lowest (record 467.3 mm in
3 557.1 70%
1915)
3rd-lowest (record 538.3 mm in
23A Adelaide Plains SA 3 606.4 71%
1915)
24Special Climate Statement 70—drought conditions in eastern Australia and impact on water resources in the Murray–Darling
Basin
2nd-lowest (record 606.6 mm in
23B County Light SA 2 691.5 69%
1915)
Mount Lofty
23C SA 11 1196.9 84%
Ranges
Upper Murray
24A SA 5 345.8 66% 5th-lowest; lowest since 1983
Valley
Lower Murray 4th-lowest (record 438.8 mm in
24B SA 4 511.6 71%
Valley 1915)
25A Murray Mallee SA 4th-lowest (record 394.1 mm in
4 439.1 70%
1915)
25B Upper Southeast SA 16 761.3 85%
34 West Central QLD
26 990.4 80%
Coast
35 Central Highlands QLD 7 891.3 72% 7th-lowest; lowest since 2003
36 Central Lowlands QLD 12 636.3 68%
37 Upper Western QLD 71 695.4 104%
38 Lower Western QLD 30 316.2 72%
41 East Darling QLD 3rd-lowest (record 775.2 mm in
3 894.4 66%
Downs 1920)
42 West Darling QLD
7 857.6 73% 7th-lowest
Downs
43 Maranoa QLD 3rd-lowest (record 726.2 mm in
3 741.6 66%
1903)
44 Warrego QLD 1 460.5 55% lowest
45 Far Southwest QLD 4th-lowest (record 220.1 mm in
4 255.5 49%
1902)
46 Western (Far
NSW 1 193.4 40% lowest
Northwest)
47 Western (Lower
NSW 10 318.9 59% 10th-lowest; lowest since 2003
Darling)
48 Western (Upper
NSW 5 370.1 52% 5th-lowest; lowest since 1945
Darling)
49 Western
(Southwest NSW 9 435.7 63% 9th-lowest; lowest since 2003
Plains)
25Special Climate Statement 70—drought conditions in eastern Australia and impact on water resources in the Murray–Darling
Basin
50 Central Western NSW
5 609.8 65% 5th-lowest; lowest since 1930
Plains (S)
51 Central Western NSW
5 558.6 60% 5th-lowest; lowest since 1930
Plains (N)
52 Northwest Plains NSW 3rd-lowest (record 562.3 mm in
3 576.8 55%
(W) 1903)
53 Northwest Plains NSW 3rd-lowest (record 704.4 mm in
3 749.3 61%
(E) 1920)
54 Northwest Slopes NSW 2nd-lowest (record 789.3 mm in
2 932 64%
(N) 1920)
55 Northwest Slopes NSW 2nd-lowest (record 818.2 mm in
2 880.1 62%
(S) 1920)
56 Northern NSW 2nd-lowest (record 1073.1 mm in
2 1187.5 69%
Tablelands (W) 1920)
57 Northern NSW
11 1571.1 74%
Tablelands (E)
58 Upper North NSW
15 2097.3 75%
Coast
59 Lower North NSW
19 2228.9 76%
Coast
60 Manning NSW 10 1798.3 74% 10th-lowest; lowest since 2003
61 Hunter NSW 6 1254.5 69% 6th-lowest; lowest since 1981
62 Central NSW
8 978.5 71% 8th-lowest; lowest since 1981
Tablelands (N)
63 Central NSW
5 1201.6 71% 5th-lowest; lowest since 2004
Tablelands (S)
64 Central Western NSW 4th-lowest (record 709.4 mm in
4 817.4 64%
Slopes (N) 1920)
65 Central Western NSW 4th-lowest (record 722.6 mm in
4 807.6 67%
Slopes (S) 1920)
66 Metropolitan (E) NSW 8 1615.3 69% 8th-lowest; lowest since 1981
67 Metropolitan (W) NSW 12 1324.9 69%
68 Illawarra NSW 2nd-lowest (record 1338.7 mm in
2 1342.5 59%
1981)
69 South Coast NSW 15 1453.2 74%
26Special Climate Statement 70—drought conditions in eastern Australia and impact on water resources in the Murray–Darling
Basin
70 Southern NSW
Tablelands 17 1147.6 79%
(Goulburn-Monaro)
71 Southern NSW
Tablelands (Snowy 38 1729 90%
Mountains)
72 Southwest Slopes NSW
21 1611.8 84%
(S)
73 Southwest Slopes NSW
17 964 77%
(N)
74 Riverina (E) NSW 14 666.8 71%
75 Riverina (W) NSW 11 525.9 68%
76 North Mallee VIC 9 436 71% 9th-lowest
77 South Mallee VIC 23 562.2 79%
78 North Wimmera VIC 28 714.6 86%
79 South Wimmera VIC 21 912.5 82%
80 Lower North VIC 22 649.3 76%
81 Upper North VIC 15 783.3 73%
82 Lower Northeast VIC 21 1599.9 83%
83 Upper Northeast VIC 19 2146.8 84%
84 East Gippsland VIC 5 1395.1 75% 5th-lowest; lowest since 2004
85 West Gippsland VIC 2nd-lowest (record 1389.7 mm in
2 1420.8 77%
2007)
86 East Central VIC 11 1550.5 82%
87 West Central VIC 13 1018 78%
88 North Central VIC 16 1264.8 80%
89 Western Plains VIC 16 1049.3 83%
90 West Coast VIC 25 1397.1 92%
27Special Climate Statement 70—drought conditions in eastern Australia and impact on water resources in the Murray–Darling
Basin
Table 3: Lowest regional rainfall averages (mm) on record for 15- and 24-month periods ending in March for the
Murray–Darling Basin and New South Wales as a whole. Periods ending in March 2019 are shown in bold.
Murray–Darling Basin New South Wales
15-month 24-month 15-month 24-month
342.2 (1902–03) 626.2 (1918–20) 388.3 (1902–03) 691.6 (1918–20)
357.2 (1944–45) 638.2 (1901–03) 409.9 (1944–45) 692.6 (1901–03)
361.3 (1922–23) 644.7 (2017–19) 429.6 (2018–19) 724.7 (2017–19)
361.8 (2018–19) 645.1 (1928–30) 435.6 (1922–23) 737.2 (2001–2003)
375.2 (1919–20) 648.7 (1914–16) 438.5 (2002–03) 766.5 (1943–1945)
Table 4: Annual temperature anomalies (°C, from 1961–1990 average) for significant drought years in New
South Wales.
Year Maximum Minimum
temperature temperature
anomaly anomaly
1940 +1.08 −0.58
1965 +0.78 −0.28
1982 +1.04 +0.08
1994 +0.69 −0.36
2002 +1.64 +0.31
2006 +1.60 +0.53
2018 +2.13 +1.23
28Special Climate Statement 70—drought conditions in eastern Australia and impact on water resources in the Murray–Darling
Basin
References and further information
Data used in this statement is current as of 3 April 2019 and is subject to the Bureau's routine quality control
processes. Maximum temperature observations prior to 1910 have not been used unless it is known that they were
measured using standard equipment comparable to post-1910 standards.
Further information is available from:
www.bom.gov.au/climate
www.bom.gov.au/water/
Australia's changing climate:
www.bom.gov.au/state-of-the-climate/
Monthly Drought Statement:
www.bom.gov.au/climate/drought/
29You can also read