Spending Review 2018 Hospital Inputs and Outputs: 2014 to 2017 - Department of ...
←
→
Page content transcription
If your browser does not render page correctly, please read the page content below

Spending Review 2018

Hospital Inputs and Outputs: 2014 to 2017

J ESSICA L AWLESS
H EALTH V OTE
J ULY 2018

                         This paper has been prepared by IGEES staff in the
                         Department of Public Expenditure and Reform.
                         The views presented in this paper do not
                         represent the official views of the Department or
                         the Minister for Public Expenditure and Reform.
                    1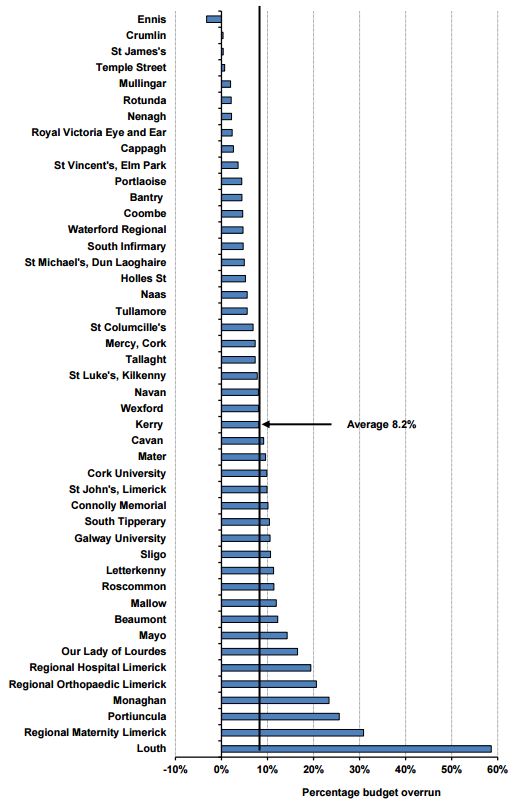
Key Findings
This paper analyses the trends in Acute sector inputs and outputs over the period 2014 to
2017. Using data available from the monthly Management Data Reports as published by the
HSE, hospital outputs are limited to day case and inpatient discharges, Emergency Department
presentations and Waiting List numbers.
The data demonstrates a clear disconnect between the increased investment made over the
three years and the subsequent improvement in terms of output levels.
On the input side, expenditure on the Acute sector increased by 17% - from €4.05bn to
€4.73bn. Despite this €680m investment, improvements in output levels are marginal.
Staff numbers increased by 17% over the period with pay increasing by 14%.
In terms of outputs;
o There was a 4% increase in day case discharges over the period with inpatient
discharges falling by 1%.
o The Case Mix Index (a measure of case complexity) shows a marginal increase (1%) in
the complexity of day case procedures and a 4% increase in the complexity of
inpatient cases.
o Emergency Department presentations grew by 5% between 2014 and 2017.
o When compared against the expenditure trend over the period, there appears to be
no link between the growth in spend and output levels.
In addition to this, waiting list numbers also continue to grow:
o Between 2014 and 2017 the average number of people waiting on a day case
procedure increased by 59% while the average number of those waiting on an
inpatient procedure increased by 46%.
o Furthermore, the proportion of those waiting over 15 months for a day case
procedure increased by 10 percentage points while there was a 14 percentage point
increase in the proportion waiting for an inpatient procedure.
In line with international experience, supply side solutions to the problems of long waiting
lists have not resulted in any sustained effect. Targeted funding initiatives resulted in short-
term falls in waiting list numbers and subsequently reverted to previous levels and beyond.
There continues to be a significant issue with regard to hospital budget management. By
December 2017, all but two hospitals reported being over budget with an average overspend
of 7%. This represents very little improvement since 2012 when the C&AG identified that all
but one hospital reported being over budget at end-year with an average overspend of 7%.
Overall, despite significant increases in expenditure over the three year period, there has been
little improvement made with regard to Acute sector output.
2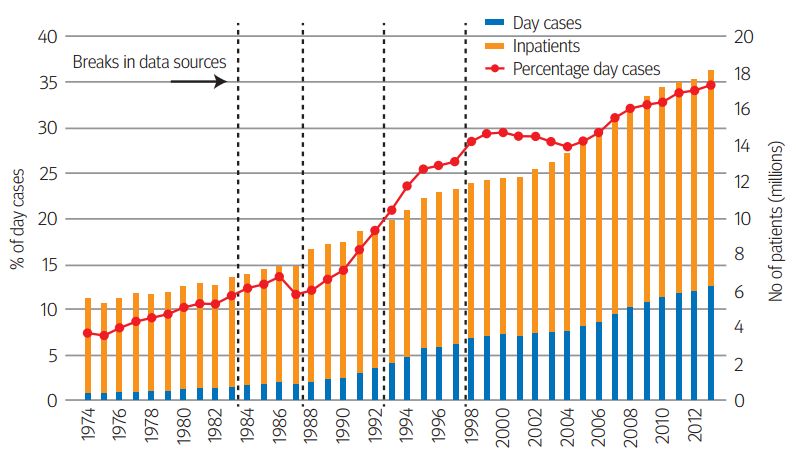
1. Introduction
In 2018, Health will account for 25% of total Gross Government Spend at €15.3 billion. Of this €4.7
billion has been allocated to the Acute sector. This represents 31% of total Health spend and c. 8% of
total Government spending.

Over the period 2014-2017, Gross Voted Government spend has increased by on average 2.7% p.a.
However, the proportionate increase in Health spending far exceeds this, growing by 17% over the
period. Figure 1 demonstrates this pattern and shows that in 2014, even as Gross Voted spend fell,
hospital spend was prioritised and increased by 3%.

Figure 1: Annual Growth in Spend, 2014-2017
 18%                                                                                        17%
 16%
 14%
 12%
 10%                                                                                   8%
  8%                                                                      7%
  6%                                                   5%            5%
                                    4%
  4%              3%                              3%
  2%                           1%
  0%
 -2%        -1%

              2014              2015               2016               2017            2014-2017

                  % Annual Change Gross Voted Spend         % Annual Change Acute Spend

Source: HSE Management Data Reports, 2014-2017; Revised Estimates Volumes 2014-2017

In total, between 2014 and 2017, net hospital spend increased by €680m or 17%. This increase reflects
a 14% increase in pay spending and a 30% increase in non-pay spending over the period.

Figure 2: Hospital Spend 2014-2017

Source: HSE Management Data Reports, 2014-2017.

However despite this increase in spend over the period, the sector remains one of the most
challenging within the overall Health vote. The available data demonstrates a clear disconnect
between the investment made in the acute sector in recent years and improvements in output levels.
                                                       3
For example, using the available data to 2017 we see that while expenditure over the period increased
by 17%, day case procedure numbers and ED presentations increased by just 4% and 5% respectively
while inpatient numbers fell by 1%. The below graph highlights the disparity between inputs in terms
of spend and WTE number and outputs.

Figure 3: Rate of Growth – Spend V. Output, 2014-2017
    0.18
    0.16
    0.14
    0.12
    0.10
    0.08
    0.06
    0.04
    0.02
       -
    (0.02)
    (0.04)
          2014                   2015                      2016                    2017

                  Expenditure             Inpatient Discharges     Day case discharges
                  ED presentations        WTE numbers

Source: HSE Management Data Reports 2014-2017

This paper also looks at the issue of budget management in hospitals. In the 2012 C&AG report1, the
HSEs ability to plan and manage their budget was identified as a real concern. In 2012, all but one
hospital reported being over budget by end year. The average budget overrun was 8% with the highest
overrun at 60%. By end- 2017 this situation had not improved. Again, almost all hospitals reported
being over budget with an average overrun of 7%. This is a clear indication of the lack of financial
management within the sector and highlights the need for enhanced reform initiatives to drive
efficiencies and productivity.

This paper will present an overview of the current Acute Hospital Sector position in terms of:

      1. Hospital inputs i.e. acute expenditure, pay and staffing resources; and
      2. Hospital outputs – for this paper three metrics have been identified to analyse hospital
         output. These are as follows:
            i.   Inpatient and day case procedure numbers
           ii.   Emergency Department presentations
          iii.   Waiting list numbers
      3. Budget Management

1
 C&AG Report on the Account of the public services. 2012. Available at:
http://www.audgen.gov.ie/viewdoc.asp?fn=/documents/annualreports/2012/Report/EN/Chapter21.pdf
                                                       4
2. Hospital Inputs
Key Findings
Over the period 2014-2017, significant investment in the acute sector has taken place in
terms of both pay and non-pay.
Net spend has increased by 17%, from €4.05bn in 2014 to €4.73bn in 2017.
Of this, net non-pay spend has increased by 30% while net pay spend has increased by 14%.
WTE numbers have also increased by 8,400 or 17%.
Overall, hospital spend has increased by €680m over a three year period. This has allowed
for additional investment in the sector in terms of clinical, non-clinical and staff resourcing.
Acute Spend 2014-2017
Since 2014 investment in the acute sector has consistently grown. Between 2014 and 2017, hospital
spend increased by 17%.
Table 1: Hospital Spend 2014-2017
2014 2015 2016 2017 2014-2017
Gross Spend 4,942 5,173 5,405 5,585 13%
Income - 889 - 948 - 963 - 8522 -4%
Net Spend 4,053 4,225 4,442 4,733 17%
Annual Growth 3% 4% 5% 7%
Source: HSE Management Data Reports 2014-2017
Between 2014 and 2017, expenditure on net pay increased by 14% while net non-pay expenditure
increased by 30%. Figure 4 shows this breakdown over the period. The overall split has been
maintained and remains fairly consistent at c. 20:80 (non-pay/pay) since 2014.
Figure 4: Total Non/Pay Net Spend Split, 2014-2017
4,733
4,442
4,500 4,225
4,053 1,014
4,000 910
843
778
3,500
€ million
3,000
2,500 3,531 3,719
3,276 3,382
2,000
1,500
2014 2015 2016 2017
Pay Non-Pay Total Net Spend
Source: HSE Management Data Reports 2014-2017
2
Until 2017 superannuation income was reported as part of the Acute income line. When superannuation is
excluded for 2014-2016, Hospital income actually increased by €100m or 14%.
5Non-Pay Spend
Non-pay spend can be broken down into “clinical” and “non-clinical” spend. Table 2 below sets out
the different components of each. The split has remained static over the last three years at 67:33.
Table 2 shows that between 2014 and 2017 clinical spend increased by 22% while non-clinical spend
increased by 24%.
The largest driver of clinical spend is hospital drugs. Between 2014 and 2017 hospital drug spend
increased by 34%. In 2016, the State entered into a Framework Agreement with the Irish
Pharmaceutical Healthcare Association (IPHA) for the supply and pricing of a large segment of
medicines. This is a key component in ensuring a range of policy levers can be utilised in a coordinated
way to deliver value for money and access to medicines3. Following the introduction of this agreement
the rate of increase in drug spend has fallen. Between 2015 and 2016, drug spend increased by 10%.
Between 2016 and 2017 drug spend increased by 8%, largely driven by new drugs coming on board.
For non-clinical spend, the most striking finding is that between 2014 and 2017 professional services
increased by 83% - this is largely due to the fact that waiting list initiative funding has been captured
under this heading4. The available data does not show how this waiting list initiative funding is split.
It is assumed that part of this would include some pay cost associated with adding capacity to the
acute system.
Table 2: Gross Non-Pay Spend, 2014-2017
2014 2015 2016 2017 Change 2014-2017
€m €m €m €m €m / %
Non-Pay Clinical
Bloods/Blood Products & Lab 230 241 243 252 22 10%
Drugs 336 378 417 451 115 34%
Med/Surgical Supplies 337 359 378 401 64 19%
Other 119 125 128 143 24 20%
Total Clinical 1,022 1,103 1,166 1,247 225 22%
Non-Pay Non-Clinical
Catering & Cleaning 124 129 137 145 21 17%
Education, Training & IT 39 44 46 48 9 23%
Heat Power & Light 54 54 50 50 - 4 -7%
Maintenance 44 52 57 69 25 57%
Rent & Rates 67 73 83 87 20 30%
Professional Services 36 51 86 66 30 83%
Other 133 143 128 150 17 13%
Total Non-Clinical 497 546 587 615 118 24%
Source: Department of Health
Pay and Staffing
Between 2014 and 2017, expenditure on pay increased by 14% from €3.3 billion to €3.7 billion. In
2017, 79% of net hospital spend was pay as is shown in Figures 5a and b below. Almost 80% of pay
spending is basic pay and allowances. On top of this, Agency pay makes up a further 6% of the total
pay bill.
3
Connors, J. 2017. “Future Sustainability of Pharmaceutical Expenditure”. Available at:
https://igees.gov.ie/wp-content/uploads/2015/02/Future-Sustainability-of-Pharmaceutical-Expenditure.pdf
4
Department of Health. 2017. “Acute Hospital Expenditure Review”. Available at: https://health.gov.ie/wp-
content/uploads/2017/07/170724_DoH-Acute-Hospital-Expenditure-Review_Final.pdf
6Figure 5(a): Breakdown of Non/Pay Spend, 2017 Figure 5(b): Breakdown of Pay, 2017
3% Basic Pay
8%
21% Allowances
0%
6%
5% Overtime
8% Arrears/Other
70% Locum/Agency
79%
PRSI Employers
Pay Non-Pay Superannuation
Source: HSE Management Data Report 2017; HSE Employment Reports 2017
Staffing
The number of WTEs in hospitals has increased by 17% since 2014. This finding is surprising given that
since 2014 a number of pay agreements have been implemented. As a result, the expectation would
be that pay would have grown faster than WTE numbers. Further analysis may be required to identify
what is driving this trend and whether there is some portion of pay spend being captured in the non-
pay line. The graph below shows how staff numbers have increased over the period.
Figure 6: Staff Numbers, 2014-2017
60 3,800
58 3,700
56
3,600
54
WTE numbers
58
52 3,500
€ million
50 3,400
53 56
48 3,300
50
46
3,200
44
42 3,100
40 3,000
2014 2015 2016 2017
End year WTEs Pay spend (RHS)
Source: HSE Management Data Reports 2014-2017
Hospital staff are spread over a wide variety of areas including consultant doctors, non-consulting
hospital doctors (NCHD), nurses, therapists, etc. The largest staff sector is nursing (37%) followed by
management and administration at 15% and Health and Social Care staff at 12%. Figure 7 below shows
the breakdown of staff across the acute sector in 2016.
7Figure 7: Hospital Staff Composition, 2017
4%
Consultants
15% 9%
NCHDs
Nursing
12%
Health & Social Care
37%
Management and
Admin
Source: HSE Employment Report 2017
Data available from 2015 to 2017 shows that there has been a significant investment in staff resources
across all sectors. Proportionately, the three areas that grew most were General Support, Patient and
Client care and consultants. Table 3 shows this breakdown.
Table 3: Acute Staff Numbers by Area, 2015-2017
2015 2016 2017 2015 - 2017
Consultants 2,283 2,408 2,515 10.2%
NCHDs 4,949 5,184 5,403 9.2%
Nursing 20,393 20,819 21,707 6.4%
Health & Social Care 6,740 6,945 7,166 6.3%
Management and Admin 8,099 8,407 8,819 8.9%
General Support 5,735 5,847 5,942 3.6%
Patient and Client Care 5,487 6,267 6,549 19.4%
Total 53,686 55,877 58,101 8.2%
Source: HSE Employment Reports, 2016-2017
83. Hospital Outputs
Key Points
Data from monthly Management Data Reports (MDR) as published on the HSE website has
been used for this analysis.
Between 2014 and 2017, inpatient numbers have fallen by 1% while day-case procedures have
increased by 4%. While the increase in day cases is welcomed and reflects a move towards a
more efficient, cost effective service, the rate of increase is significantly lower than the
increase in spend (17% over the period).
Case complexity rates have increased marginally over the period. However, for inpatient
cases the complexity of cases for the over 65s cohort has actually fallen over the period.
Emergency Department (ED) presentations were up 5% between 2014 and 2017.
Numbers on waiting lists have grown significantly in recent years despite significant
investment year on year. The clear pattern emerging shows a drop in waiting list numbers
following an increase in spend followed by an increase over and above the previous peak.
Overview
In order to estimate productivity gains or losses in the Acute sector, output metrics must also be
measured alongside input metrics. Ideally, hospital output is measured as the number of treatments
adjusted for their quality and success rate. This would link outputs with outcomes and allow for
conclusions around the effectiveness of health care services. However, quality and success are difficult
to measure in a systematic and comparable way – although there are an increasing number of
countries that report Patient reported output measures5.
This section outlines the data and methodology used to examine hospital outputs and presents the
findings for the period 2014 to 2017.
Overall, this chapter establishes a starting point for examining hospital productivity by identifying a
number of output metrics and analysing the trend in these metrics since 2014. In doing so, a number
of information gaps and areas for further analysis are also identified.
Data and Methodology
Data has been sourced from the monthly Management Data Reports produced by the HSE and
published on the HSE website.
Measuring the right hospital outputs is a challenging exercise. Hospital procedures vary widely and
are tailored to patients. For the purpose of this paper, three measurable output metrics have been
identified:
I. Inpatient activity and Day case procedures
These metrics are discharge metrics and are important indicators of hospital activity. The data
is taken from the monthly Management Data Reports (MDR) provided by the HSE. The MDR
5
OECD, Health at a Glance 2017 http://www.oecd-
ilibrary.org/docserver/download/8117301e.pdf?expires=1517505891&id=id&accname=guest&checksum=A4A
6E8D7401475D866BFED78C83FEB81
9shows the number of monthly inpatient cases and day case cases. These numbers are only
presented at the aggregate level and not broken down by any classification. It should also be
noted that the reporting of day case procedures changed in 2015. Prior to this, dialysis
treatment was not included in the day case numbers and was reported separately. Since 2015,
dialysis cases have been included in total day case numbers. For comparison purposes,
dialysis numbers have been added back to the MDR data for 2014.
II. Emergency Department (ED) presentations
ED presentations and discharge numbers allow for the analysis of the demand for emergency
care services and the capacity of the system to manage this. EDs are critical services that form
the frontline of the health care system for patients with urgent care needs. An increase in ED
utilisation may adversely affect patient outcomes, increase health care costs and place further
strain on health professionals’ workloads6.
III. Waiting List numbers
Waiting List numbers are not an output metric in the standard sense however they offer
valuable insight into how well the health system is capable of keeping up with the increasing
demand for care. With growing resources, technological progress and reform there is more
potential to ensure additional demand can be absorbed into the system.
Trend Analysis
(i) Inpatient / Day Case Mix
Inpatient cases are measured by hospital discharge numbers. A discharge is defined as the release of
a patient who has stayed at least one night in hospital. A day case refers to a patient who is admitted
to hospital on an elective basis for care and/or treatment which does not require the use of a hospital
bed overnight and who is discharged as scheduled.7
Moving procedures from an inpatient to day-case setting can improve waiting times by improving the
throughput of cases and reduce hospital costs. In a report published by the C&AG in 20148 the
potential savings that could be achieved by moving inpatient procedures to day-case settings for 24
procedures was estimated to be 60% on average.
Despite this incentive to move towards fewer inpatient cases and more day case procedures,
management data from 2014 to 2017 shows the numbers have stayed relatively flat. Inpatient cases
have fallen by just 1% while day case procedures have increased by 4%. While this increase in day
case procedures is welcomed and fits in well with the international trend to move procedures from
relatively expensive inpatient settings to a day case setting, it falls short of the corresponding increase
in expenditure over the period. Figure 8 below shows monthly inpatient and day case levels between
2014 and 2017.
6
OECD Health Working Papers No. 83, Emergency Care Services, 2015. Available at:
http://www.oecd.org/officialdocuments/publicdisplaydocumentpdf/?cote=DELSA/HEA/WD/HWP(2015)6&doc
Language=En
7
Department of Health and Children, 1993
8
Comptroller and Auditor General Special Report. 2014. “Managing Elective Day Surgery”. Available at:
http://www.audgen.gov.ie/viewdoc.asp?fn=/documents/vfmreports/83_ElectiveDaySurgery.pdf
10Figure 8: Inpatient and day case monthly activity, 2014 - 2017
90,000
80,000
70,000
60,000
50,000
40,000
30,000
20,000
10,000
-
Jan
Jan
Sep
Jan
Mar
Sep
Jan
May
Nov
Mar
Sep
May
Nov
Mar
May
Nov
Mar
Sep
May
Nov
Jul
Jul
Jul
Jul
2014 2015 2016 2017
Day Cases Inpatient Cases
Source: HSE Management Data Reports 2014 - 2017
In order to gain further insight into the disconnect between spend and activity levels, the weighted
unit cost and complexity metrics of inpatient and day case procedures have also been observed.
Inpatient and Day Case Complexity Profile and Costs
Case complexity is often cited as a reason why high level metrics such as discharge numbers should
not be considered in isolation when reviewing hospital output metrics. The reason for this, for
example, is that a heart transplant (highly complex) requires more resources than an appendectomy
(less complex). Table 3 sets out the Case Mix Index9 by age group for public hospitals over the period
2013 to 2017 broken down by inpatient and day cases.
The Department of Health published a paper in 201610 which looked at case complexity levels between
2009 and 2014. During this time the CMI showed an increase of 1.6% for inpatients and 8.5% for day
cases. The table below uses updated data for 2014-2017 to show the change in the CMI.
Table 4: Complexity Profile of Acute Public Hospitals, 2013-2017
Inpatient Day Case
2014 2015 2016 2017 2014 2015 2016 2017
Age CMI CMI CMI CMI CMI CMI CMI CMI
0-4 0.95 0.96 0.95 0.98 1.08 1.07 1.07 1.11
5-14 0.68 0.70 0.69 0.75 1.15 1.12 1.14 1.13
15-44 0.66 0.67 0.69 0.69 0.90 0.90 0.91 0.91
45-54 1.21 1.24 1.25 1.23 0.95 0.93 0.94 0.95
55-64 1.42 1.47 1.47 1.47 0.95 0.92 0.94 0.94
65-74 1.57 1.58 1.58 1.55 0.96 0.92 0.94 0.95
75-84 1.62 1.61 1.62 1.59 0.97 0.96 0.98 1.01
85+ 1.62 1.60 1.58 1.56 1.02 1.04 1.09 1.12
All 1.07 1.09 1.10 1.11 0.96 0.94 0.95 0.96
Source: Department of Health
9
The CMI is a measure of case average case complexity calculated by dividing the number of weighted units of
activity by the number of cases.
10
Department of Health, 2016. “Working Paper on Acute Hospital Finance and Efficiency”. Available at:
https://health.gov.ie/wp-content/uploads/2016/05/Working-Paper-on-Acute-Hospital-Finance-and-
Efficiency.pdf
11During the period 2014 - 2017, inpatient complexity increased by 4%. Interestingly, the inpatient data
shows a decrease in the case complexity index for the over 65s cohort. This is a significant finding as
this is the group typically associated with higher levels of complexity. However, for day cases the
overall increase between 2014 and 2017 is just 0.6%.
The graph below shows the weighted unit cost of inpatient and day case procedures between 2013
and 2016 (data for 2017 is not yet available). During this period the average weighted cost of inpatient
cases increased from €4,300 to €4,600 (7%) while day case procedures increased from €695 to €765
(10%).
Figure 9: % change in Weighted Unit Costs Day Case and Inpatient, 2013-2016
12% 10%
10%
7%
8% 6%
6% 4%
6%
4%
2%
0%
0%
-2%
-2%
-4%2013 2014 2015 2016
Inpatient Daycase
Source: Department of Health
Based on the data shown in Table 4 and Figure 9, unit costs appear to be growing at a much faster
rate than the level of case complexity. It is not clear from the available data what is driving 10%
increase in day case unit costs between 2013 and 2016. This is likely explained in part by changing
pay rates over the period. Further breakdown of data is required.
12Box 1: International Comparison - Changes in NHS Day Case Rates since 1974
In England, day-case interventions increased by almost 150% between 1998 and 2013, from 3m to
7.4m (Berchet, 2015). This move to day case procedures is largely due to a combination of new
surgical and medical advancements and a series of deliberate policy initiatives. It follows on from
the first NHS value for money review carried out by the Audit Commission in 1990. This review
identified 20 common procedures that could be moved to a day case setting and result in an
additional 186,000 patients being treated per year without an increase in expenditure11.
Figure 10 below was published in the British Medical Journal in 2015 and shows the trend in day
case and inpatient numbers over a 40 year period. The proportion of all procedures carried out as
a day case has grown from a low of 7% in 1974 to almost 35% by 201312.
Figure 10: % of all patient activity carried out as Day Cases: England 1974-2013
Emergency Department Presentations
Emergency Departments (EDs) are critical services which form a part of the frontline of the health
service dealing with patients with urgent care requirements. While ED attendances and discharges
are key hospital activity metrics, increasing utilisation rates in this area are not necessarily a positive
outcome. The trend can be reflective of underlying problems in the wider primary and community
care sector. Increasing ED utilisation rates can adversely affect patient outcomes, increase health care
costs and place further strain on health professionals’ workloads (Berchet, 2015).
Table 4 sets out the increase in the average monthly number of ED presentations and discharges in all
public hospitals. An ED discharge refers to a patient who presents at the ED and is subsequently
admitted as an inpatient before being discharged. Between 2014 and 2017, ED total ED presentations
increased by 5% with a corresponding increase of 5% in ED discharges.
11
The Kings Fund. (2015). Better value in the NHS - The role of changes in clinical practice. Available at:
https://www.kingsfund.org.uk/sites/default/files/field/field_publication_file/better-value-nhs-Kings-Fund-
July%202015.pdf
12
https://www.bmj.com/bmj/section-pdf/902322?path=/bmj/351/8019/Feature.full.pdf
13Table 4: Emergency Department presentations and discharges, 2014 -17
2014 2015 2016 2017 2014 - 2017
ED Attendances 1,219,726 1,233,693 1,286,914 1,279,712 5%
ED Discharges 398,103 403,271 418,391 418,562 5%
ED discharge as % of ED Attendances 33% 33% 33% 33%
Source: Department of Health
A large number of inpatients are admitted to the hospital through the ED. In 2017 close to 70% of
inpatient cases where admitted to hospital through the ED. This figure has not changed significantly
since 2015, despite increased screening and investment in primary care.
When taken together, the disconnect between expenditure and outputs in the acute sector
becomes clear. The graph below shows the rate of growth for inputs (i.e. spend and WTE numbers)
and outputs (i.e. inpatient and day case discharge numbers and ED attendances). From the graph
there is no clear relationship between the trajectory of hospital inputs and output levels.
Figure 11: Rate of growth – Spend V Outputs, 2014-2017
0.18
0.16
0.14
0.12
0.10
0.08
0.06
0.04
0.02
-
(0.02)
(0.04)
2014 2015 2016 2017
Expenditure Inpatient Discharges Day case discharges
ED presentations WTE numbers
Source: HSE Management Data Reports 2014-2017
Waiting Lists
In addition to actual output levels, it is important to look at the numbers waiting on procedures. The
numbers on waiting lists can be used as an indicator to show the extent to which the health system is
capable of keeping up with the increasing demand for care. Inpatient and day-case waiting list data is
widely accepted as a reasonable proxy for measuring this and give an indication of the accessibility of
hospital care. With growing resources, technological progress and reform additional demand should
potentially be absorbed into the system.
According to the OECD, long waiting times for elective treatments generally tend to be found in
countries that combine public health insurance or provision with low patient costs sharing and
constraint on capacity. This is indeed what we see in Ireland: in 2017, on average 25,000 people were
on a waiting list for inpatient elective care on any given day. With regards to day case procedures this
figure is as high as 59,000.
14Waiting list data
In Ireland the National Treatment Purchase Fund (NTPF) is responsible for collecting, collating and
validating information on people that wait for hospital treatment. To fulfil its mandate the NTPF has
developed protocols on when a patient should be placed on a waiting list and when a patient should
be taken off. These guidelines should ensure consistency among data list administration and
management.
The common way of being admitted to the hospital for day-case procedures is via an outpatient
appointment after referral by a GP or other community health care professional. When a decision
making clinician decides that a certain procedure is needed the patient is placed on the waiting list.13
A patient can turn down a proposed date only once, and the suspension period can be no longer than
two weeks. However, there might be an issue of duplication, as highlighted by the Department of
Health. For the moment there is no way of validating the number of duplications. We assume that the
number of duplications remains stable over time.
Distribution of waiting times
OECD research found that the mean waiting time for people that are treated is generally higher than
the median waiting time.14 This indicates that the distribution of how long people wait is skewed, with
some people being treated quite quickly and some people waiting long periods of time for the same
non-urgent procedures.
Although there is no data available on the distribution of the waiting time for people that were
treated, we see larger increases in the ‘long’ waiting list than in the overall waiting list. Between 2014
and 2017 numbers waiting on an inpatient procedure increased by 46% while those waiting on a day
case procedure increased by 59%. The proportion of those waiting over 15 months increased by 10
percentage points for day cases and 14 percentage points for inpatient procedures over the same
period. This is demonstrated in the graph below.
Figure 12: Waiting List Numbers, 2014-2017
20% 70,000
60,000
15% 50,000
Numbers
40,000
10%
%
30,000
5% 20,000
10,000
0% -
2014 2015 2016 2017
Average day case waiting Average IP waiting
% day case waiting 15+ mths % IP waiting 15+ mths
Source: National Waiting List Data, NTPF
13
NTPF, National Waiting list management Protocol.
http://www.ntpf.ie/home/pdf/National%20Waiting%20List%20Management%20Protocol.pdf
14
Siciliani, L., V. Moran and M. Borowitz (2013), “Measuring and Comparing Health Care Waiting Times in
OECD Countries”, OECD Health Working Papers, No. 67, OECD Publishing, Paris.
http://dx.doi.org/10.1787/5k3w9t84b2kf-en
15Long waiting lists
Supply side waiting time policies – providing more funding to providers – have proven unsuccessful in
almost all cases in the long run.15 Generally, these policies lead to an initial decrease in waiting times,
but in the medium term there is a return to the initial levels, or sometimes even beyond.
Figure 13: Trend in ‘Long’ waiting lists for Elective Care
12000
10000
7656
8000
6000 4613
4000 3043
2000
0
Jul-14
May-15
Jul-15
Jul-16
Jul-17
May-14
Nov-14
Nov-15
May-16
Nov-16
May-17
Nov-17
Jan-14
Mar-14
Sep-14
Jan-15
Mar-15
Sep-15
Jan-16
Mar-16
Sep-16
Jan-17
Mar-17
Sep-17
Inpatient Day Case Total
Source: Source: National Waiting List Data, NTPF
This is exactly what we see happening in Ireland. Figure 13 shows the trend in the ‘long’ waiting lists
– i.e. people that are waiting more than 15 months – from 2014 to 2017. There is an overall increasing
trend, interrupted by sharp decreases at the end of 2015, 2016, and 2017. These drops correspond
with the times that additional funding for winter initiatives was made available to the HSE. These
initiatives included targeted waiting list reduction by purchasing care in the private sector. However,
after each drop there is a quick return to the previous levels and beyond. It can be concluded that in
line with international experience, supply-side solutions to the problem of long waiting lists have not
resulted in any sustained effect.
15
Siciliani, L., M. Borowitz and V. Moran (eds.) (2013), “Waiting Time Policies in the Health Sector: What
Works?”, OECD Health Policy Studies, OECD Publishing. http://dx.doi.org/10.1787/9789264179080-en
164. Budget Management
Key Points
Data from monthly Management Data Reports (MDR) as published on the HSE website
has been used for this analysis.
In 2012, the C&AG found that all but one hospital reported being over budget at end-year
with an average budget overrun of 8%.
By end-2017, the situation had not improved. All but two hospitals reported being over
budget with an average overrun of 7%.
Despite the introduction of Activity Based Funding and Performance and Accountability
Frameworks, the HSEs ability to effectively manage a budget remains concerning.
Despite significant investment over the last three years and the introduction of a Performance
Accountability Framework in 2016, expenditure management in the Acute sector has not improved.
In the 2012 C&AG Report, a number of concerns were raised regarding the effectiveness of the HSE’s
ability to plan and manage the budget. In 2012, all but one of the 46 hospitals reported being over
budget at end year. The average budget overrun was 8% with the highest overrun reported in Louth
(almost 60%)16. Figure 13 summarises this information:
Figure 14: Hospital budget overrun (%), 2012
Source: C&AG Report on the Account of the public services 2012
When this graph is replicated using the most recent expenditure data to December 2017, it shows a
very similar performance to that outlined by the C&AG in 2012. The outturn for 2017 has been plotted
against the original hospital budget allocations set in January 2017. In this way it can be seen that the
systemic issue of hospital overruns has not been addressed and as at December 2017 all but two
hospitals reported being over budget with the average overrun being 7%.
16
C&AG Report on the Account of the public services. 2012. Available at:
http://www.audgen.gov.ie/viewdoc.asp?fn=/documents/annualreports/2012/Report/EN/Chapter21.pdf
17Figure 15: Hospital budget overrun (%), 2017
15%
10%
5%
0%
-5%
-10%
Source: HSE Management Data Report 2017
Activity Based Funding (ABF)
Until 2016 hospitals were funded on a block grant basis. This meant hospital funding was provided on
the basis of the outturn of the previous year with adjustments made for the following year. In 2016,
ABF was introduced in 38 hospitals. The aim is to allocate a budget to each hospital based on the
number and complexity of the patients that they are expected to treat in the coming year. Under this
model, hospitals should only receive funding up to the agreed target level of activity and funding can
be removed where hospitals fail to meet the agreed target level of activity. Only Inpatient and Day-
case procedures are covered under ABF. All other activity is block funded.
In order to avoid instability in funding levels and to allow time for the acute hospital system to adjust
to the new ABF funding system, the new model incorporates additional payments called “transition
adjustments”.
Performance and Accountability (PAF)
In addition to ABF, the HSE introduced an Accountability Framework in 2015. It measured performance
with regard to patient access to services, the quality and safety of the services provided, the ability to
provide these services within the financial resources available and management of the workforce.
In November 2015, the HSE commissioned a review of the Accountability Framework which was
undertaken by David Flory17. The review concluded that the Framework would benefit from a more
consistent approach in the application of the intervention and escalation elements and included a
series of recommendations to enhance productivity. These recommendations included a bottom-up
approach to financial management whereby hospitals would produce their own performance
productivity plans and identified a productivity target of 2% p.a. as reasonable.
Despite continued underperformance to end-2017 and consistent budget overruns, these
recommendations still do not appear to have been implemented – as yet hospitals are not producing
individual productivity plans and based on the trends observed since 2014 output levels are not
increasing in line with investment. Overall, the existing Performance and Accountability Framework
appears to be limited in its effectiveness.
17
Flory, D. 2015. “Review of the HSE Performance Accountability Framework”.
185. Conclusion
Between 2014 and 2017, investment in the Acute sector increased substantially from €4.05bn to
€4.7bn (an increase of 17% over three years). Pay spend increased by 14% while non-pay spend
increased by 30% over the period and staff resources are up by 8,400 WTEs (17%).
While spend has increased dramatically and consistently over the last three years, outputs and activity
metrics have not mirrored this trend. The increases observed in terms of day case activity and ED
attendances cannot explain the increase in spend that has been witnessed. Despite the efficiencies
and cost savings associated with moving away from inpatient treatment where possible, day cases
have increased by just 4% over the three year period with inpatient numbers remaining relatively flat,
falling by 1% over the period. Furthermore, case complexity rates have not been increasing at a fast
enough rate to explain the slower than expected increase in inpatient and day case rates.
In addition to this, waiting list numbers continue to increase. Between 2014 and 2017 numbers
waiting on an inpatient procedure increased by 46% while those waiting on a day case procedure
increased by 59%. The proportion of those waiting over 15 months increased by 10 percentage points
for day cases and 14 percentage points for inpatient procedures over the same period. This is despite
ongoing investment to tackle waiting list numbers which, as is shown in the data, serves to have a
short term effect on reducing the waiting list numbers before returning to and exceeding peak levels.
The ability of the Health Service to manage the hospital budget appears to have consistently failed.
This is most clearly demonstrated in the performance of hospitals against budget. The C&AG Report
of 2012 raised concerns as all but one hospital reported being over budget by the year end. At the
end of 2017, this situation remains to be the case with all but two hospitals reporting being over
budget. This lack of improvement, despite the introduction of Performance and Accountability
Framework, shows that measures undertaken to manage hospital expenditure continue to fall short
of expectation.
Using the data available for the last three years to analyse the trend in hospital spend compared with
outputs there is a clear disconnect between the increased investment made and the subsequent
improvement in terms of output levels. Hospital expenditure continues to grow year-on-year while
outputs and waiting list numbers stagnate or deteriorate. Efforts to implement and reform
Performance and Accountability Frameworks appear limited in their effectiveness to date.
Consideration should be given to efficiency and productivity reform recommendations put forward in
previous reports (e.g. the 2015 Review of the HSE Performance Accountability Framework by David
Flory) to ensure the sustainability of the Acute sector in the long term. Linked to this, previous
commitments have been made with regard to the expansion of primary care and improvements in the
area of community/ integrated care to ensure patients can avail of the care they need in the most
appropriate setting. If progressed effectively, this should lead to a reduced demand for hospital
services thereby reducing the pressure on the Acute sector.
19Quality assurance process
To ensure accuracy and methodological rigour, the author engaged in the following
quality assurance process.
✓ Internal/Departmental
✓ Line management
✓ Spending Review Steering group
✓ Peer review (IGEES network)
✓ External
✓ Other Government Department
20You can also read