Spherulitic and rotational crystal growth of Quartz thin films
←
→
Page content transcription
If your browser does not render page correctly, please read the page content below
www.nature.com/scientificreports
OPEN Spherulitic and rotational crystal
growth of Quartz thin films
Nick R. Lutjes, Silang Zhou, Jordi Antoja‑Lleonart, Beatriz Noheda & Václav Ocelík*
To obtain crystalline thin films of alpha-Quartz represents a challenge due to the tendency for the
material towards spherulitic growth. Thus, understanding the mechanisms that give rise to spherulitic
growth can help regulate the growth process. Here the spherulitic type of 2D crystal growth in thin
amorphous Quartz films was analyzed by electron back-scatter diffraction (EBSD). EBSD was used
to measure the size, orientation, and rotation of crystallographic grains in polycrystalline SiO2 and
GeO2 thin films with high spatial resolution. Individual spherulitic Quartz crystal colonies contain
primary and secondary single crystal fibers, which grow radially from the colony center towards its
edge, and fill a near circular crystalline area completely. During their growth, individual fibers form
so-called rotational crystals, when some lattice planes are continuously bent. The directions of the
lattice rotation axes in the fibers were determined by an enhanced analysis of EBSD data. A possible
mechanism, including the generation of the particular type of dislocation(s), is suggested.
The synthesis of piezoelectric epitaxial Quartz thin films with submicron thicknesses seems to be a serious
challenge towards further miniaturization of oscillator circuits. Recently, we reported the successful solid-state
crystallization of pure G eO2 amorphous thin films into a α-Quartz (piezoelectric) structure via control of the
crystallization temperature1. Pulsed laser deposition (PLD) was used to prepare approximately 140 nm-thick
amorphous films of GeO2 on different crystalline substrates. It has been observed, that columnar and dendritic
growth take place at high crystallization temperatures (> 870 °C). Spherulitic crystal growth was promoted at
lower temperatures (< 850 °C), often accompanied by a gradual crystal rotation inside individual spherulite fib-
ers. Two-dimensional spherulites are made of fibers that grow radially, starting from one nucleation core and
conferring the typical circular shape. Generally, spherulites are formed by a non-crystallographic branching
mechanism2–4, where the parent and daughter fibers do not share the same crystal orientation. The misorienta-
tion angles between neighbor fibers typically range between 0° and 15°3. The non-crystallographic branching
mechanism of growth distinguishes spherulites from other-branched crystals and polycrystalline aggregates
possessing round f orms3.
A 2D spherulitic growth during solid recrystallization of an amorphous thin film is not new. Pure selenium,
Se containing compounds, as well as α-Fe2O3, and some organic chemistry compounds showing spherulitic
crystallization have been r eviewed3. However, the unique 2D spherulitic growth Quartz structure has not been
reported thus far. Some basics of trigonal symmetry of α-Quartz crystal are summarized in “Supplementary
Information” (SI), together with a short notation of few important crystallographic p lanes5.
Scanning electron microscopy (SEM) and Atomic Force Microscopy (AFM), which are typically used to
identify growth morphologies, often fail to differentiate between spherulites and crystallographic grains, due
to the fact they are unable to provide crystallographic i nformation6. Instead, Electron Back-Scatter Diffraction
(EBSD), which offers a combination of the high lateral resolution of SEM and information about local crystal
orientation, is an excellent technique to study these objects.
Besides non-crystallographic branching leading to the formation of individual fibers in Quartz thin film
crystallization1, a gradual crystal lattice rotation inside each fiber is also observed through EBSD. This kind of
crystal growth has already been reported as micron-sized trans-rotational 2D crystals of FeO7 and SbTe8, formed
by thermally-induced crystallization of amorphous thin films during in-situ experiments in a transmission elec-
tron microscope. These films were not thicker than 40 nm. However, lattice rotation gradients were sometimes
extremely high (up to 100°/µm). Savytskii et al.9 reported large scale rotating lattice single crystals growth on the
surface of bulk S b2S3 glass. Surface crystallization was the result of a solid-state transformation, induced by local
surface heating with a continuous-wave laser beam spot. Subsequently, the laser spot movement on the sample
surface with a constant speed resulted in a crystalline track of about 1.5 µm thick, 5 µm wide and up to 90 µm
long. Different crystal rotation gradients between 0 and 0.6°/µm were observed. The authors in that study also
used EBSD to determine crystal lattice orientation, combined with scanning X-ray micro-diffraction, which has
Zernike Institute for Advanced Materials, University of Groningen, Nijenborgh 4, 9747 AG Groningen, The
Netherlands. *email: v.ocelik@rug.nl
Scientific Reports | (2021) 11:14888 | https://doi.org/10.1038/s41598-021-94147-y 1
Vol.:(0123456789)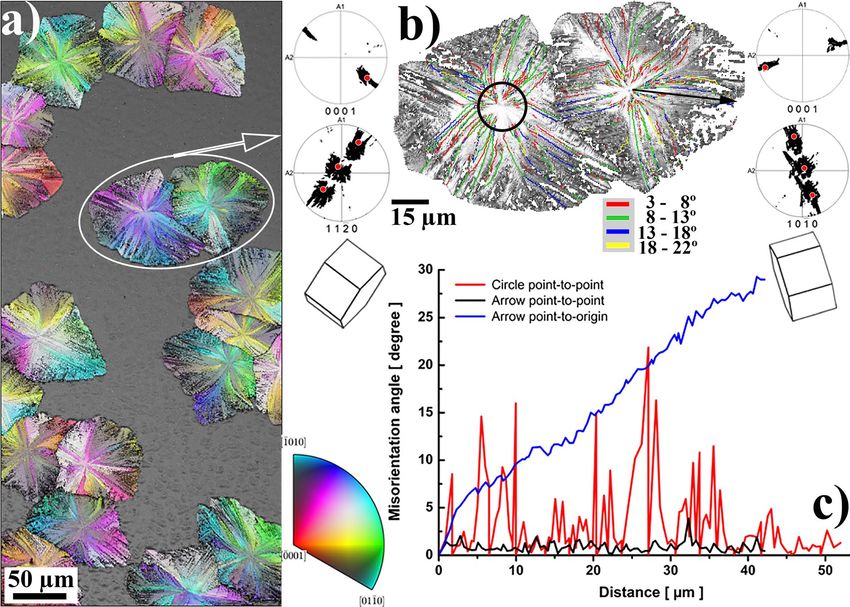
www.nature.com/scientificreports/
much higher orientational accuracy. EBSD has relatively good spatial resolution (in our case estimated as 50 nm).
However, its accuracy in the determination of crystal orientation is considered to be relatively low (typically
1°–2°), and dependent on many experimental parameters. Nonetheless, the angular resolution in the determina-
tion of misorientation between two points on the same EBSD map is one order of magnitude b etter10. This is an
important fact, because in our further analysis we will also determine a second misorientation parameter, i.e.
the misorientation axis. This helps to study the origin and character of the crystal strain, and to understand the
role of dislocations in such rotational crystal growth.
Changes in crystal orientation during its plastic deformation occur by the action of dislocations on specific
crystallographic slip systems. Each slip system comprises the slip plane and the slip direction within this plane.
Importantly, the deformation by a particular slip system is associated with a crystal rotation along an axis char-
acteristic for that slip system11. This rotation axis is orthogonal simultaneously to the slip plane normal and the
slip direction. The Inverse Pole Figure (IPF), given in Fig. S1c in the “SI”, shows directions of the crystal rotation
axes characteristic for all experimentally observed dislocation slip systems in Quartz. Details of these slip systems
are summarized in Table S1 in “SI”.
Thus the scientific goal of our study is a detailed description of the 2D spherulitic crystallization of S iO2 and
GeO2 amorphous thin films using EBSD. Analysis of lattice misorientation data should also clarify the origin
and mechanisms of Quartz crystal deformations during trans-rotational growth of individual spherulitic fibers.
Experimental
Thin films of G eO2 were deposited on M gAl2O4 substrates (CrysTec GmbH) with a 248 nm KrF pulsed laser
(Lambda Physik COMPex Pro 205). The Pulsed Laser Deposition (PLD) parameters were reported in detail
elsewhere1. After deposition, the amorphous film was annealed at 830 °C for 30 min. The thicknesses of the thin
films were estimated to be about 120 nm from X-ray reflectivity (Panalytical X’Pert, CuKα radiation) and the
surface morphology was imaged by an AFM (Bruker Dimension Icon).
To create S iO2 amorphous thin films, we deposit Sr particles on the p-Si(100) substrates by ablating a target
of compacted, dendritic Sr in the PLD chamber using 30 pulses at 1 Hz repetition rate. Afterwards, the sample
was transported in air to a Picosun R-200 Advanced hot-wall Atomic Layer Deposition (ALD) system. Using
bis(diethylamino)silane (BDEAS) and ozone (generated by an INUSA Ozone Generator) as precursors, a S iO2
layer was grown, at a process temperature of 300 °C. We use 600 ALD cycles, which on a blank Si substrate grow
25 nm of SiO2 using the same process parameters. Finally, the sample was annealed by ramping at 20 °C/min to
1000 °C, staying there for 5 h, and then cooling down passively to room temperature, all under an oxygen flow
of 12 L/h.
The annealed films were studied using a FEI Nova NanoSEM field emission gun scanning electron microscope
(SEM), equipped with Electron Back-Scatter Diffraction (EBSD) from EDAX. An acceleration voltage of 20 keV
and a beam current of about 2 nA were used, together with the low vacuum mode (chamber pressure of 50 Pa)
to avoid sample surface c harging12. The sample normal was tilted 71° towards the electron beam.
Kikuchi patterns were framed using a Hikari CCD camera with speed of 10–30 frames/s. EBSD data were
collected by OIM DC 7.3 (EDAX Inc) software, using online pattern i ndexing13 by detection of 12–14 Kikuchi
bands to avoid “pseudo-symmetry” problems reported for Quartz-type crystals14. It has been experimentally
determined that the above mentioned parameters result in a successful collection of EBSD data when the step
size between neighboring scanning points (hexagonal grid) was not smaller than 100 nm. Smaller step size,
higher electron beam acceleration voltage, larger electron beam current or slower map scanning speed usually
resulted in a local crystal damage, which limits the resolution of the scan in order to retain good quality Kikuchi
patterns for the complete beam scanning area.
OIM Analysis 8.1 (EDAX Inc) software together with M TEX15, a free extension for MATLAB R2020b (The
MathWorks Inc), were used to: (1) clean and analyze EBSD data; (2) calculate grain boundaries and crystal
misorientations; (3) plot EBSD maps, pole figures and orientation distributions. A gentle, two step data cleaning
procedure was applied to remove speckle points from EBSD maps. The procedure starts with Grain Confidence
Index Standardization (setting a grain tolerance angle of 3°, minimum grain size of 5 pixels at multiple rows),
followed by a Neighbor Orientation Correlation procedure (level 4, tolerance 3, and a minimal Confidence Index
(CI) of 0.1). Only the second data cleaning treatment step may change the crystal orientation in some scanning
points (typically < 4%). Finally, we remove all data points where the CI remains smaller than 0.1. In these points
the determined crystal orientation is not reliable, and therefore these points were dismissed before performing
any calculations and plots (shown as white points in the presented EBSD maps). Trigonal Quartz crystal sym-
metry is properly colorized in crystal orientation maps generated by MTEX p ackage16, and therefore the maps
are plotted via this tool in this work. The common approach to visualize the orientation of trigonal crystals by
an hexagonal lattice with three-fold symmetry around the c-axis is u sed17.
Results and discussion
Typical results of EBSD observation of a GeO2 thin film after crystallization heating are shown in Fig. 1. The film
exhibits relatively large crystalline areas (from tens to hundreds of µm in size) with Quartz crystal symmetry, as
the IPF map (crystal direction normal to the sample surface) in Fig. 1a from Zhou et al.1 clearly demonstrates.
Crystalline areas are sometimes isolated by an amorphous surrounding, occasionally touching each other and
forming features resembling incomplete 2D Voronoi polyhedral t essellation18. These are formed via: (1) nuclea-
tion in randomly distributed points; followed by (2) stellular 2D growth from nucleation centers, sometimes
isolated in an amorphous surrounding, sometimes halted in their growth by the presence of another crystalline
object that grew from a neighboring nucleation point. The crystalline objects, shown in Fig. 1a, clearly exhibit
all characteristics of spherulitic crystal growth reviewed by Shtukenberg et al.3.
Scientific Reports | (2021) 11:14888 | https://doi.org/10.1038/s41598-021-94147-y 2
Vol:.(1234567890)
www.nature.com/scientificreports/
Figure 1. EBSD observations of spherulitic GeO2 Quartz crystal islands. (a) IPF map (color) of crystal
directions perpendicular to the thin film surface, combined with Image Quality (IQ) map (gray scale) from
Zhou et al.1; (b) the IQ map of two selected spherulites with misorientation boundaries added for orientation
differences > 3°, marked by the corresponding colored lines. Side insets show the axonometric projections
of crystal orientation at the center of these two spherulites, together with their corresponding (0001), (1120)
and (1010) pole figures, on which orientations of the spherulite centers are marked by red points; (c) crystal
misorientation angle profiles measured: (1) along the black circle around the center of the left spherulite on
(b); (2) along the black arrow from the center to the edge of one fiber of the right spherulite on (b). The crystal
direction color key is valid for the IPF map shown in (a).
A detailed IQ map shown in Fig. 1b displays misorientation boundaries between individual crystallites having
mutual misorientations larger than 3°. Two inserted axonometric projections of the Quartz crystal lattice depict
the crystal lattice orientation of the central part of both spherulites in Fig. 1b. The spherulite on the left side
nucleates with its direction almost parallel to the film surface normal. In the case of the right spherulite,
nucleation happened with the crystal direction almost parallel to the surface film normal. These two
nucleation orientations are also marked in the attached (0001), (1120) and (1010) pole figure insets as red points.
These pole figures contain the orientations of all corresponding spherulite points, forming clouds of small black
dots. It is clear that the nucleus orientation defines “a main” orientation and all other crystal orientations in the
spherulite slightly deviate from it as the spherulitic crystalline object grows. This growth is realized either via
primary fiber growth from the nucleation center without the formation of small angle grain boundaries (> 3°), or
via so-called non-crystallographic b ranching3, when new sub-crystals (secondary fibers) with a small misorienta-
tion (3°–22°) heterogeneously nucleate on the side of an already growing fiber and grow further as new fibers,
also mostly in radial directions. A detailed procedure on how primary and secondary fibers were individualized
inside each spherulite can be found in the “SI”.
Internal and inter-fiber crystal misorientations are shown in Fig. 1c. The point-to-point crystal misorienta-
tion angle along the black circle around the nucleation point of the left spherulite (Fig. 1b), is shown by the red
line. The point-to-point misorientation angle inside one fiber does not exceed 3°, while misorientations at fiber
boundaries vary between 3° and 22°, which is typical for spherulitic g rowth3. Non-crystallographic branching
is probably a consequence of anisotropic crystal growth. Main primary fibers grew radially from the nucleation
center in directions of fast Quartz crystal growth, leaving some amorphous residual areas in between. These areas
then crystallize via nucleation and subsequent growth of secondary or even tertiary fibers. All these “daughter”
fibers have their orientations slightly different from primary ones (3°–22°), with preferable grow directions
being able to fill amorphous residuals between primary fibers. A slight misorientation between primary and
Scientific Reports | (2021) 11:14888 | https://doi.org/10.1038/s41598-021-94147-y 3
Vol.:(0123456789)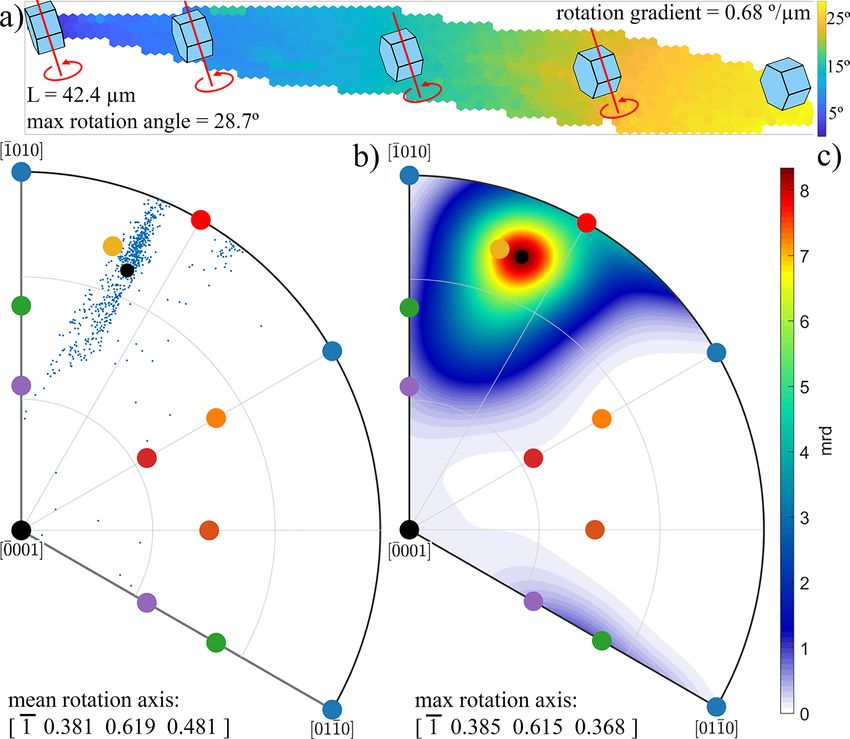
www.nature.com/scientificreports/
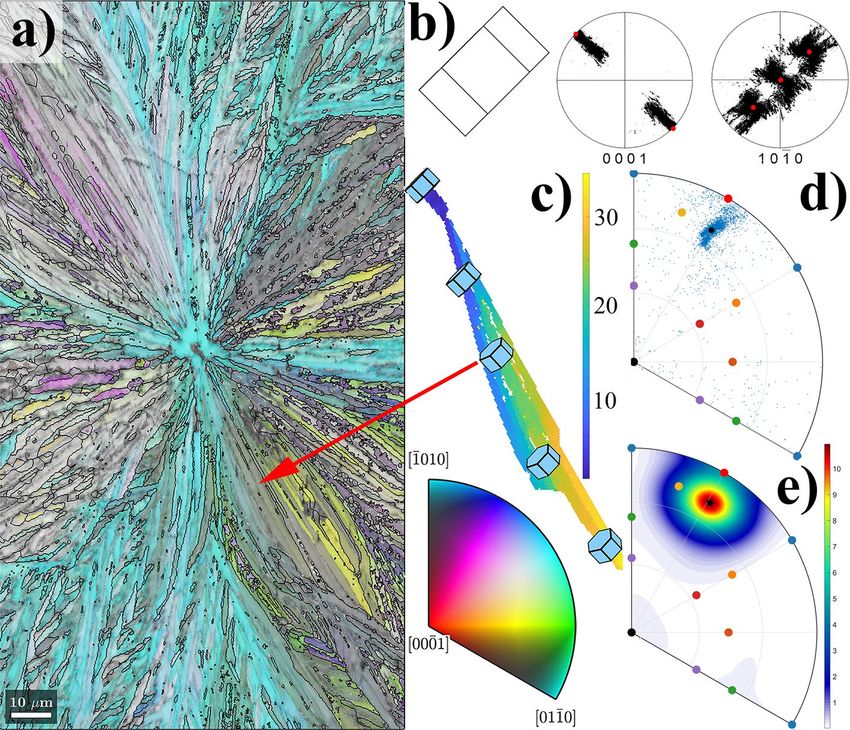
Figure 2. Crystal misorientation analysis of an individual fiber; (a) misorientation angle map of one horizontal
fiber from the right spherulite on Fig. 1b. Color denotes the misorientation angle, between a local point and
the leftmost fiber point (close to spherulite nucleation orientation). Local lattice orientation is shown in a few
points, together with rotation axis and direction; (b) IPF of the rotation axis directions observed between the
most left point and all other points in the fiber. The mean rotation axis direction is shown by a small black circle;
(c) IPF of the calculated rotation axis distribution. The distribution maximum is shown by a small black circle;
rotation axes of all common slip systems from Fig. S1c and Table S1 from “SI” are also marked in both IPFs.
secondary fibers is the consequence of the aforementioned non-crystallographic branching, typical for spheru-
litic crystallization3.
However, as further analysis has shown, Quartz crystal fibers do not grow as a crystal with a single, fixed
crystallographic orientation. For instance, the black and the blue lines in Fig. 1c, respectively show the point-
to-point and point-to-origin crystal lattice misorientation profile along the black arrow running in one primary
fiber, from the center to the edge of the spherulite on the right side of Fig. 1b. The fiber growth is, thus, clearly
associated with a small misorientation between neighboring fiber points, that gradually accumulates and gives
rise to a larger overall misorientation between the nucleation point and all other points of the fiber. The misori-
entation angle increases almost linearly with the distance from the nucleation center, achieving relatively large
values at the edge of the spherulite. The average gradient of crystal rotation angle, grad(ϕ) along the axis of the
primary fiber selected in Fig. 1b was estimated as 0.68°/µm, and the overall accumulated misorientation between
the nucleation center and the edge of the spherulite amounts to 29°. Such behavior of monotonous increase of
crystal misorientation angle along the fiber growth direction was observed for all randomly selected fibers inside
all spherulites presented in Fig. 1a, with gradient variations between 0.3 and 1.5°/µm. The monotonous increase
character of the blue curve in Fig. 2c suggests that, during growth, the Quartz crystal gradually rotates over the
same axis, with a small rotation angle between neighboring points, but a much larger accumulated rotation
angle for a longer distance. The above mentioned crystal rotation gradients correspond to crystal bending with
curvatures between 5 × 10³ and 26 × 103/m3.
During the collection of EBSD data, crystal orientation is measured at every point of the scanning area and
expressed as a triplet of Euler angles, determining the crystal orientation with respect to the Cartesian sample
coordinate system19. However, to study misorientation between two different crystal orientations, when one
of them is chosen to be the reference orientation, the so-called angle/axis misorientation formulation is often
Scientific Reports | (2021) 11:14888 | https://doi.org/10.1038/s41598-021-94147-y 4
Vol:.(1234567890)
www.nature.com/scientificreports/
used. In this approach, the original Euler angles data of both orientations are used to find the crystal direction
that is not changed, when the crystal with the reference orientation is transformed to another one. The whole
transformation can then be described by a rotation around an axis having such a crystal direction, using the
rotation angle that transforms one crystal orientation to a nother20.
Figure 2 summarizes the results of a detailed crystal misorientation analysis of EBSD data of one single
primary fiber as studied in Fig. 1c, analyzed using the following procedure. The point with crystal orientation
closest to the spherulite’s nucleation orientation has been marked as the “reference point”. The misorientation
(containing the misorientation angle and rotation axis) between this reference point and all other points in the
fiber has been calculated.
Figure 2a shows the misorientation angle size map of the whole fiber, with clear evidence that the accumulated
misorientation angle increases with distance. Axonometric projections of the Quartz crystal orientation demon-
strate the local lattice orientation in a few selected points of the whole fiber. From the maximum misorientation
angle (28.7°) and the whole fiber length (42.4 µm), the lattice rotation gradient is estimated to be 0.68°/µm.
The rotation axis directions calculated for all 754 fiber points are shown via IPF in Fig. 2b. Few rotation axes
seem to be distributed randomly, which corresponds with misorientations calculated for fiber points located close
to the reference pixel. For these points, the measured value of the misorientation angle and the determination
of the misorientation axis is close to the resolution limit of EBSD t echnique21, and therefore suffers from large
experimental errors. In any case, the majority of rotation axis directions, shown in Fig. 2b, are well concentrated
in the vicinity of one crystal direction marked by the yellow dot. In reality, the calculated mean rotation axis,
as well as the maximum of their distribution (Fig. 2c), are both very close to this rotation axis direction. This
rotation axis belongs to the action of the {z} slip system in Quartz (see Fig. S1c in “SI”). The projection
of this crystal direction is also shown on the misorientation map (Fig. 2a) as red lines, together with an arrow
showing the direction of rotation.
A short discussion concerning the elongated spread of misorientation directions, shown in IPF on Fig. 2b, is
required. A possible cause of the elongated spread could be explained by the fact that we did not analyze misori-
entations between neighboring points. Such analysis should be correct, because the lattice strain is gradually built
from one point to another by a continuous lattice rotation. However, the misorientation between neighboring
points is too small for a proper rotation axis determination based solely on EBSD data. Therefore, we assume
the same or very similar direction of misorientation axis between all neighboring points inside one fiber. Such
assumption is supported by the monotonous increase of the misorientation angle with distance between points,
and allows the analysis based on calculation of misorientations between fiber points at larger distances.
Savytskii et al.9 determined the direction of the crystal rotation axis by observing a color change on IPF maps,
plotted in three perpendicular sample directions. They concluded that the crystal lattice appears to rotate about
the tangent axis that lies in the plane of the substrate and perpendicular to growth direction22. However, our
analysis allows for a more precise determination of the mean direction of crystal lattice rotation during the fiber
growth. We calculated a 94° angle between the averaged direction of the crystal rotation axis and the direction
of fiber growth. For all other analyzed fibers this angle is found to be close to 90°.
Based on this observation, we may conclude that the relatively simple model proposed by Kooi and De
Hosson8, is a good description of the observation. In this model, a crystal lattice plane, originally parallel to the
surface, is gradually pushed and curved during rotational crystal growth in the direction towards the amor-
phous substrate, as a consequence of the decrease in specific volume over the crystallization front. The model
assumes that the position of the crystallization front near the surface is ahead of this front near the substrate. In
the model proposed by Savitskii et al.9, the same assumption concerning the shape of the crystallization front
is required. A generation of one type of dislocations, directly at the glass/crystal interface, is anticipated, again
as a consequence of the different densities between the glassy and the crystalline state. However, even though
both models use the same assumptions, the latter directly introduces crystal dislocations as carriers of crystal
plasticity, while the former also allows pure elastic bending. In our analysis we will focus on the dislocation
model9, and use the assumption that all these dislocations generated at the glass/crystal interface form a cloud
of geometrically necessary dislocations (GNDs) responsible for the “bending” of the whole crystal lattice inside
the crystal. The selection of the dislocation model instead of the elastic bending one is motivated by other
experimental observations performed on the same materials in a work recently published by our lab1. In these
observations the system of regular sharp surface steps inside crystallized areas was identified as dislocations slip
bands. A substantial advantage of our analysis using current EBSD data is that we may determine two quantities
simultaneously: (1) the bending lattice strain from the gradient of the misorientation angle; and (2) the type of
dislocations responsible for such bending, derived from the mean direction of the rotation axes, which according
to Fig. S1c and Table S1 from “SI” may identify responsible slip systems.
With the aim to prove this concept, a similar analysis has been performed on another fiber of spherulite shown
on the right side of Fig. 1b. The fiber in Fig. 3a grows from the same spherulite center as the fiber analyzed in
Fig. 2. It initially grows in the north direction in the image, and gradually turns onto a north-east direction. The
misorientation analysis is summarized in Fig. 3, which shows the misorientation map between the reference point
and all other points of this fiber (see Fig. 3a) and the rotation axis direction analysis (see Fig. 3b,c).
Again, a clear increase of the misorientation angle with distance from the spherulite center is observed, as
shown in Fig. 3a. A similar value of the gradient of lattice rotation angle (0.62°/µm) was also detected in this
fiber. However, as expected from the aforementioned model, the direction of the crystal lattice rotation axis is
completely different. The reference point (the lowest point on the map shown in Fig. 3a) has the same crystal
orientation as the reference point in previous fiber analysis (Fig. 2), but the fiber initially grew in a different direc-
tion, about 90° apart from that of the fiber in Fig. 2. Using the assumption of the model, that is, a plane originally
parallel to the sample surface (a crystal plane close to (1010) in Fig. 3a), is being pushed towards the substrate
during the fiber growth, one expects the lattice rotation axis direction to be close to [0001] crystal direction.
Scientific Reports | (2021) 11:14888 | https://doi.org/10.1038/s41598-021-94147-y 5
Vol.:(0123456789)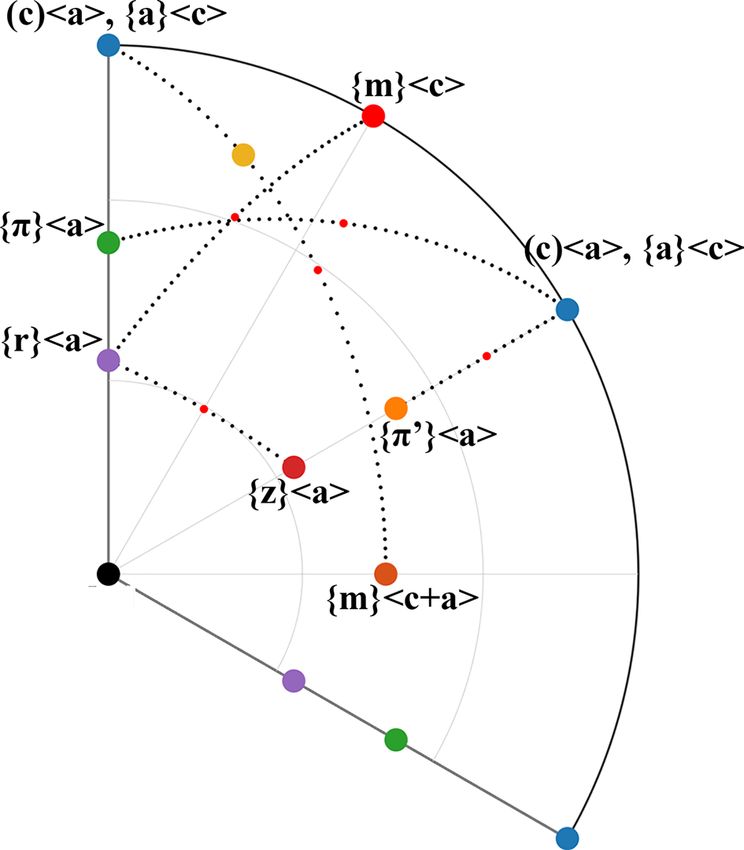
www.nature.com/scientificreports/
Figure 3. Misorientation analysis in an individual fiber; (a) misorientation angle map of one vertical fiber in
the right spherulite on Fig. 1b. Color denotes the misorientation angle, between a local point and the lowest
fiber point (close to spherulite nucleation orientation). The local Quartz lattice orientation is shown in a few
points. (b) Rotation axis directions observed between the lowest point and all other points in the fiber. The mean
rotation axis direction is shown by a small black circle. (c) Calculated rotation axis distribution. The distribution
maximum is located in the [0001] direction. Rotation axes of all common slip systems from Fig. S1c and
Table S1 from “SI” are also marked in both IPFs.
The calculated mean and maximum rotation axis directions shown in Fig. 3b,c agree with this assumption: the
maximum of the distribution of rotation axes is located exactly in the [0001] crystal direction, while the mean
direction is just slightly inclined from it, along the [ 0.0550.2410.1861] direction. Such a difference between the
mean and the maximum direction is the result of an asymmetry in the distribution of the calculated rotation
axis directions, between the reference point and all other points of the fiber. We suspect that such an asymmetry
arises from the fact that the analyzed fiber shown in Fig. 3a changes its growth direction slightly. Therefore, an
assumption of a fixed direction of lattice rotation axis is not fully justified. Nevertheless, the observations are
consistent with the active role of dislocations having slip system {m} (see Fig. S1 in “SI”).
The observed evidence that the crystal rotation axis is determined by its growth direction seems to be a deter-
mining factor for the spherulitic shape of region formed by the nucleation point and the subsequently grown
crystalline areas. The fact that each growth direction has its own crystal rotation axis inhibits the formation of
large 2D single crystals. Narrow fibers with individual points having their rotation axis (relative to the orientation
of the nucleation point) in the vicinity of one crystal direction, are formed instead. From the previous analysis it
also seems that these “allowed” orientations of the crystal rotation axis are determined by common slip systems,
summarized for the Quartz crystal in Table S1 in “SI”.
The origin of the trans-rotational crystal lattice formation analyzed above is also established using addi-
tional characterization techniques. Figure 4 shows the AFM observation of an area of the interface between the
spherulitic crystal and its amorphous surrounding, displayed from top (Fig. 4a) and three dimensional (Fig. 4b)
view. A substantial sharp drop in height (23 nm) from the amorphous to the crystalline area is clearly observed.
Moreover, a small (4 nm) glassy hill at the crystallization front is always present. Knowing the thickness of the
deposited glassy film (~ 120 nm), and assuming mass conservation, we estimate that the density increase during
crystallization is about 16.5%. This value is similar to the difference in density between amorphous G eO2 and
its Quartz-type crystal structure (~ 18%)23. The whole height change, between glassy and Quartz state, happens
over a distance of about 600 nm (the change of profile in Fig. 4c does not appear so sharp due to the averaging
effect of a few profile lines that are not perpendicular to the sharp interface). Therefore the slope of the surface
profile along the interface is only ~ 3° over a distance of about 600 nm.
Scientific Reports | (2021) 11:14888 | https://doi.org/10.1038/s41598-021-94147-y 6
Vol:.(1234567890)www.nature.com/scientificreports/
Figure 4. Crystalline/Amorphous (C/A) interface profile studied by AFM. (a) Top view of spherulite/
amorphous coating interface. (b) The same area shown in 3D view. (c) Height profile along the arrow shown in
(a). Height averaged over 9 lines close and parallel to the arrow.
Figure 5. Schematic of the dislocation model of rotating crystal fiber growth from an amorphous film to
explain the stress accommodation that takes place at the interface between low-density glass and high-density
crystalline α-Quartz, based on ideas from8, 9. Dashed lines represent the bent lattice planes.
Using a slight modification of the models8, 9, we propose the following explanation, sketched in Fig. 6. We
will assume that the crystallization front near the surface is ahead of the front in the vicinity of substrate and
that this front propagates as a whole in a direction parallel to the film/substrate interface. During crystalliza-
tion, substantial densification by shrinking along the glass/crystal interface must happen. For a thin film, the
increase in density particularly occurs perpendicular to the free surface, because only in this direction the shape
change is u nconstrained8. From the observed 4 nm hill formed at the crystallization front, it seems that the rate
of height shrinking along the crystallization front by diffusion is slower than the propagation rate of the glass/
crystal interface. The formation of one type of dislocations on the crystalline side of this interface is anticipated
by using an analogy to hetero-epitaxial crystal growth with misfit dislocations appearing periodically to compen-
sate for the lattice parameter m ismatch9. An additional half-plane appears on the crystal side, due to a smaller
distance between atoms (higher density) of the crystalline state. These unpaired dislocations, initially appearing
at the interface, remain in the growing crystal volume. They act as GNDs, generating a continual lattice bend-
ing, responsible for the spherulite structure. This is marked in Fig. 5 by a set of curved lattice planes, initially
parallel to the surface (left side of Fig. 5), and gradually being bent towards the substrate during crystal growth.
Scientific Reports | (2021) 11:14888 | https://doi.org/10.1038/s41598-021-94147-y 7
Vol.:(0123456789)www.nature.com/scientificreports/
Combining our observations with those of Savytskii et al., we see that for this type of crystalline film growth,
a crystalline substrate does not play a substantial role. Nuclei could be epitaxial with the crystalline substrate,
but as the fibers start to grow and the crystallization front forms a shape similar to Fig. 5, the epitaxy between
substrate and fiber disappears due to fiber lattice rotation. However, as we observed in Fig. 1, sometimes the
nucleation of spherulite centers was not epitaxial.
A simple estimation of the maximum strain value in the crystal fiber is possible from Fig. 2a, by assuming an
elastic cylindrical bending of the whole fiber. The maximum strain ε of the surface film is estimated according to7:
t
ε= grad(ϕ), (1)
2
where t ≈ 120 nm is the thickness of the crystalline Quartz film, and grad(ϕ) is the average measured gradient of
monotonously increasing misorientation angle expressed in radians/m. The resulting strain of 0.07% is relatively
small. It is important to note that crystal growth occurred at relatively high temperatures, where the elastic limit
is much smaller than the room temperature value.
The linear increase of the misorientation angle along the fiber is clear evidence that the same type of lat-
tice deformation mechanism is active, leaving a constant density of GNDs behind the crystal growth front24,
responsible for the crystal lattice bending. The EBSD observation of these spherulitic fibers allows simultaneous
determination of fiber nucleation area (orientation of non-deformed crystal) and the crystal rotation axis between
a nucleation point and all other fiber points that are exposed to deformation. This generates a unique situation
in which the detailed deformation mechanism analysis can be performed. We then use the well-established fact
from dislocation theory that the crystal rotation axis between two parts of a crystal deformed by one type of
dislocations is linked to their slip system, i.e. dislocation slip plane normal (SPN) and slip direction (SD), being
the crystal rotation axis orthogonal to both of them. The SPN and SD are quite well categorized for Quartz
crystals17, 25, as Table S1 in “SI” summarizes. Once the type of dislocation slip is known, the GND density can be
estimated from the local crystal curvature, measured via misorientation angle g radient26. Therefore, an EBSD
measurement allows to determine the type of the GNDs responsible for crystal rotation (from the main orienta-
tion of crystal rotation axis), as well as an estimate of their local densities (from the local crystal bending given
by point-to-origin misorientation angle slope).
Let us estimate the GNDs density inside the fiber analyzed in Fig. 3. An average rotation angle gradient of
0.62°/µm has been measured. Clear clustering of lattice rotation axes around the normal to basal plane (0001)
is evident, which in a Quartz crystal corresponds to so-called {m} prismatic slip defined by SPN = {1010}
and SD = 17. A relatively simple formula can be used to roughly estimate the local density of GNDs if one
assumes a homogeneous distribution24, 27:
θtot
ρhom = , (2)
|b|�x
where θtot is the lattice bending angle over distance ∆x, realized by means of dislocations with Burger’s vector b.
Substituting our experimentally observed values: θtot = 0.422, ∆x = 39 µm and |b| being the size of the crystal axis
a = 4.985 Å, we obtain an average GND density inside the analyzed fiber of 2.2 × 10¹³/m2. Reported dislocation
densities in natural Quartz vary from low concentrations of about 109/m2 in crystals, that have grown slowly
from aqueous solutions in veins and cavities, to high density values of 1 014/m2 observed in deformed rocks of
low metamorphic grades28. Such a large dislocation density (1014/m2) has also been observed after low tempera-
ture (580 °C) creep deformation of Quartz c rystal29. Dislocations in Quartz crystals have been known to cause
problems in the fabrication of resonators by the formation of etch channels. It is also suspected that dislocations
contribute to acceleration sensitivity, thermal hysteresis, and possibly aging of these d evices30. In any case, a large
body of literature on strain and deformation via dislocations in natural and cultured Quartz studied using EBSD
has been published5, 17, 25, 31. The presence of dislocations of the determined relatively high density (2.2 × 10¹³/
m2) inside primary fibers could lead to an acceleration of non-crystallographic branching, such as crystal inho-
mogeneity, dislocations, and stress underlie non-crystallographic branching3. This mechanism is responsible for
the formation of secondary lateral fibers, which by their subsequent growth, fill an initially empty amorphous
space between primary fibers and thus finally form a 2D spherulitic shape.
Finally, we demonstrate that the same mechanism for spherulitic crystal growth takes place on a pure amor-
phous SiO2 film which undergoes the following process: deposition by ALD and subsequently crystallization
at a high temperature. A small amount of Sr has been pre-deposited on a Si substrate with the aim to promote
crystallization32. The 2D spherulitic character of Quartz crystal growth is evident from the IPF map shown in
Fig. 6a. The nucleation of the central area of all spherulitic colonies in this sample were epitaxial with the Si(100)
substrate (see crystal orientation sketched in Fig. 6b). Yet the growth of individual fibers is again associated with a
continuous crystal rotation, as shown by the pole figures in Fig. 6b. The primary fiber growing from the centrum
in south-east direction has been selected for further crystal lattice misorientation analysis. The misorientation
angle size map is shown in Fig. 6c, with lattice rotation angle gradient of 0.58°/µm, over the whole fiber length
(61 µm).
The insets of local lattice orientations in Fig. 6c again suggest that the lattice rotation axis is almost perpen-
dicular to the direction of fiber growth, as well as to the axis of the lattice. The results of the exact calcula-
tions of these directions are summarized in Fig. 6d,e. Individual rotation axes as well as calculated distribution
density are shown. It is important to note that neither the mean direction, nor the direction of maximum of their
distribution is in the vicinity of a crystal rotation axis associated with a single type of dislocation deformation
mechanism, marked by color points. A possible explanation is that the simultaneous action of a few dislocation
types is present, and that the resulting maximum/mean rotation direction is a combine effect of two types of
Scientific Reports | (2021) 11:14888 | https://doi.org/10.1038/s41598-021-94147-y 8
Vol:.(1234567890)www.nature.com/scientificreports/
Figure 6. EBSD observations of spherulitic SiO2 Quartz crystal: (a) Surface normal IPF map (color) combined
with IQ map (grey scale) and grain boundary (> 3°) black lines; (b) Quartz lattice orientation at the center of the
spherulite, and (0001) and (10 1 0) pole figure of the whole spherulite. The orientation of the spherulite center
is marked by red points in the accompanying pole figures; (c) misorientation angle size map (degrees) of one
primary fiber growing in a south-east direction (of image in (a)). The local lattice orientation is shown in a few
points; (d) rotation axis directions calculated between the reference point and all other fiber points. Mean axis
direction is marked by a small black point. (e) Rotation axes distribution calculated from data shown in (d). The
rotation axes of all common slip systems from Fig. S1c and Table S1 in “SI” are also marked inside the IPFs.
dislocations with different characteristic slip system and rotation axis. Using MTEX (Matlab extension package)
we are able to calculate a rotation axis resulting from two subsequent crystal rotations over two different crystal
axes. The situation is described in following diagram:
α@[A] β@[B]
O0 −−−→ O1 −−−→ O2 . (3)
An initial crystal orientation O0 is transformed by rotation around a crystal axis with direction [A] by an angle
α, resulting in a new crystal orientation O1 . Subsequently orientation O1 is transformed by rotation around a new
crystal axis [B] by an angle β , resulting in a final crystal orientation O2. We are interested in the misorientation
angle γ and the crystal direction [C] required for a direct transformation from the initial to the final orientation:
γ @[C]
O0 −−−→ O2 . (4)
In this way, it is quite straightforward to simulate these rotations and determine γ and [C] for any combination
of rotation axes and misorientation angles from Eq. (3). We calculated directions [C] using two subsequent and
very small (≈ 0.01°) rotation angles α and β around a few combinations of different rotation axes [A] and [B],
each of them corresponding to another Quartz crystal slip system. The results of such calculations are shown
in Fig. 7, and can be summarized in the following way: for small rotation angles α and β , the resulting rotation
angle γ is also small (the same order of magnitude) and the rotation direction [C] is located in the Quartz crystal
IPF on a line directly connecting these two characteristic rotation axes, as Fig. 7 shows. An interesting fact is that
the direction [C] does not depend on the order of the two subsequent rotations, but only on the ratio between
rotation angles α and β . If the ratio is 1, the direction [C] is localized in an equidistant-point between [A] and
[B] (small red dots in the middle of connection lines). Any change of the ratio between angles α and β results in
a shift of the position of [C] axis direction towards the direction with the larger rotation angle.
On the basis of the results of the MTEX simulations mentioned above, and from the comparison of Figs. 6d,e
and 7, we conclude that a presence of two types of dislocations could be responsible for small lattice rotations
of the fiber analyzed in Fig. 6. Dislocations acting in slip system { π } combined with one from (c) or
{a} systems (see Fig. S1c in “SI”) are required to act simultaneously. This finally results in a Quartz lattice
Scientific Reports | (2021) 11:14888 | https://doi.org/10.1038/s41598-021-94147-y 9
Vol.:(0123456789)www.nature.com/scientificreports/
Figure 7. Quartz crystal IPF with colored directions of rotation axes characteristic for different slip systems
according Table S1 in “SI”. Black dotted lines connecting two different directions correspond to calculated
directions [C] that arise from a combination of rotations around these two characteristic directions. Small red
dots mark the direction [C] that arises from two subsequent rotations with α = β.
rotation around the crystallographic direction [ 10.5070.4930.404], determined to be the mean direction of all
rotation axes acting in the fiber.
Conclusions
We use EBSD analysis to understand the spherulitic growth of crystalline Quartz from an amorphous thin film
with unprecedented detail. The 2D spherulitic growth of thin Quartz crystalline is a consequence of rotational
crystal growth. After nucleation, a unitary set of dislocations are generated at the glass/crystal interface to com-
pensate for the substantial reduction of specific volume during crystallization. These dislocations form a cloud
of GNDs with densities around 2.2 × 10¹³/m2 inside each fiber and bend its crystalline lattice plane parallel to
surface with a curvature in the range 5 × 10³ to 25 × 103/m.
Due to the GNDs, the growing crystal is forced to rotate around a few different crystal axes, whose orienta-
tions depend on the growth direction. This restriction, together with the anisotropy of Quartz crystal growth
rate, results in the formation of few primary fibers. A relatively high density of dislocations promotes non-
crystallographic branching: the mechanism of secondary fiber nucleation. Subsequent growth of these fibers
contributes to the complete filling of the spherulitic area with crystallites possessing deviated orientations.
The crystallization at relatively high temperatures supports an activation of many dislocation slip systems,
so far reported mostly in geological Quartz. Quite often, even simultaneous action of two close slip systems is
detected, when the crystal growth process forces the lattice to rotate around a crystal axis that is not in the vicinity
of a lattice rotation realized by one single slip system.
Data availability
The datasets generated and analyzed during the current study, as well as developed and commented MTEX scripts
are available online: https://doi.org/10.34894/BLMCTL.
Received: 3 May 2021; Accepted: 30 June 2021
References
1. eO2 thin films into α-quartz: From spherulites to single crystals. Acta Mater. 215, 117069 (2021).
Zhou, S. et al. Crystallization of G
2. Goldenfeld, N. Theory of spherulitic crystallization. II–VI Compd. 1987 Proc. Third Int. Conf. II–VI Compd. 84, 601–608 (1987).
3. Shtukenberg, A. G., Punin, Y. O., Gunn, E. & Kahr, B. Spherulites. Chem. Rev. 112, 1805–1838 (2012).
4. Thomas, A. et al. Mimicking the growth of a pathologic biomineral: Shape development and structures of calcium oxalate dihydrate
in the presence of polyacrylic acid. Chem. Eur. J. 18, 4000–4009 (2012).
5. Kilian, R. & Heilbronner, R. Analysis of crystallographic preferred orientations of experimentally deformed Black Hills Quartzite.
Solid Earth 8, 1095–1117 (2017).
Scientific Reports | (2021) 11:14888 | https://doi.org/10.1038/s41598-021-94147-y 10
Vol:.(1234567890)www.nature.com/scientificreports/
6. Muscarella, L. A. et al. Crystal orientation and grain size: Do they determine optoelectronic properties of M APbI3 perovskite?. J.
Phys. Chem. Lett. 10, 6010–6018 (2019).
7. Kolosov, V. Y. & Thölén, A. R. Transmission electron microscopy studies of the specific structure of crystals formed by phase
transition in iron oxide amorphous films. Acta Mater. 48, 1829–1840 (2000).
8. Kooi, B. J. & De Hosson, JTh. M. On the crystallization of thin films composed of Sb3.6Te with Ge for rewritable data storage. J.
Appl. Phys. 95, 4714–4721 (2004).
9. Savytskii, D., Jain, H., Tamura, N. & Dierolf, V. Rotating lattice single crystal architecture on the surface of glass. Sci. Rep. 6, 36449
(2016).
10. Wright, S. I., Nowell, M. M., De Kloe, R. & Chan, L. Orientation precision of electron backscatter diffraction measurements near
grain boundaries. Microsc. Microanal. 20, 852–863 (2014).
11. Lloyd, G. E. & Freeman, B. Dynamic recrystallization of quartz under greenschist conditions. J. Struct. Geol. 16, 867–881 (1994).
12. Brisset, F. Using a controlled pressure field emission gun scanning electron microscope to acquire EBSD data on non-conductive
samples. IOP Conf. Ser. Mater. Sci. Eng. 32, 012004 (2012).
13. Wright, S. I. & Adams, B. L. Automatic analysis of electron backscatter diffraction patterns. Metall. Trans. A 23, 759–767 (1992).
14. Nolze, G., Hielscher, R. & Winkelmann, A. Electron backscatter diffraction beyond the mainstream: Electron backscatter diffrac-
tion beyond the mainstream. Cryst. Res. Technol. 52, 1600252 (2017).
15. Bachmann, F., Hielscher, R. & Schaeben, H. Texture analysis with MTEX—Free and open source software toolbox. Solid State
Phenomena 160, 63–68 (2010). https://doi.org/10.4028/www.scientific.net/SSP.160.63
16. Nolze, G. & Hielscher, R. Orientations—Perfectly colored. J. Appl. Crystallogr. 49, 1786–1802 (2016).
17. Lloyd, G. E. Microstructural evolution in a mylonitic quartz simple shear zone: The significant roles of dauphine twinning and
misorientation. Geol. Soc. Lond. Spec. Publ. 224, 39–61 (2004).
18. Moore, R. E. M. & Angell, I. O. Voronoi polygons and polyhedra. J. Comput. Phys. 105, 301–305 (1993).
19. Mason, J. K. & Schuh, C. A. Representations of Texture. in: Electron Backscatter Diffraction in Materials Science. 35–51 (Springer
US, 2009).
20. Randle, V. & Engler, O. Introduction to Texture Analysis: Macrotexture, Microtexture and Orientation Mapping (Gordon & Breach,
2000).
21. Prior, D. J. Problems in determining the misorientation axes, for small angular misorientations, using electron backscatter diffrac-
tion in the SEM. J. Microsc. 195, 217–225 (1999).
22. Shtukenberg, A. G., Punin, Y. O., Gujral, A. & Kahr, B. Growth actuated bending and twisting of single crystals. Angew. Chem. Int.
Ed. 53, 672–699 (2014).
23. Sharma, S. K., Virgo, D. & Kushiro, I. Relationship between density, viscosity and structure of GeO2 melts at low and high pres-
sures. J. Non-Cryst. Solids 33, 235–248 (1979).
24. Konijnenberg, P. J., Zaefferer, S. & Raabe, D. Assessment of geometrically necessary dislocation levels derived by 3D EBSD. Acta
Mater. 99, 402–414 (2015).
25. Neumann, B. Texture development of recrystallised quartz polycrystals unravelled by orientation and misorientation characteristics.
J. Struct. Geol. 22, 1695–1711 (2000).
26. Wright, S. I., Nowell, M. M. & Field, D. P. A review of strain analysis using electron backscatter diffraction. Microsc. Microanal.
17, 316–329 (2011).
27. Pantleon, W. Resolving the geometrically necessary dislocation content by conventional electron backscattering diffraction. Scripta
Mater. 58, 994–997 (2008).
28. Blum, A. E., Yund, R. A. & Lasaga, A. C. The effect of dislocation density on the dissolution rate of quartz. Geochim. Cosmochim.
Acta 54, 283–297 (1990).
29. Doukhan, J.-C. & Trépied, L. Plastic deformation of quartz single crystals. bulmi 108, 97–123 (1985).
30. Murray, R. A. Movement of dislocations in quartz. in Proceedings of the 45th Annual Symposium on Frequency Control 1991 2–8
(IEEE, 1991). https://doi.org/10.1109/FREQ.1991.145881.
31. Ceccato, A., Pennacchioni, G., Menegon, L. & Bestmann, M. Crystallographic control and texture inheritance during mylonitiza-
tion of coarse grained quartz veins. Lithos 290–291, 210–227 (2017).
32. Carretero-Genevrier, A. et al. Soft-chemistry-based routes to epitaxial α-quartz thin films with tunable textures. Science 340,
827–831 (2013).
Acknowledgements
The authors acknowledge financial support from NWO’s TOP-260 PUNT Grant No. 718.016002. Well organ-
ized support of MTEX package on https://github.com/mtex-toolbox/mtex/discussions is also acknowledged.
Author contributions
S.Z., N.R.L. and J.A.-L. prepared thin layer samples, realized and analyzed x-ray diffraction experiments. N.R.L.,
S.Z. and V.O. realized AFM and EBSD measurements. N.R.L. and V.O. analyzed and visualized EBSD data, and
wrote an initial manuscript version. B.N. and V.O. supervised and designed the overall research and interpreted
experimental results. All authors contributed to finalizing of the submitted manuscript version.
Competing interests
The authors declare no competing interests.
Additional information
Supplementary Information The online version contains supplementary material available at https://doi.org/
10.1038/s41598-021-94147-y.
Correspondence and requests for materials should be addressed to V.O.
Reprints and permissions information is available at www.nature.com/reprints.
Publisher’s note Springer Nature remains neutral with regard to jurisdictional claims in published maps and
institutional affiliations.
Scientific Reports | (2021) 11:14888 | https://doi.org/10.1038/s41598-021-94147-y 11
Vol.:(0123456789)www.nature.com/scientificreports/
Open Access This article is licensed under a Creative Commons Attribution 4.0 International
License, which permits use, sharing, adaptation, distribution and reproduction in any medium or
format, as long as you give appropriate credit to the original author(s) and the source, provide a link to the
Creative Commons licence, and indicate if changes were made. The images or other third party material in this
article are included in the article’s Creative Commons licence, unless indicated otherwise in a credit line to the
material. If material is not included in the article’s Creative Commons licence and your intended use is not
permitted by statutory regulation or exceeds the permitted use, you will need to obtain permission directly from
the copyright holder. To view a copy of this licence, visit http://creativecommons.org/licenses/by/4.0/.
© The Author(s) 2021
Scientific Reports | (2021) 11:14888 | https://doi.org/10.1038/s41598-021-94147-y 12
Vol:.(1234567890)You can also read


