Spring Accumulation Rates in North Atlantic Phytoplankton Communities Linked to Alterations in the Balance Between Division and Loss
←
→
Page content transcription
If your browser does not render page correctly, please read the page content below
ORIGINAL RESEARCH
                                                                                                                                            published: 24 August 2021
                                                                                                                                      doi: 10.3389/fmicb.2021.706137

                                             Spring Accumulation Rates in North
                                             Atlantic Phytoplankton Communities
                                             Linked to Alterations in the Balance
                                             Between Division and Loss
                                             Kristina D. A. Mojica 1* † , Michael J. Behrenfeld 1 , Megan Clay 2,3 and
                                             Corina P. D. Brussaard 2
                                             1
                                               Department of Botany and Plant Pathology, Oregon State University, Corvallis, OR, United States, 2 Department of Marine
                                             Microbiology and Biogeochemistry, Royal Netherlands Institute for Sea Research, Den Burg, Netherlands, 3 Australian Centre
                                             for Ecogenomics, University of Queensland, Brisbane, QLD, Australia

                          Edited by:         For nearly a century, phytoplankton spring blooms have largely been explained
                     Susana Agusti,
                                             in the context of abiotic factors regulating cellular division rates (e.g., mixed-layer
  King Abdullah University of Science
       and Technology, Saudi Arabia          light levels). However, the accumulation of new phytoplankton biomass represents a
                       Reviewed by:          mismatch between phytoplankton division and mortality rates. The balance between
                         Rumi Sohrin,        division and loss, therefore, has important implications for marine food webs and
           Shizuoka University, Japan
                    Michael R. Twiss,
                                             biogeochemical cycles. A large fraction of phytoplankton mortality is due to the
    Clarkson University, United States       combination of microzooplankton grazing and viral lysis, however, broad scale
                   *Correspondence:          simultaneous measurements of these mortality processes are scarce. We applied
                   Kristina D. A. Mojica
                                             the modified dilution assay along a West-to-East diagonal transect in the North
             Kristina.Mojica@usm.edu
                   †                         Atlantic during spring. Our results demonstrate positive accumulation rates with losses
                     Present   address:
                  Kristina D. A. Mojica,     dominated by microzooplankton grazing. Considering the dynamic light environment
    Division of Marine Science, School       phytoplankton experience in the mixed surface layer, particularly in the spring, we tested
   of Ocean Science and Engineering,
             The University of Southern      the potential for incubation light conditions to affect observed rates. Incubations acted
    Mississippi, Stennis Space Center,       as short-term ‘light’ perturbations experiments, in which deeply mixed communities are
       Hattiesburg, MS, United States
                                             exposed to elevated light levels. These “light perturbations” increased phytoplankton
                   Specialty section:        division rates and resulted in proportional changes in phytoplankton biomass while
         This article was submitted to       having no significant effect on mortality rates. These results provide experimental
                 Aquatic Microbiology,
               a section of the journal
                                             evidence for the Disturbance-Recovery Hypothesis, supporting the tenet that biomass
             Frontiers in Microbiology       accumulation rates co-vary with the specific rate of change in division.
            Received: 06 May 2021
                                             Keywords: phytoplankton, bloom dynamics, North Atlantic, Disturbance Recovery Hypothesis, light perturbation
            Accepted: 19 July 2021
          Published: 24 August 2021
                             Citation:      INTRODUCTION
          Mojica KDA, Behrenfeld MJ,
  Clay M and Brussaard CPD (2021)           Nearly half of the net primary production on Earth is due to phytoplankton in the ocean (Field
 Spring Accumulation Rates in North
                                            et al., 1998; Friend et al., 2009). The North Atlantic Ocean is a particular “hot spot” for production,
 Atlantic Phytoplankton Communities
  Linked to Alterations in the Balance
                                            accounting for 20% of the global net ocean CO2 uptake (Deser and Blackmon, 1993). Much of this
          Between Division and Loss.        productivity occurs during the recurrent vernal (spring) phytoplankton bloom and accordingly
         Front. Microbiol. 12:706137.       this event has been thoroughly studied for the past century. Traditionally, this bloom has been
    doi: 10.3389/fmicb.2021.706137          attributed to elevated springtime phytoplankton division rates caused by mixed-layer shoaling

Frontiers in Microbiology | www.frontiersin.org                                    1                                         August 2021 | Volume 12 | Article 706137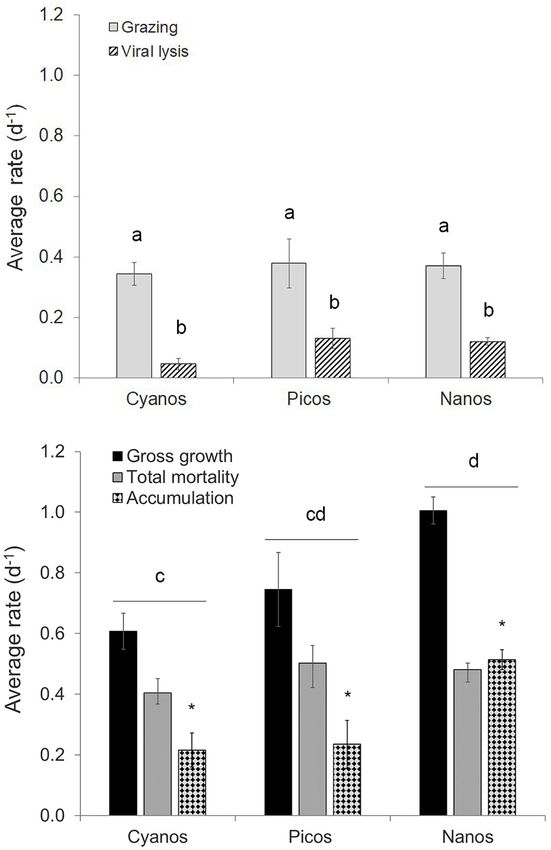
Mojica et al.                                                                                                          Balance Between Division and Loss

and increased incident sunlight (Gran and Braarud, 1935;                       During the spring of 2018, we conducted modified dilution
Sverdrup, 1953; Follows and Dutkiewicz, 2002; Siegel et al.,               experiments along a West-to-East diagonal transect across the
2002; Henson et al., 2009). In other words, phytoplankton                  North Atlantic providing simultaneous rates of growth and loss of
accumulation rates (r), i.e., changes in biomass, are proportional         phytoplankton over a range of oceanic provinces and conditions.
to division rates. However, satellite, in situ, and modeling studies       This allowed us to evaluate whether the balance between
have recently revealed that phytoplankton accumulation rates               division and loss during the spring tends toward positive values
are, in fact, independent of the absolute value of division                for accumulation rates (r) within phytoplankton populations.
rate (Behrenfeld, 2010; Behrenfeld and Boss, 2014, 2018).                  Moreover, concurrent measurements of viral- and grazing-
Accumulations in biomass reflect the net balance between the               mediated mortality of phytoplankton populations provided
specific rates of phytoplankton division (µ) and loss (l) (i.e.,           information on how phytoplankton mortality was partitioned
r = µ – l), thus r can be independent of µ if µ and l covary               between these two mortality pathways. Finally, we examine
(Behrenfeld and Boss, 2014, 2018).                                         the implications of altering the light environment experienced
   Phytoplankton mortality has traditionally been attributed to            by phytoplankton by removing phytoplankton from a deeply
grazing by zooplankton and the loss of cells from the euphotic             mixed surface layer and incubating them under static simulated
zone due to sinking. However, viruses and microzooplankton                 in situ conditions.
grazers can also be important sources of mortality (Sherr
and Sherr, 2002; Brussaard, 2004; Baudoux et al., 2006).
Short micrograzer generation times and viral replication cycles,           MATERIALS AND METHODS
combined with high rates of micrograzer predation and viral
infection, allow these predators to rapidly respond to increases           Sampling and Physicochemical Variables
in prey/host abundance. Accordingly, microzooplankton and                  In April (6–28th) of 2018, 17 stations were sampled in the
viruses have the capacity to rapidly collapse a bloom following            North Atlantic during Leg 8 of the NICO (Netherlands’ Initiative
its climax (Matsuyama et al., 1999; Schroeder et al., 2003;                for Changing Oceans) expedition on the R/V Pelagia. The
Nagasaki et al., 2004), or even prevent a bloom from happening             stations traversed diagonally across the North Atlantic Ocean
(Gallegos et al., 1996; Brussaard, 2004; Brussaard et al., 2005).          from ∼29◦ N just off the coast of New Providence (Bahamas)
The rapid response time of phytoplankton mortality factors                 to 54◦ N off the coast of Galway, Ireland (Figure 1). Water
also promotes a tight temporal coupling between phytoplankton              samples were collected at each station using a 24-bottle rosette
division and loss rates, such that daily phytoplankton production          sampler equipped with 12 L GO-Flow (General Oceanics, Miami,
in the Northeastern Atlantic during summer is closely matched              FL, United States) bottles, a standard conductivity, temperature,
by collective daily losses of grazing and vial lysis (Caceres              and depth (CTD) sensor package (Sea-Bird Electronics, Bellevue,
et al., 2013; Mojica et al., 2016). Temporal perturbations in              WA, United States), and an auxiliary sensor for chlorophyll-a
growth conditions can cause disturbances in the phytoplankton              (Chl a) autofluorescence (Chelsea Aqua 3 sensor, Chelsea
division-loss balance and be largely responsible for changes               Instruments, West Molesey, United Kingdom). Downcast CTD
in phytoplankton concentrations (Behrenfeld, 2014; Behrenfeld              data were processed using SeaSave software and interpolated to
et al., 2017; Behrenfeld and Boss, 2018). Accordingly, in the              a uniform vertical resolution of 1 m. Sigma-theta (σθ ; kg m−3 ),
spring, once the mixed layer stops deepening, phytoplankton                potential temperature (θ;◦ C), and Brunt-Väisälä frequency
and their mortality factors rise in concentration in a parallel
fashion. Light-driven increases in division rate and slight lags in
the response of predators to these changes in division maintain
a growth-loss imbalance allowing for positive accumulation
rates that culminate with the annual phytoplankton biomass
maximum around May–June (Behrenfeld and Boss, 2014,
2018). However, broad scale simultaneous measurements of
microzooplankton grazing and viral lysis during the spring are
scarce, particularly in the North Atlantic Ocean, limiting our
ability to understand these nuances of phytoplankton bloom
dynamics. Moreover, the capability of microzooplankton and
viruses to respond to changes in phytoplankton biomass on
similar timescales remains unknown. There is evidence, however,
that the partitioning of phytoplankton mortality amongst these
two modes may be related to mixing processes (Mojica et al.,
2016). The impact on marine food dynamics and elemental                     FIGURE 1 | Leg 8 NICO cruise transect in the North Atlantic Ocean.
cycling varies substantially between mortality types (Suttle, 2007;         Bathymetric map depicting stations sampled during April of 2018. Modified
Brussaard et al., 2008; Calbet and Alcaraz, 2009). Therefore, the           dilution assays to simultaneously determine viral lysis and microzooplankton
                                                                            grazing rates of phytoplankton were performed at stations (numbered)
partitioning of photosynthetic biomass during the accumulation
                                                                            indicated by white diamond symbols. Figure was prepared using Ocean Data
phase has important implications for ecosystem functioning over             View version 4 (Schlitzer, 2002).
the entire annual cycle.

Frontiers in Microbiology | www.frontiersin.org                        2                                         August 2021 | Volume 12 | Article 706137
Mojica et al. Balance Between Division and Loss
(N2 , s−2 ) were computed using MATLAB in conjunction with spherical diameter for each population was determined as the
the TEOS-10 Gibbs SeaWater (GSW) Oceanographic toolbox size displayed by the median (50%) number of cells retained
(v3.3) (Morgan, 1994; McDougall and Barker, 2011). Sigma-theta for that cluster.
is defined as σθ = ρ(S,θ,0) − 1000, where ρ(S,θ,0) is the density of In total, seven different phytoplankton populations were
seawater calculated with in situ salinity, potential temperature, considered in the analysis based on statistically significant
and a reference pressure of zero. Mixed layer depth (MLD) was abundances within dilution experiment incubation bottles.
defined based on the dynamic threshold method according to Phytoplankton populations included two cyanobacterial
Mojica and Gaube (in revision). Specifically, MLD was defined populations, i.e., Synechococcus spp. (average size range of
as the depth at which the change in potential density was greater 0.8 ± 0.2 µm) and Prochlorococcus (0.7 ± 0.0 µm) and
than the standard deviation (σ) of potential density for a vertical five eukaryotic populations. The photosynthetic eukaryotic
profile, given that σ is less than 0.01 kg m−3 . This method populations, differentiated based on variations in side scatter,
yielded related (current study; r = 0.96) but shallower (current included two pico-sized groups (≤3 µm): Pico I (0.8 ± 0.2 µm)
study; bias = –11.8 m) estimates compared to the traditional fixed and Pico II (1.2 ± 0.4 µm) and three nano-sized groups (>3 µm):
threshold of 0.03 kg m−3 (Brainerd and Gregg, 1995; de Boyer Nano I (3.3 ± 0.9 µm), Nano II (5.1 ± 0.8 µm), and one group
Montégut et al., 2004). Moreover, the dynamic threshold method identified as Cryptophycea based on size and presence of
provided more robust estimates of MLD with an average quality phycoerythrin (Crypto; 4.0 ± 0.8 µm). Pico I was distinguished
index (Lorbacher et al., 2006) of 0.73 compared to 0.55 using from Prochlorococus by a shift in the fluorescence signature (i.e.,
the fixed threshold. Water column stratification conditions at based on the bivariate plot of red fluorescence versus side scatter)
each station were classified as “non-stratified” when the average and by its slightly larger size range (Biller et al., 2014).
N 2 value for the upper 100 m (N 2 ) was 5 × 10⁻⁵ s−2
modified dilution experiments (Kimmance and Brussaard, 2010;
(Mojica et al., 2015).
Mojica et al., 2016) were conducted onboard to provide
Discrete water samples for dissolved inorganic phosphate
simultaneous estimates of viral lysis and microzooplankton
(PO4 ), ammonium (NH4 ), nitrate (NO3 ), and silicate were
(Mojica et al. Balance Between Division and Loss
intensity at the depth of sampling (incubation light levels were 3 days prior to station arrival, day length (dayL) is the number
created using neutral density screen). After the 24 h incubation of hours of daylight at the station location, and depth (z) is either
period, a second FCM phytoplankton count was conducted the DCM sampling depth or MLD/2 for samples originated from
and the resulting apparent growth rate for each phytoplankton the ML. Here, we used the 3-day average PAR because we are
group was determined. interested in division rates for populations acclimated to their
Microzooplankton grazing rate was estimated from the variable in situ light conditions.
regression coefficient of the apparent growth rate versus fraction Incubation light levels were calculated as:
of natural seawater for the 0.45 µm series. Similarly, total
mortality rate (i.e., combined rate of viral-induced lysis and
−2 −1
PAR2 ∗ 0.975
PAR mole photons m h = ∗ %Irr
microzooplankton grazing) was determined from a regression dayL
of the 30 kDa series (Baudoux et al., 2006; Kimmance and
Brussaard, 2010). A significant difference between the two where PAR2 is the daily average PAR at the station location
regression coefficients for each series (assessed by analysis of during incubation and %Irr is the percentage of PAR transmitted
covariance, i.e., ANCOVA) indicates a significant viral lysis rate. through the neutral density screening applied to a given
Phytoplankton gross division rate (µ, no mortality) was derived incubation bottle (i.e., measured in incubator after neutral
from the y intercept of the 30 kDa series regression. density screening) relative to PAR just below the surface (i.e.,
The viral lysis and grazing rates were analyzed with a measured in situ). Light levels for incubations (i.e., %Irr) were
two-way analysis of variances (ANOVA) with type III sum based on ambient light conditions at the depth of sampling
of squares to assess differences between the two sources of (i.e., DCM depth for DCM samples and 15 m for ML samples)
mortality (i.e., viral lysis versus grazing) and among the different (Table 1). Light measurements for %Irr were determined
phytoplankton groups (i.e., cyanobacteria, picoeukaryotes, and from onboard measurements obtained using LI-COR LI 193SA
nanoeukaryotes). Model assumptions were confirmed using the Underwater Spherical Quantum Sensor. In order to get sufficient
Brown–Forsythe test for homogeneity of variance and Shapiro– satellite PAR data for each station (which are not always
Wilk test for normality. available), PAR2 for incubations was calculated using PAR
Mortality rates were (y)−2 transformed to fit model values averaged over 48 h. Delta PAR (1PAR) was calculated as
assumptions. Statistical analysis was implemented in R (R the difference between PAR for the incubations and the in situ
Development Core Team, 2012) using the “car” package (Fox PAR (PARz or PARmld ).
et al., 2016) with a significance level (α) of 0.05. Total mortality
and division rates were also analyzed with a two-way ANOVA
with type III sum of squares to assess differences between rates RESULTS
(and therefore significance of accumulation rates) and among
the different phytoplankton groups. Rates were square root Environmental Variability
transformed to fit model assumptions. Post hoc comparisons of In April 2018, the water column along the Leg 8 NICO
significance were evaluated based on Tukey’s honest significant cruise track was characterized as weakly stratified to well-
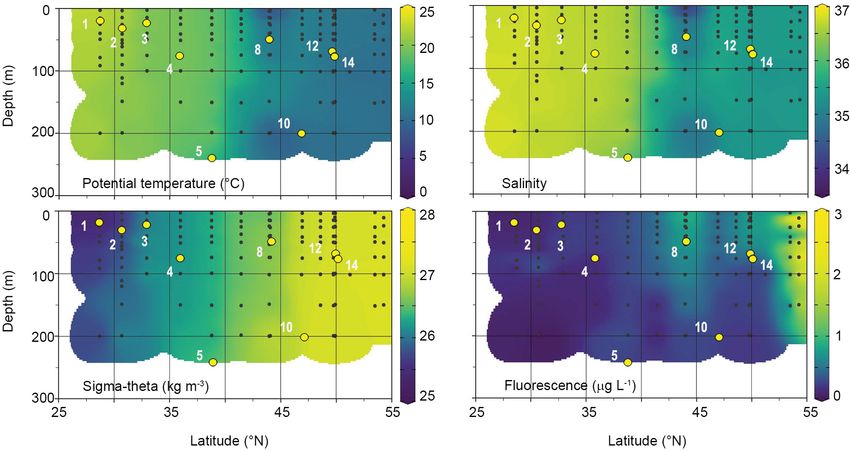
differences test. mixed (Table 1). Physicochemical parameters were relatively
uniform with depth at a given station in the upper 200 m, but
Light Conditions varied significantly with latitude (Figure 2 and Table 1). In the
Daily photosynthetically available radiation (PAR; mole southern half of the transect (28–36◦ N), potential temperature
photons m−2 day−1 ) from the Moderate Resolution Imaging (θ), salinity, and sigma-theta (σθ ) averaged 20.7 ± 1.3◦ C,
Spectroradiometer (MODIS) was downloaded from the 36.7 ± 0.1, and 25.9 ± 0.3 kg m−3 , respectively. Dissolved
OceanColor Web1 and extracted at a resolution of 1 /12 degree inorganic nutrient concentrations in the surface were low and
latitude × 1 /12 degree longitude for each station location. Diffuse uniform in this region, with averages of 0.50 ± 0.40 µM for
attenuation for PAR [Kd (PAR)] was calculated from shipboard nitrate, 0.04 ± 0.02 µM for phosphate, 0.70 ± 0.10 µM for
fluorescence-based Chl a measurements following Morel et al. silicate. North of 38◦ N, nutrients increased gradually to reach
(2007). In situ growth irradiance was defined as PAR at the maximal concentrations of 10.3 µM for nitrate, 0.60 µM for
depth of sampling (PARz ) for samples from the DCM and as phosphate, and 4.30 µM for silicate. The region between 36
the median mixed layer light level (PARmld ) for samples within and 44◦ N exhibited the largest horizontal gradients in physical
the ML (Behrenfeld et al., 2005). PARz and PARmld were then parameters (Figure 2), with average θ, salinity, and σθ of
calculated as: 17.5 ± 1.7◦ C, 36.3 ± 0.4, and 26.4 ± 0.1 kg m−3 , respectively.
In the north (44–54◦ N), θ and salinity were minimal and
PAR mole photons m−2 h−1 σθ maximal, with averages of 11.1 ± 1.4◦ C, 35.3 ± 0.4, and
27.0 ± 0.2 kg m−3 , respectively. MLDs were highly variable,
= [ PAR1 ∗ 0.975 e−kd(PAR)∗z ]/dayL
ranging from 19 to 245 m (Table 1). The first two stations were
classified as weakly stratified based on 100 m depth averaged
where 0.975 is the surface reflectance correction (Austin, 1974),
PAR 1 is the average daily PAR for a given location over the Brunt–Väisälä frequencies (N 2 ) of 2.5 and 2.9 × 10⁻⁵ s−2 ,
respectively. Accordingly, these stations exhibited relatively
1
http://oceancolor.gsfc.nasa.gov shallow mixed layer depths of 19 and 32 m and an average
Frontiers in Microbiology | www.frontiersin.org 4 August 2021 | Volume 12 | Article 706137Mojica et al. Balance Between Division and Loss
Silicate
Euphotic zone depth (Zeu ) defined as the depth at which light is 1% of its surface value and calculated according to Morel et al. (2007). Light levels for incubations (i.e.,%Irr) is the percentage of PAR transmitted through
the neutral density screening applied to a given incubation bottle (measured in incubator after neutral density screening) relative to PAR just below the surface (measured in situ).%Irr was targeted to match ambient light
subsurface fluorescence maximum of 0.27 centered around 75 m
0.76
0.72
0.71
0.80
0.95
2.25
3.50
4.37
4.11
TABLE 1 | Station location, day of year (DOY), sampling depth, and in situ biological and physiochemical characteristics, including mixed layer depth (MLD), 100 m depth averaged Brunt–Väisälä frequency (N2 ), and (Figure 2). The remaining stations were classified as non-
Nutrients (µM)
stratified. Stations 5 and 10 were the most unstable, with low
0.29
0.09
0.11
0.44
0.17
0.28
0.12
0.08
0.09
NH4
and negative (N 2 ) and MLD greater than 200 m. Fluorescence
was uniformly distributed over the mixed layer at both stations,
10.76
10.61
0.53
0.40
0.09
0.96
5.38
2.66
8.33
NO3
averaging ∼0.30 ± 0.01 µg L−1 . Of the non-stratified stations,
3 and 8 had the highest (N 2 ) and shallowest MLD of 23 and
0.05
0.02
0.04
0.09
0.07
0.33
0.52
0.65
0.62
PO4
50 m. Fluorescence in the mixed layer averaged 0.23 ± 0.01 and
0.87 ± 0.03 µg L−1 , respectively. Station 4 had an intermediate
Phytoplankton
(×104 mL− 1 )
MLD of 76 m and a fluorescence of 0.21 µg L−1 . Stations 12 and
Total
9.58
7.34
4.78
2.91
1.96
1.59
3.00
4.07
4.86
14 had MLDs of 69 and 78 m, with relatively high fluorescence
values of 0.78 and 0.72 µg L−1 , respectively.
autofluorescence
Phytoplankton Abundance and
(µg L− 1 )
Chl a
Composition
0.24
0.29
0.24
0.21
0.29
0.85
0.34
0.78
0.72
Highest phytoplankton concentrations were measured in the
DCM of weakly stratified stations (9.6 and 7.3 × 10⁴ cells mL−1
for stations 1 and 2, respectively). The phytoplankton populations
Salinity
in the DCM were dominated by cyanobacteria species with
36.8
36.8
36.7
36.7
36.6
34.6
35.7
35.3
35.4
Prochlorococcus comprising 80 and 51% and Synechococcus 19
and 36% of the total counts of Station 1 and 2, respectively.
Temperature
At non-stratified stations, the ML was sampled. At station
21.9
22.2
19.7
19.6
19.0
12.5
10.6
11.1
(◦ C)
9.9
4, the ML was comprised mainly of Prochlorococcus (46%)
and Synechococcus (44%). The deep mixed layer of station 5
was predominately comprised of Pico II at 49% of the total
counts, followed by the cyanobacteria at 41% and Nano I at
% Irr
25.0
28.6
20.0
20.0
15.0
20.0
15.0
0.9
4.5
7%. North of 44◦ N, Prochlorococcus was no longer present and
Pico I emerged. However, Synechococcus continued to comprise
Sample
depth
(m)
78
75
15
15
15
15
15
15
15
a large portion of the phytoplankton community in the ML
for the remaining stations. At stations 8 and 10, Synechococcus
comprised 61 and 69% of the total counts, followed by Pico I
102
(m)
Zeu
93
58
64
56
37
52
37
39
at 29 and 26%, respectively. The prevalence of Synechococcus
decreased to 49% at station 12 and 14, trailed closely by Pico
Stratification
Non-stratified
Non-stratified
Non-stratified
Non-stratified
Non-stratified
Non-stratified
Non-stratified
stratified
stratified
I at 45%. Nano II and Cryptophytes comprised ∼1% or less of
Weakly
Weakly
the total counts at all stations and depths measured. In general,
the total phytoplankton abundance and the relative abundance
of the different phytoplankton groups were consistent between
−2.0 × 10− 7
−3.5 × 10− 8
2.5 × 10− 5
2.9 × 10− 5
1.0 × 10− 5
2.3 × 10− 6
1.7 × 10− 5
2.6 × 10− 6
2.4 × 10− 6
communities in incubations and in situ (≥96%). One notable
N2 (s− 2 )
stratification of the water column during the spring NICO leg 8 cruise.
exception was station 12, where the incubation community
was enriched with Synechococcus (i.e., 93% compared to 49%
in situ) and completely depleted of Pico I (i.e., compared to
MLD
245
205
(m)
19
32
23
76
50
69
78
45% in situ). The water samples used for in situ phytoplankton
community analysis and for the dilution experiments did not
length
originate from the same CTD bottle, which may have caused
12.2
12.2
12.3
12.4
12.5
12.9
13.1
13.3
13.4
Day
(h)
this discrepancy.
Longitude
−75.6
−74.0
−69.8
−62.8
−56.3
−43.1
−34.3
−24.9
−24.2
Growth Versus Loss of Phytoplankton
(◦ E)
Phytoplankton gross division rate (µ) and the contribution
of viral lysis and grazing to the mortality of the different
conditions at sample depth.
Latitude
phytoplankton groups were assessed at 9 stations of the Leg 8
28.7
30.7
32.9
35.9
38.8
44.0
46.9
49.7
49.9
(◦ N)
NICO cruise using the modified dilution method. Results were
evaluated for evidence of negative effects of the experimental
DOY
100
102
104
108
110
112
113
97
98
manipulations on phytoplankton performance (e.g., changes in
community composition, dilution induced nutrient limitation,
Station
dilution induced losses in growth, etc.). Based on this analysis,
No.
10
12
14
the experiment at station 3 was deemed unsuccessful across all
1
2
3
4
5
8
Frontiers in Microbiology | www.frontiersin.org 5 August 2021 | Volume 12 | Article 706137Mojica et al. Balance Between Division and Loss
FIGURE 2 | Physical and chlorophyll fluorescence characteristics of the water column during the April 2018 Leg 8 NICO expedition. Black dots represent individual
sampling points. White numbers are station numbers where modified dilutions experiments were performed. Yellow points indicate MLD of stations.
phytoplankton groups, as all groups exhibited lower growth rates 0.48 day−1 (Supplementary Figure 1B), were significantly lower
with increased dilution. In addition, we found reductions in than microzooplankton grazing rates with a median value of
growth in the 20% fraction at 3 stations north of 35◦ N (i.e., 0.09 day−1 . The two-way ANOVA of total mortality and division
4, 5, and 15). Interestingly, reductions were consistent across rates revealed a significant main effect of rate type (F = 5.5,
all phytoplankton groups and not restricted to the 30 kDa p = 0.02) and phytoplankton group (F = 7.4, p = 0.001) with no
series where potential enhanced nutrient limitation would be significant interaction (F = 2.7, p > 0.05). That is, division rates
greatest due to reduced remineralization (i.e., due to removal of were significantly greater than total mortality rates, indicating
bacteria and grazers), nor were they restricted to nutrient limited significant positive accumulation rates (Figure 4B). Additionally,
regions of the transect. At these stations, the 20% fraction was rates of division and total mortality of nano-sized eukaryotes
excluded from analysis. were significantly higher than cyanobacteria, with average rates
Phytoplankton gross growth (or division) rates ranged from of 1.01 ± 0.05 and 0.48 ± 0.02 day−1 compared to 0.61 ± 0.06
0.16 to 1.66 day−1 and were in excess of total mortality and 0.41 ± 0.05, respectively.
(i.e., viral lysis + grazing) which ranged from 0.05 to
0.88 day−1 (Figure 3A). This resulted in predominately positive
accumulation rates with a median value of 0.38 day−1 and range Light and Phytoplankton Growth
of –0.17 to 0.88 day−1 (Figure 3B). Phytoplankton mortality At all stations, aside from Station 1, irradiance levels in the
was generally dominated by microzooplankton grazing, which modified dilution incubations were higher than calculated in situ
comprised on average 77 ± 25% of the total phytoplankton growth irradiance (Supplementary Figure 2). Thus, 1PAR
mortality. Individual grazing rates varied from 0.01 to 0.65 day−1 values (i.e., PAR of incubation - PAR in situ) were predominately
(Supplementary Figure 1A) with a median value of 0.36 day−1 . positive, ranging from 0.14 to 0.89 mole photons m−2 h−1 .
In addition, there was very little variation in the average rates The exception was Station 1, which had a 1PAR of –0.04
between the different phytoplankton size classes (Figure 4A). mole photons m−2 h−1 . The average division rates of the
Indeed, two-way analysis of variance of the mortality rates phytoplankton community increased in proportion to PAR at
revealed a significant main effect of mortality source (F = 34.4, values less than 0.5 mole photons m−2 h−1 (Figure 5). Station
p < 0.001), whereas the main effect of phytoplankton group 12, however, had a lower µ than would be expected from this
(F = 0.0, p > 0.05) and the interaction term (F = 1.6, p > 0.05) relationship, presumably due to alternations in the composition
were both non-significant. In other words, individual mortality of the incubation community (see section “Phytoplankton
rates were comparable across the different phytoplankton groups Abundance and Composition”). At larger PAR values, such as
(Figure 3A). Viral lysis rates, which varied from 0.0 to those measured at Station 4 and Station 8, associated µ values
Frontiers in Microbiology | www.frontiersin.org 6 August 2021 | Volume 12 | Article 706137Mojica et al. Balance Between Division and Loss FIGURE 3 | The balance between division and loss rates of the seven phytoplankton groups (
Mojica et al.                                                                                                                          Balance Between Division and Loss

  FIGURE 5 | The average gross division rate of phytoplankton groups versus the light level during experimental incubations. The solid line is a fit of the
  photosynthesis-irradiance (P-I) model of Platt et al. (1980) to our division rate versus PAR data. Station numbers are indicated on plot. Error bars represent
  standard error.

  FIGURE 6 | The relationship between accumulation rate and gross division rate of phytoplankton communities subjected to a light disturbance during experimental
  incubations (gray squares). Station number are indicated on plot. Error bars represent standard error. A geometric mean regression of division rates within the
  phytoplankton community during dilution incubations and PAR levels
Mojica et al.                                                                                                                   Balance Between Division and Loss

  FIGURE 7 | The relationship between the rate of change in division rate (1µ) and measured accumulation rates of the phytoplankton communities within
  experimental incubations. Station numbers are indicated on plot. Error bars represent standard error.

DISCUSSION                                                                           Partitioning Phytoplankton Mortality
                                                                                     Phytoplankton mortality was dominated by microzooplankton
During the spring of 2018, the water column along our diagonal                       grazing. Absolute grazing rates were comparable to Chl a-based
cruise track in the North Atlantic ranged from weakly stratified                     grazing rates for the North Atlantic, as well as rates measured
to non-stratified, resulting in fairly uniform vertical profiles                     during the May–June blooming period (Verity et al., 1993;
of physicochemical parameters down to around 200 m. This                             Gifford et al., 1995; Schmoker et al., 2013; Morison et al., 2019). In
is consistent with observations of high latitude regions of the                      addition, we found no significant difference in the specific grazing
North Atlantic remaining well-mixed in the upper 200 m                               rates of the different phytoplankton populations, suggesting non-
between December and April (van Aken, 2000). Mixed layer                             selective grazing. Conversely, rates of viral mediated mortality
depths in this study were in the range of the climatological                         were nearly 2-fold lower than the average rates reported during
monthly mean values and variability expected for the North                           the summer in the northeastern North Atlantic (Mojica et al.,
Atlantic (Monterey and Levitus, 1997; de Boyer Montégut                              2016). Moreover, the average viral lysis to grazing rate ratio
et al., 2004; Carton et al., 2008). In accordance with the                           (V:G) of phytoplankton groups decreased significantly over the
Disturbance Recovery Hypothesis (DRH) (Behrenfeld and Boss,                          latitudinal gradient (r = –0.73, p-value = 0.02) (Supplementary
2018), once the mixed layer stops deepening, phytoplankton                           Figure 1C), consistent with decreased depth-averaged N2 . This
growth increases due to elevated irradiance and at the same                          finding corresponds well with results of Mojica et al. (2016),
time losses increase as more phytoplankton cells allow for                           which demonstrated a shift from viral-lysis dominated mortality
enhanced contact rates between predators (zooplankton or                             at low latitude regions to a grazing-dominated mortality at
viruses) and phytoplankton. Positive accumulation rates are                          high latitude regions of the North Atlantic during the summer.
then the result of a combination of light driven increases in                        In that study, the decrease in viral lysis rates was inversely
phytoplankton division and slight temporal lags in the response                      associated with the vertical mixing coefficient (KT ; temperature
of mortality agents to these changes in division (Behrenfeld                         eddy diffusivity). Accordingly, increased vertical mixing appears
and Boss, 2014, 2018; Smith et al., 2015). Indeed, our results                       to be proportionally disadvantageous for effective viral control of
revealed a relatively strong coupling between division and total                     phytoplankton populations.
mortality rates (i.e., viral lysis + microzooplankton grazing),                          The activity of microzooplankton grazers and viruses are
with loss accounting for an average of 60–70% of phytoplankton                       ultimately regulated by the rate at which they encounter/contact
growth. Moreover, despite the broad geographical range of our                        a phytoplankton cell (Talmy et al., 2019). Thus, when the mixed
measurements, phytoplankton generally possessed positive rates                       layer deepens and entrains phytoplankton-free water, it dilutes
of accumulation (r).                                                                 the mixed layer population and mortality will be negatively

Frontiers in Microbiology | www.frontiersin.org                                  9                                        August 2021 | Volume 12 | Article 706137
Mojica et al. Balance Between Division and Loss
affected as a consequence of reduced encounter rates. As obligate their light environment as they are moved vertically through
parasites, however, viruses are also completely dependent upon the water column by turbulent mixing. Consequently, the more
their host for all their metabolic needs (i.e., molecular building static light conditions of incubations (only reflecting natural light
blocks and energy). Consequently, suboptimal host growth fluctuations by cloud cover) targeting the light level at the depth
conditions may negatively affect virus infection and progeny of sampling, resulted in changes in PAR that were by-in-large
production (Mojica and Brussaard, 2014). This is highlighted by positive. The division rate of the phytoplankton communities
the roles in which light can regulate viral infection dynamics within the incubations responded to the change in PAR relative
in photosynthetic hosts. Light availability can influence viral to their in situ light level in a manner reminiscent of a
adsorption, latent period and burst size, with low light prolonging typical photosynthesis-irradiance (P-I) curve (Figure 5). Indeed,
the latent period and reducing burst size (Cseke and Farkas, 1979; a positive linear relationship between PAR (i.e., incubation PAR)
Juneau et al., 2003; Brown et al., 2007; Baudoux and Brussaard, and gross division rate (µ) can be seen for PAR less than 0.5
2008; Jia et al., 2010; Maat et al., 2016; Thamatrakoln et al., mole photons m−2 h−1 , suggesting that these phytoplankton
2019). Consequently, phytoplankton experiencing light-limited populations were light limited in situ. At supersaturating PAR,
conditions within a deep mixing layer would likely be inadequate division rate declined to 0.8 day−1 , most likely as a consequence
hosts for efficient viral production. Viruses typically have a of photoinhibition.
narrow host specificity, with most viruses infecting only one host During the phytoplankton annual cycle, accelerations
species, and therefore can be also be affected by factors regulating and decelerations in division arise from “bottom up” factors
phytoplankton diversity (Ostfeld and Keesing, 2012; Short, 2012). (i.e., light or nutrient availability) and can act as a form
Disturbance is expected to initially increase diversity by favoring of disturbance influencing the balance between division
the less competitive faster growing organisms (Behrenfeld et al., and loss rate (Behrenfeld and Boss, 2018). In the present
2021). Indeed, a recent study in the North Atlantic reveals study, our incubations essentially emulated the effect of
phytoplankton diversity, based on amplicon sequence variants accelerating division rates through ‘light perturbations’
of the V1–V2 region of the 16S rRNA gene, was highest during that caused incubation division rates to differ from in situ
the accumulation phase of the annual cycle (March–April) and rates. The influence of these perturbations on the balance
declined during the bloom phase (May–June) (Karp-Boss et al., between division and loss was apparent in the lack of a
2020). Accordingly, viruses would have a lower percentage of corresponding response in phytoplankton mortality. In other
success arising from contact to a phytoplankton cell relative words, phytoplankton growth was accelerated and decoupled
to their grazing counterparts (i.e., mainly restricted by size from mortality, resulting in enhanced accumulation rates. These
limitations) during the accumulation phase. Viral infection is results provide a clear experimental demonstration of a central
most effective when their host abundance is high and growth element of the Disturbance Recovery Hypothesis, specifically that
conditions are optimal, and host diversity is relatively low. The phytoplankton accumulation rates (r) are quantitatively linked to
impact of viruses can therefore be expected to be most noticeable the rate of change in division (1µ) (Behrenfeld and Boss, 2018).
during enhanced phytoplankton density, such as found during
the final stages of blooms development. As such, viruses may
play a particularly important role in closing the gap between DATA AVAILABILITY STATEMENT
division and loss as phytoplankton transition from the spring
accumulation phase to the summer equilibrium phase (i.e., The raw data supporting the conclusions of this article will be
division and losses in a near balanced state) of the annual made available by the authors, without undue reservation.
phytoplankton cycle, driven by the efficiency of infection rising
in parallel to the shoaling of the mixed layer.
AUTHOR CONTRIBUTIONS
Implications of Light Conditions CB conceived the NICO Leg 8 cruise plan and original
As anticipated for spring, the balance between phytoplankton experimental design. CB and MC collected the samples and
division and loss tends toward positive accumulation rates. executed experiments in the field, and performed the initial FCM
A notable attribute of the measured accumulation rates is that analysis. KM, MB, and CB devised the concept and design of
their projection in time would indicate that full bloom climax the manuscript. KM performed the final analysis and drafted the
concentrations would be reached on the order of days. This manuscript. All authors contributed the revision and final editing
timescale implies a major decoupling of phytoplankton division of the manuscript and were aware of, accept responsibility for this
and loss rates and is surprising given that bloom development manuscript, and have approved the submitted manuscript.
in the North Atlantic typically takes place over much longer
time periods (commonly months) (Behrenfeld et al., 2013). While
we acknowledge that this projection does not account for the FUNDING
likelihood that viral induced mortality increases in parallel with
light driven-increases in phytoplankton division, our results This research was conducted as part of the Netherlands
indicate that increased light availability in incubations relative to Initiative Changing Oceans (NICO) expedition and funded
in situ could largely account for this discrepancy. Phytoplankton by The Dutch Research Council (NWO) and coordinated by
within the mixed layer are continually exposed to changes in NIOZ-NMF (National Marine Facilities). We also acknowledge
Frontiers in Microbiology | www.frontiersin.org 10 August 2021 | Volume 12 | Article 706137Mojica et al. Balance Between Division and Loss
the National Aeronautics and Space Administration North NIOZ personnel for their on-board assistance; Karel Bakker and
Atlantic Aerosol and Marine Ecosystems Study (NAAMES; Grant Sharyn Ossebaar for nutrient analysis, and Santiago Gonzales and
NNX15AF30G) and EXPORTS study (Grant 80NSSC17K0568) Margot Maathuis for experimental set-up and flow cytometry.
for MB and KM.
SUPPLEMENTARY MATERIAL
ACKNOWLEDGMENTS
The Supplementary Material for this article can be found
We thank the captain and crew of the R/V Pelagia for their online at: https://www.frontiersin.org/articles/10.3389/fmicb.
help with sampling during the cruise. We thank the following 2021.706137/full#supplementary-material
REFERENCES Caceres, C., Taboada, F. G., Hofer, J., and Anadon, R. (2013). Phytoplankton
growth and microzooplankton grazing in the subtropical Northeast Atlantic.
Austin, R. W. (1974). “The remote sensing of spectral radiance from below the PLoS One 8:e69159. doi: 10.1371/journal.pone.0069159
ocean surface,” in Optical Aspects of Oceanography, eds N. G. Jerlov and E. Calbet, A., and Alcaraz, M. (2009). “Microzooplankton, key organisms in the
Steemann-Nielsen (New York: Elsevier), 317–344. pelagic food web,” in Fisheries and Aquaculture, ed. P. Safran (Oxford: EOLSS
Baudoux, A. C., and Brussaard, C. P. D. (2008). Influence of irradiance on virus- Publications), 227–242.
algal host interactions. J. Phycol. 44, 902–908. doi: 10.1111/j.1529-8817.2008. Carton, J. A., Grodsky, S. A., and Liu, H. (2008). Variability of the oceanic mixed
00543.x layer, 1960-2004. J. Clim. 21, 1029–1047. doi: 10.1175/2007jcli1798.1
Baudoux, A. C., Noordeloos, A. A. M., Veldhuis, M. J. W., and Brussaard, C. P. D. Cseke, C., and Farkas, G. L. (1979). Effect of light on the attachment of cyanophage
(2006). Virally induced mortality of Phaeocystis globosa during two spring AS-1 to Anacystis nidulans. J. Bacteriol. 137, 667–669. doi: 10.1128/jb.137.1.
blooms in temperate coastal waters. Aquat. Microb. Ecol. 44, 207–217. doi: 667-669.1979
10.3354/ame044207 de Boyer Montégut, C. D., Madec, G., Fischer, A. S., Lazar, A., and Iudicone, D.
Behrenfeld, M., Boss, E. S., and Halsey, K. H. (2021). Phytoplankton community (2004). Mixed layer depth over the global ocean: an examination of profile data
structuring and succession in a competition-neutral resource landscape. ISME and a profile-based climatology. J. Geophys. Res.-Oceans 109:C12003.
Commun. 1:12. Deser, C., and Blackmon, M. L. (1993). Surface climate variations over the North
Behrenfeld, M. J. (2010). Abandoning Sverdrup’s Critical Depth Hypothesis on Atlantic ocean during winter: 1900-1989. J. Clim. 6, 1743–1753. doi: 10.1175/
phytoplankton blooms. Ecology 91, 977–989. doi: 10.1890/09-1207.1 1520-0442(1993)0062.0.co;2
Behrenfeld, M. J. (2014). Climate-mediated dance of the plankton. Nat. Clim. Field, C. B., Behrenfeld, M. J., Randerson, J. T., and Falkowski, P. (1998). Primary
Change 4, 880–887. doi: 10.1038/nclimate2349 production of the biosphere: integrating terrestrial and oceanic components.
Behrenfeld, M. J., Boss, E., Siegel, D. A., and Shea, D. M. (2005). Carbon- Science 281, 237–240. doi: 10.1126/science.281.5374.237
based ocean productivity and phytoplankton physiology from space. Glob. Follows, M., and Dutkiewicz, S. (2002). Meteorological modulation of the North
Biogeochem. Cycles 19:GB1006. Atlantic spring bloom. Deep Sea Res. Part II 49, 321–344. doi: 10.1016/s0967-
Behrenfeld, M. J., and Boss, E. S. (2014). Resurrecting the ecological underpinnings 0645(01)00105-9
of ocean plankton blooms. Annu. Rev. Mar. Sci. 6, 167–194. doi: 10.1146/ Fox, J., Weisberg, S., Adler, D., Bates, D., Baud-Bovy, G., Ellison, S., et al. (2016).
annurev-marine-052913-021325 car: Companion to Applied Regression. R Package Version 2.1-4.
Behrenfeld, M. J., and Boss, E. S. (2018). Student’s tutorial on bloom hypotheses Friend, A. D., Geider, R. J., Behrenfeld, M. J., and Sill, C. J. (2009). “Photosynthesis
in the context of phytoplankton annual cycles. Glob. Change Biol. 24, 55–77. in global scale models,” in Photosynthesis in Silico: Understanding Complexity
doi: 10.1111/gcb.13858 from Molecules to Ecosystems, eds A. Laisk, L. Nedbal, and G. Govindjee
Behrenfeld, M. J., Doney, S. C., Lima, I., Boss, E. S., and Siegel, D. A. (2013). (Netherlands: Springer), 465–497. doi: 10.1007/978-1-4020-9237-4_20
Annual cycles of ecological disturbance and recovery underlying the subarctic Gallegos, C. L., Vant, W. N., and Safi, K. A. (1996). Microzooplankton grazing of
Atlantic spring plankton bloom. Glob. Biogeochem. Cycles 27, 526–540. doi: phytoplankton in Manukau Harbour, New Zealand. N. Zeal. J. Mar. Freshw. Res.
10.1002/gbc.20050 30, 423–434. doi: 10.1080/00288330.1996.9516730
Behrenfeld, M. J., Hu, Y. X., O’malley, R. T., Boss, E. S., Hostetler, C. A., Siegel, Gifford, D. J., Fessenden, L. M., Garrahan, P. R., and Martin, E. (1995). Grazing by
D. A., et al. (2017). Annual boom-bust cycles of polar phytoplankton biomass microzooplankton and mesozooplankton in the high-latitude North Atlantic
revealed by space-based lidar. Nat. Geosci. 10, 118–122. doi: 10.1038/ngeo2861 Ocean: Spring versus summer dynamics. J. Geophys. Res. Oceans 100, 6665–
Biller, S. J., Berube, P. M., Lindell, D., and Chisholm, S. W. (2014). Prochlorococcus: 6675. doi: 10.1029/94jc00983
the structure and function of collective diversity. Nat. Rev. Microbiol. 13, 13–27. Gran, H. H., and Braarud, T. (1935). A quantitative study of the phytoplankton
doi: 10.1038/nrmicro3378 in the Bay of Fundy and the Gulf of Maine (including observations on
Brainerd, K. E., and Gregg, M. C. (1995). Surface mixed and mixing layer depths. hydrography, chemistry and turbidity). J. Biol. Board Canada 1, 279–467. doi:
Deep Sea Res. Part I Oceanogr. Res. Pap. 42, 1521–1543. doi: 10.1016/0967- 10.1139/f35-012
0637(95)00068-h Grasshoff, K. (1983). “Determination of nitrate,” in Methods of Seawater Analysis,
Brown, C. M., Campbell, D. A., and Lawrence, J. E. (2007). Resource dynamics eds K. Grasshoff, M. Erhardt, and K. Kremeling (Weinheim: Verlag Chemie),
during infection of Micromonas pusilla by virus MpV-Sp1. Environ. Microbiol. 143–150.
9, 2720–2727. doi: 10.1111/j.1462-2920.2007.01384.x Helder, W., and de Vries, R. T. P. (1979). An automatic phenol-hypochlorite
Brussaard, C. P. D. (2004). Viral control of phytoplankton populations - a review. method for the determination of ammonia in sea and brackish water.
J. Eukaryotic Microbiol. 51, 125–138. doi: 10.1111/j.1550-7408.2004.tb00 Netherlands J. Sea Res. 13, 154–160. doi: 10.1016/0077-7579(79)90038-3
537.x Henson, S. A., Dunne, J. P., and Sarmiento, J. L. (2009). Decadal variability
Brussaard, C. P. D., Kuipers, B., and Veldhuis, M. J. W. (2005). A mesocosm study in North Atlantic phytoplankton blooms. J. Geophys. Res.-Oceans
of Phaeocystis globosa population dynamics - I. Regulatory role of viruses in 114:C04013.
bloom control. Harmful Algae 4, 859–874. doi: 10.1016/j.hal.2004.12.015 Jia, Y., Shan, J. Y., Millard, A., Clokie, M. R. J., and Mann, N. H. (2010).
Brussaard, C. P. D., Wilhelm, S. W., Thingstad, T. F., Weinbauer, M. G., Bratbak, Light-dependent adsorption of photosynthetic cyanophages to Synechococcus
G., Heldal, M., et al. (2008). Global-scale processes with a nanoscale drive: the sp WH7803. FEMS Microbiol. Lett. 310, 120–126. doi: 10.1111/j.1574-6968.
role of marine viruses. ISME J. 2, 575–578. doi: 10.1038/ismej.2008.31 2010.02054.x
Frontiers in Microbiology | www.frontiersin.org 11 August 2021 | Volume 12 | Article 706137Mojica et al. Balance Between Division and Loss Juneau, P., Lawrence, J. E., Suttle, C. A., and Harrison, P. J. (2003). Effects of viral Platt, T., Gallegos, C. L., and Harrison, W. G. (1980). Photoinhibition of infection on photosynthetic processes in the bloom-forming alga Heterosigma photosynthesis in natural assemblages of marine phytoplankton. J. Mar. Res. akashiwo. Aquat. Microb. Ecol. 31, 9–17. doi: 10.3354/ame031009 38, 687–701. Karp-Boss, L., Bolanos, L. M., Giovannoni, S. J., Graff, J., Carbonell-Moore, R Development Core Team (2012). R: A Language and Environment for Statistical C., Haentjens, N., et al. (2020). “Linking phytoplankton diversity in the Computing. Vienna: R Foundation for Statistical Computing. North Atlantic to the annual cycle of ecological disturbance and recovery,” in Schlitzer, R. (2002). Interactive analysis and visualization of geoscience data with Proceedings of thr Ocean Sciences, San Diego, CA. doi: 10.1007/978-94-017- Ocean Data View. Comput. Geosci. 28, 1211–1218. doi: 10.1016/s0098-3004(02) 1919-3_2 00040-7 Kimmance, S. A., and Brussaard, C. P. D. (2010). “Estimation of viral-induced Schmoker, C., Hernandez-Leon, S., and Calbet, A. (2013). Microzooplankton phytoplankton mortality using the modified dilution method,” in Manual of grazing in the oceans: impacts, data variability, knowledge gaps and future Aquatic Viral Ecology, eds S. W. Wilhelm, M. Weinbauer, and C. A. Suttle directions. J. Plankton Res. 35, 691–706. doi: 10.1093/plankt/fbt023 (Waco, TX: ASLO), 65–73. doi: 10.4319/mave.2010.978-0-9845591-0-7.65 Schroeder, D. C., Oke, J., Hall, M., Malin, G., and Wilson, W. H. (2003). Koroleff, F. (1969). Direct Determination of Ammonia in Natural Waters as Virus succession observed during an Emiliania huxleyi bloom. Appl. Environ. Indophenol Blue. Coun Meet int Coun Explor Sea C.M.-ICES/C: 9. New York, Microbiol. 69, 2484–2490. doi: 10.1128/aem.69.5.2484-2490.2003 NY: ICES. Sherr, E. B., and Sherr, B. F. (2002). Significance of predation by protists in aquatic Legendre, P., and Legendre, L. (1998). Numerical Ecology. Amsterdam: Elsevier microbial food webs. Antonie van Leeuwenhoek Int. J. Gen. Mol. Microbiol. 81, Science BV. 293–308. Lorbacher, K., Dommenget, D., Niiler, P. P., and Kohl, A. (2006). Ocean mixed Short, S. M. (2012). The ecology of viruses that infect eukaryotic algae. Environ. layer depth: a subsurface proxy of ocean-atmosphere variability. J. Geophys. Microbiol. 14, 2253–2271. doi: 10.1111/j.1462-2920.2012.02706.x Res.-Oceans 111:C07010. Siegel, D. A., Doney, S. C., and Yoder, J. A. (2002). The North Atlantic spring Maat, D. S., De Blok, R., and Brussaard, C. P. D. (2016). Combined phosphorus phytoplankton bloom and Sverdrup’s critical depth hypothesis. Science 296, limitation and light stress prevent viral proliferation in the phytoplankton 730–733. doi: 10.1126/science.1069174 species Phaeocystis globosa, but not in Micromomas pusilla. Front. Mar. Sci. Smith, M. J., Tittensor, D. P., Lyutsarev, V., and Murphy, E. (2015). Inferred 3:160. doi: 10.3389/fmars.2016.00160 support for disturbance-recovery hypothesis of North Atlantic phytoplankton Matsuyama, Y., Miyamoto, M., and Kotani, Y. (1999). Grazing impacts of the blooms. J. Geophys. Res. Oceans 120, 7067–7090. doi: 10.1002/2015jc01 heterotrophic dinoflagellate Polykrikos kofoidii on a bloom of Gymnodinium 1080 catenatum. Aquat. Microb. Ecol. 17, 91–98. Strickland, J. D. H., and Parsons, T. R. (1968). Determination of Reactive Silicate. McDougall, T. J., and Barker, P. M. (2011). Getting Started with TEOS-10 and A Practical Handbook of Seawater Analysis. Ottawa: Fisheries Research Board the GIbbs Seawater (GSW) Oceanographic Toolbox. 3.3. SCOR/IAPSO WG127. of Canada. Paris: SCOR. Suttle, C. A. (2007). Marine viruses - major players in the global ecosystem. Nat. Mojica, K. D. A., and Brussaard, C. P. D. (2014). Factors affecting virus dynamics Rev. 5, 801–812. doi: 10.1038/nrmicro1750 and microbial host-virus interactions in marine environments. FEMS Microbiol. Sverdrup, E. U. (1953). On conditions for the vernal blooming of phytoplankton. Ecol. 89, 495–515. doi: 10.1111/1574-6941.12343 J. Cons. Cons. Int. Explor. Mer. 18, 287–295. doi: 10.1093/icesjms/18.3.287 Mojica, K. D. A., Huisman, J., Wilhelm, S. W., and Brussaard, C. P. D. (2016). Talmy, D., Beckett, S. J., Zhang, A. B., Taniguch, D. A. A., Weitz, J. S., and Latitudinal variation in virus-induced mortality of phytoplankton across the Follows, M. J. (2019). Contrasting controls on microzooplankton grazing and North Atlantic Ocean. ISME J. 10, 500–513. doi: 10.1038/ismej.2015.130 viral infection of microbial prey. Front. Mar. Sci. 6:182. doi: 10.3389/fmars.2019. Mojica, K. D. A., van de Poll, W. H., Kehoe, M., Huisman, J., Timmermans, K. R., 00182 Buma, A. G. J., et al. (2015). Phytoplankton community structure in relation Thamatrakoln, K., Talmy, D., Haramaty, L., Maniscalco, C., Latham, J. R., Knowles, to vertical stratification along a north-south gradient in the Northeast Atlantic B., et al. (2019). Light regulation of coccolithophore host-virus interactions. Ocean. Limnol. Oceanogr. 60, 1498–1521. doi: 10.1002/lno.10113 New Phytol. 221, 1289–1302. doi: 10.1111/nph.15459 Monterey, G., and Levitus, S. (1997). Seasonal Variability of Mixed Layer Depth van Aken, H. M. (2000). The hydrography of the mid-latitude Northeast Atlantic for the World Ocean. Silver Spring, MD: National Oceanic and Atmospheric Ocean II: the intermediate water masses. Deep Sea Res. Part I 47, 789–824. Administration. doi: 10.1016/s0967-0637(99)00112-0 Morel, A., Huot, Y., Gentili, B., Werdell, P. J., Hooker, S. B., and Franz, Verity, P. G., Stoecker, D. K., Sieracki, M. E., and Nelson, J. R. (1993). Grazing, B. A. (2007). Examining the consistency of products derived from various growth and mortality of microzooplankton during the 1989 North Atlantic ocean color sensors in open ocean (Case 1) waters in the perspective of a Spring Bloom at 47◦ N, 18◦ W. Deep Sea Res. Part I Oceanogr. Res. Pap. 40, multi-sensor approach. Remote Sens. Environ. 111, 69–88. doi: 10.1016/j.rse. 1793–1814. doi: 10.1016/0967-0637(93)90033-y 2007.03.012 Morgan, P. P. (1994). SEAWATER: A library of MATLAB Computational Routines Conflict of Interest: The authors declare that the research was conducted in the for the Properties of Sea Water. CSIRO Marine Laboratories Report 222. absence of any commercial or financial relationships that could be construed as a Canberra: CSIRO. potential conflict of interest. Morison, F., Harvey, E., Franze, G., and Menden-Deuer, S. (2019). Storm-induced predator-prey decoupling promotes springtime accumulation of North Atlantic Publisher’s Note: All claims expressed in this article are solely those of the authors phytoplankton. Front. Mar. Sci. 6:608. doi: 10.3389/fmars.2019.00608 and do not necessarily represent those of their affiliated organizations, or those of Murphy, J., and Riley, J. P. (1962). A modified single solution method for the the publisher, the editors and the reviewers. Any product that may be evaluated in determination of phosphate in natural waters. Anal. Chim. Acta 27, 31–36. this article, or claim that may be made by its manufacturer, is not guaranteed or doi: 10.1016/s0003-2670(00)88444-5 endorsed by the publisher. Nagasaki, K., Tomaru, Y., Nakanishi, K., Hata, N., Katanozaka, N., and Yamaguchi, M. (2004). Dynamics of Heterocapsa circularisquama (Dinophyceae) and its Copyright © 2021 Mojica, Behrenfeld, Clay and Brussaard. This is an open-access viruses in Ago Bay, Japan. Aquat. Microb. Ecol. 34, 219–226. doi: 10.3354/ article distributed under the terms of the Creative Commons Attribution License ame035219 (CC BY). The use, distribution or reproduction in other forums is permitted, provided Ostfeld, R. S., and Keesing, F. (2012). Effects of host diversity on infectious disease. the original author(s) and the copyright owner(s) are credited and that the original Annu. Rev. Ecol. Evol. Syst. 43, 157–182. doi: 10.1146/annurev-ecolsys-102710- publication in this journal is cited, in accordance with accepted academic practice. No 145022 use, distribution or reproduction is permitted which does not comply with these terms. Frontiers in Microbiology | www.frontiersin.org 12 August 2021 | Volume 12 | Article 706137
You can also read