Staff Paper 2017 Jobseeker claims - comparing characteristics and outcomes for casual and full claimants - Irish Government Economic and ...
←
→
Page content transcription
If your browser does not render page correctly, please read the page content below
Staff Paper 2017
                                     Jobseeker claims – comparing
                                     characteristics and outcomes for
                                     casual and full claimants

                                     Hugh Cronin

                                     November 2017

This paper has been prepared by an IGEES economist working in the Statistics and Business
Intelligence/Activation and Employment Policy Unit of the Department of Employment Affairs
and Social Protection. The views presented in this paper are those of the author alone and do
not represent the official views of the Department of Employment Affairs and Social
Protection or the Minister for Employment Affairs and Social Protection. Analytical papers are
prepared on an ongoing basis and reflect the data available at a given point in time.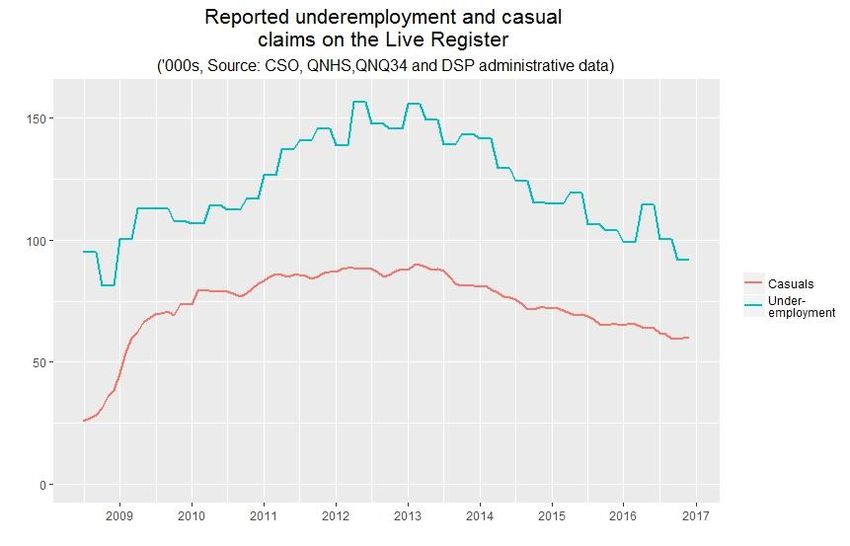
Acknowledgements
This paper benefits from comments on earlier drafts by Terry Corcoran, Niall Egan, Margaret Fox,
Lorcan Hanly, Saidhbhín Hardiman and Dearbháil Nic Giolla Mhicíl. Any errors remain the
responsibility of the author.

                                                                                         1|Page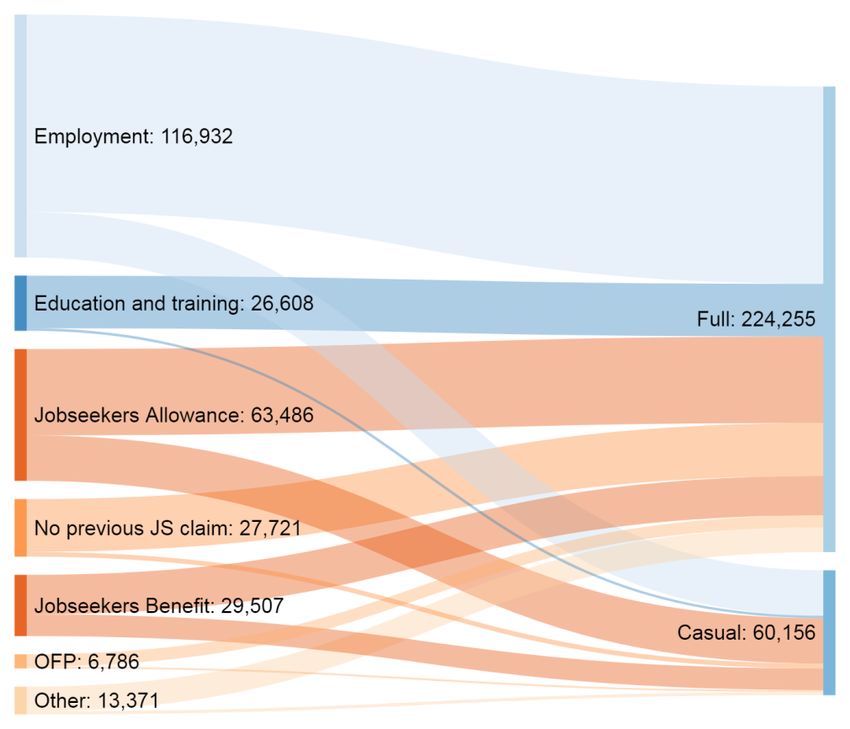
Introduction
This paper examines the subset of part-time workers in receipt of a partial jobseekers
payment. Where eligibility criteria are satisfied, the Department of Employment Affairs
and Social Protection pays partial jobseeker payment to those who are in part-time
employment and seeking full-time work. These workers are situated between full
jobseeker claims and full-time employment.
This paper examines the trends in the numbers involved, and puts these in the context
of survey data on overall trends in part-time employment, in particular part-time
underemployment.
Finally, the analysis compares recipients of these partial jobseekers payment to all
recipients of jobseeker payments. After identifying demographic and labour market
characteristics on 31 December 2015, labour market outcomes are calculated and
compared one year later.
Terminology:
Full jobseeker claims: where someone claims a jobseeker
payment and is not employed for any portion of the week –
it may be the insurance-based Jobseekers Benefit or the
contingency-based income support Jobseekers Allowance.
Casual jobseeker claims: where someone is entitled to a
partial jobseeker payment on the basis of working for fewer
than four days in the week.
Within casual jobseeker claims, there are part-time
workers, who have a regular pattern of working hours, and
casual workers, who are:
normally employed for periods of less than a week
working days vary with activity in business
and have no assurance of return to same employer
For people working under these conditions, there is likely to
be greater variation in earnings, hours, days of work and
duration without work. However, there is no difference in
how their claims are treated compared to part-time
claimants – all are recorded as casual jobseeker claims.
Background
The prevalence of part-time workers supported by jobseeker claims has increased. This
increase began against a backdrop of considerable turbulence in the labour market
between 2009 and 2012. The total number of casual claims has increased to 59,940 at
the end of 2016 having been reasonably steady at approximately 20,000 between 2001
and 2008. The most dramatic increase occurred between October 2008 and March 2009,
with monthly increases between 7% and 19% for every month in this period.
2|Page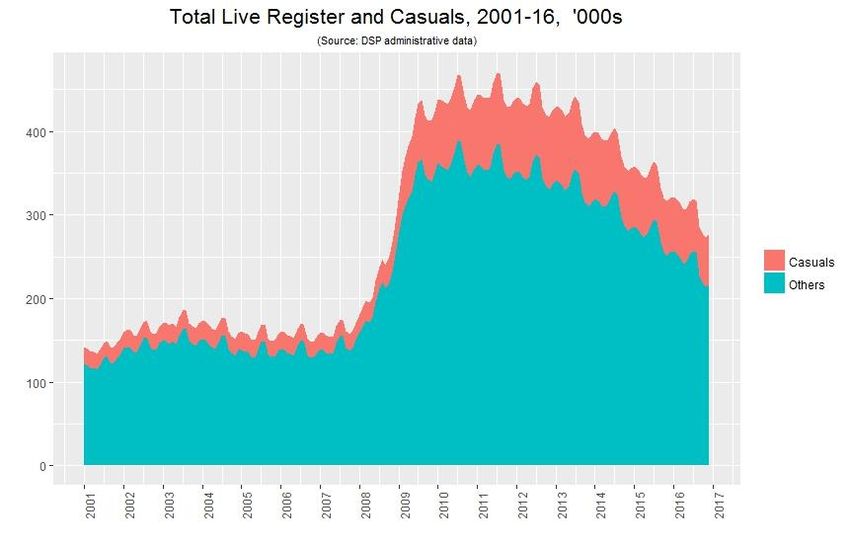
As portion of total on the Live Register, casuals have ranged between 10% and 20%
since 2001, and now account for 21% of the total. i

Figure 1. Live Register and casual claims, 2001-2016

The increase in supported part-time work takes place against a wider increase in part-
time work. Table 1 outlines the number of people in part-time employment in the last
quarter of each year since 2006. The number of people in part-time employment has
grown steadily since 2001 even when the total number of people in employment dropped
significantly. Some 90,000 more workers are now in part-time employment compared to
2007, while the total number of people in employment remains 100,000 off its 2007
peak.

Comparing supported part-time work across countries is complicated by the absence of
an agreed definition of part-time work, and by the variance in the extent to which
countries allow jobseekers to engage in some work. However, as a general indication,
Ireland is located at the upper end of the OECD’s measurement of the prevalence of
part-time work (OECD, EU-28 and Ireland are highlighted).ii

                                                                            3|Page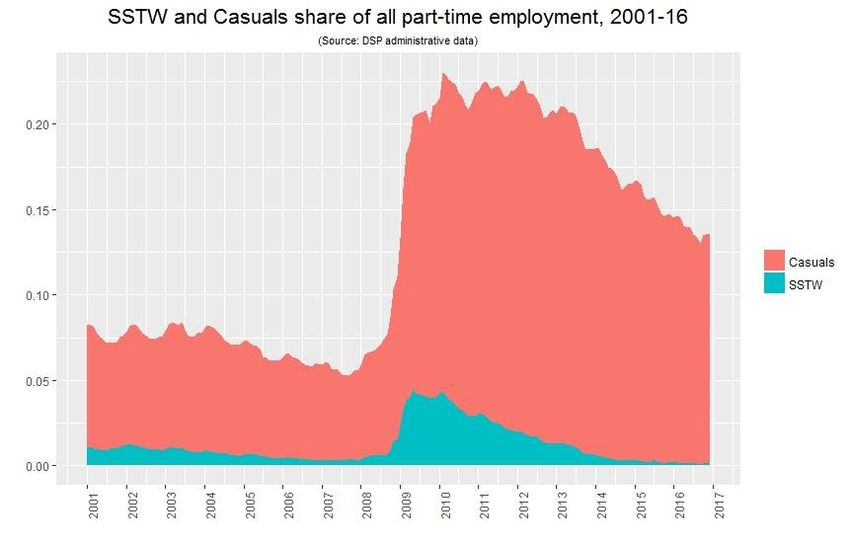
Figure 2.OECD (2017), Part-time employment rate (indicator). doi: 10.1787/f2ad596c-en (Accessed on 13 November
2017)

In considering how the Irish situation may develop, it is worth noting the trend in part-
time employment in the UK, where labour market institutions resemble Ireland’s more
closely than most EU member states or OECD countries. As a share of all workers in the
UK, part-time workers have remained close to 25% for the past 15 years. iii

Persons,          2006     2007      2008     2009      2010      2011      2012      2013      2014      2015    2016
‘000s               Q4       Q4        Q4       Q4        Q4        Q4        Q4        Q4        Q4        Q4      Q4

In               2,091.2    2,156   2,083.5   1,921.4   1,857.3   1,847.7   1,848.9   1,909.8   1,938.9   1,983   2,048.1

employment

In part-time       355.3    390.7      401     430.7     434.4     436.2     450.2     456.8     446.4    451.6    444.8

employment

Part-time as      17.0%    18.1%     19.2%     22.4%     23.4%     23.6%     24.3%     23.9%     23.0%    22.8%    21.7%

% of total
employment

Table 1- Number of persons in employment and part-time employment Source: CSO; QNQ34 from QNHS

The total number of people in part-time employment includes

    o      those working part-time by choice, and not seeking additional hours, and
    o      those seeking full-time work.

The latter are the workers who may receive partial jobseeker payments, subject to
eligibility criteria. As part of an overall increase in part-time work, the share of the
underemployed – those willing and available to start more hours immediately – remains
higher than its 2008 level, although it has dropped considerably from its peak in 2011-
12. Where people in this cohort of the underemployed fulfil the Jobseekers Allowance
criteria, the Department of Employment Affairs and Social Protection will pay a portion of
the full jobseeker’s rate (outlined in the section on eligibility).

                                                                                                           4|Page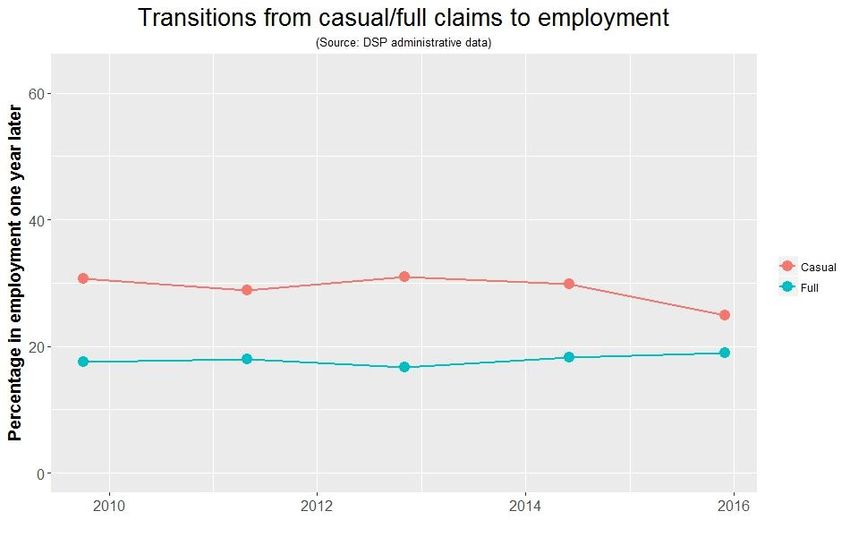
When considering those who work and would like to work more, the term
‘underemployed’ refers to respondents to Labour Force Survey (LFS) questionnaires who
report their current hours to be too few, and are prepared to work more hours, and are
available for work immediately. Table 2 compares, as a proportion of all people in
employment, part-time workers who are underemployed and those who are not
underemployed in the last quarter of each year between 2008 and 2016.

As a proportion
of all people in
employment,
the percentage
of part-time
workers who              2008       2009      2010    2011      2012      2013      2014      2015      2016
are…                       Q4         Q4        Q4      Q4        Q4        Q4        Q4        Q4        Q4

Not                       15.3      16.8      17.1     15.7      16.5      16.4      17.1      17.5     17.2
underemployed

Underemployed              3.9        5.6      6.3      7.9       7.9       7.5       6.0       5.2      4.5

Table 2- Percentage underemployed and not underemployed, Q4 in 2008-2016 Source: CSO; QNQ34 from QNHS

The number of people signing on the Live Register as part-time or casual workers is set
out in Figure 3, which sets the increase against the number of underemployed workers in
Ireland. The source is the Quarterly National Household Survey (QNHS), the quarterly
measure of unemployment and the Irish input to the LFS. The number of people who
describe themselves as underemployed in response to the QNHS questionnaire is
displayed against the number of people signing on the Live Register on casual claims.

Figure 3. Underemployment and casual claims

                                                                                                 5|Page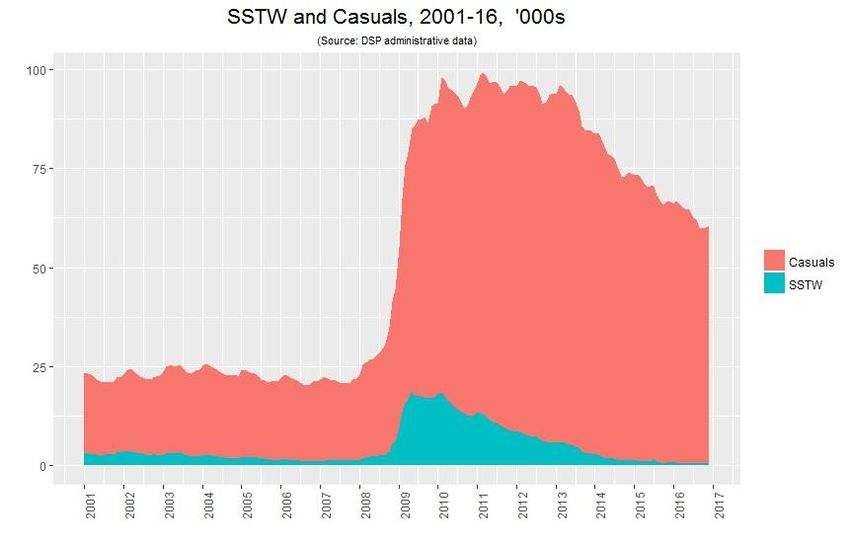
The trend of the increase in casual claims mirrors the increase in reported
underemployment from the QNHS across the late 2000s. However, the rate of reported
underemployment has decreased almost to 2009 levels, whereas the number of casual
claims has not decreased in a similar fashion. Also of note is the difference in levels, with
the number of casual claims averaging at 60% of the people who report themselves as
underemployed.

The discrepancy between the number of people who describe themselves as
underemployed and those who have casual claims can be attributed to three factors:

    o    those whose part-time work extends across more than three days and are
         therefore not eligible for a jobseekers payment
    o    those who are entitled to make a casual claim but will not receive any payment
         due to their family circumstances or their financial means
    o    those on part-time public employment programmes such as Community
         Employment or Tús.

The driver of the increase in casual claims was the destruction of employment that
occurred between 2009 and 2012. Initially, employers appear to have responded to the
decrease in demand for goods and services by reducing workers’ hours rather than
making them redundant. This approach enables employers to smooth the reduction in
demand and, once a recession ends, quickly resume a higher level of output. The most
widely known application of this short-time work approach is the Kurzarbeit programme
in Germany. The relatively low increase in unemployment in Germany between 2007 and
2009, despite a significant drop in economic activity, is partly attributed to this
programme.

In Ireland, the Systematic Short Time Work (SSTW) programme closely mirrors
Kurzarbeit. The number of SSTW and casual claims reflects the dramatic decrease in
demand for full-time employees. If employers expected the recession to be short-lived, it
made sense to direct employees towards the SSTW rather than making them redundant.
However, this sharp spike in SSTW claims was relatively short-lived and, thereafter, the
increase was limited to casual claims (Figure 4).

Figure 4. SSTW and casuals, '000s, 2001-2016

                                                                                   6|Page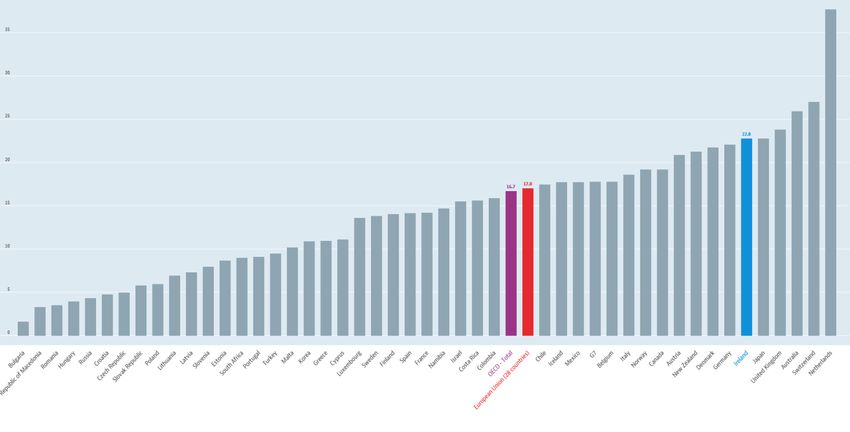
Figure 5. SSTW and casuals share of all part-time employment, 2001-2016

SSTW only applies to those whose hours are reduced to something less than full-time
work, whereas casual is a broader category that includes those moving from full-time to
part-time work and from full unemployment to part-time work. In other words, the
casual cohort includes people engaged in part-time work from both directions: entering
part-time work from full unemployment and entering part-time work from full
employment.iv

Eligibility
As with all recipients of jobseeker payments, there is an obligation on casual workers to
be genuinely seeking full-time work. This applies regardless of the duration of any part-
time work they undertake.

Casual jobseeker claimants are entitled to work up to three days per week and receive a
payment in respect of the other four days. The number of hours worked over those three
days is not taken into account. The final amount may vary depending on the number of
dependents, the means test, the employment status of a spouse or partner, and any
reductions in payments made by the Department of Employment Affairs and Social
Protection.

Typically, approximately 20% of casual claims on the Live Register are not in receipt of
payment in a given week.

                             Calculation of casual jobseeker payment:

      Maximum Jobseekers Allowance payment - weekly means (60% of earnings,
          minus any disregards) = cash transfer for casual jobseeker claims

Policy relevance
When considering options for the wider jobseeker cohort, it is useful to have an
indication of the probability of casual jobseeker claims acting as a stepping stone to full-
time employment. This paper makes a contribution to this question by analysing the
characteristics and outcomes of casual jobseekers compared to full claims.

                                                                                  7|Page
In general, labour market theory suggests that remaining in close contact with the
labour market can assist in the move from (a given level of) unemployment to
employment. Being in part-time employment is a means of maintaining skills, gaining
sectoral knowledge, growing a network of contacts and developing new competencies. It
also signals to prospective employers the acquisition and maintenance of soft skills
required in the workplace (reliability, ability to work alone or as part of a team). In
addition, part-time work may serve as an initial screening process for employers who
want to recruit full-time workers. The empirical evidence from international studies
supports the idea that providing unemployment benefits for part-time employment can
act as a stepping stone to full-time employment.v
The cohort of casual workers is specifically relevant to the Government’s cross-
Departmental labour market activation strategy, Pathways to Work 2016-2020vi. This
medium-term strategy document aims to provide services to those beyond the
traditional jobseeker cohort, as the more pressing challenges of youth and long-term
unemployment recede. Part of this strategy involves activation of casual workers, either
through referral to the Intreo service or the Department’s contracted service, JobPath.
In practical terms, the activation of casual claimants poses one problem that does not
arise for the full claim cohort: how to marry part-time work with activation and training.
In the case of people working part-time, if there is to be any intervention from the State
other than support to seek additional work, it must be clear that it improves the
likelihood of a transition to full-time employment compared to no intervention. Referral
to full-time training programmes, for example, will break casual workers’ links to the
labour market, albeit with the expectation of an increase in human capital. This trade-off
will continue to be particularly acute unless training courses can be delivered in a
manner compatible with ongoing work.
Comparing casual and full jobseeker claims
This analysis uses the Jobseekers Longitudinal Dataset (JLD), an administrative dataset
that tracks social welfare claims, activation and training, and employment histories over
time, covering individuals with jobseeker or One-parent Family Payment claims since
2004.vii The dataset takes operational data from a range of sources and rearranges them
into a view of each individual’s episodes of unemployment, employment, and training.
The data are structured in a way that bears some relation to a panel dataset but with
important distinctions. To reflect the individual experience of employment and
unemployment, each episode commences when the person begins a spell of
unemployment and ends when the person moves to employment or another activation or
training programme. The next episode begins when the person’s employment or training
status changes again. In this way, it differs from panel data in that observations are not
recorded at fixed points but at points of transition from one status to another.
It is worth restating the distinction between the count of recipients of jobseeker
payments and credited contributions from the Department of Employment Affairs and
Social Protection (the Live Register), unemployment (measured by the QNHS), and the
dataset used in this analysis (the JLD), which counts all jobseeker and OFP claims but
also episodes of activation or training programmes.viii In other words, the JLD records all
open jobseeker episodes, including where people have become eligible for a
training/activation programme and are no longer being counted on the Live Register.
8|PageThis descriptive analysis examines all open jobseeker claims on 31 December 2015. This
amounts to a close approximation of Live Register claims, although the Live Register
includes claims pending at the time of publication, whereas any claims that have
subsequently been dropped or not awarded will not appear on the JLD.
Claim type Frequency Percent Live Register
Full claim 224,255 71% 223,107*
Casual 60,156 19% 65,678
Credits 32,554 10% 32,518
Total 316,965 100% 321,616
Table 3. Claim types, frequency. Source: DEASP administrative data, CSO.
*Note: The Live Register publication does not use the term ‘full claim’ – in order to estimate how this analysis compares
with published Live Register figures it has been derived by subtracting casual claims and credits from the total.
Table 3 outlines the split between full claims, casual claims and those signing for credits.
For comparison, the total number of claims recorded on the Live Register in December
2015 was 321,616, of which 65,678 were casuals and 32,518 were signing for credits.
For the purpose of comparing labour market outcomes between casual claims and other
jobseekers, those signing for credits in this period have been excluded (Table 4).
Claim Frequency Percent Cumulative
type frequency
Full claim 224,255 78.85 224,255
Casual 60,156 21.15 284,411
Table 4. Comparison of full and casual claims after removal of those on credits. Source: DEASP administrative data
The following tables compare the casual cohort and full jobseekers. They do not include
those on activation programmes and training courses. For clarity of presentation, tables
show the distribution of the values of a given variable for casual and full claims. Chi-
square tests have been carried out on all tables and, with an alpha level of 0.05, a
statistically significant difference exists in all cases (see appendix).ix
9|PageDescriptive analysis – demographic characteristics
This section presents some of the demographic and labour market characteristics of the
cohort under analysis – further tables are provided in the appendix.
Compared to the broader jobseeker population, a higher percentage of casual claimants
are in the 30-39 and 40-49 age groups. The mean age of those with casual claims is
39.9 (39.4 for full claims) and the median is 38.6 for casuals (38.1 years for full claims).
The mean age is drawn up by the number of claimants retired from employment who do
not yet qualify for the State pension (currently 66 years).
Casual/full jobseekers,
by age group Casual Full
Under 25 8.9 14.4
25-29 14.7 14.2
30-39 29.9 26.0
40-49 23.6 21.4
50-59 17.9 17.0
60+ 5.1 7.0
Total 100 100
Table 5. Age group in years by casual/full claims (N=284,411)
Male and female claimants are more evenly balanced in the casual cohort than in the full
jobseeker cohort – men represent 53% of the casual cohort but 65% of full claims. Table
6 shows the marked difference in nationality groups: those from what are referred to as
the 2004 accession states (EU15-28) account for a greater share of the casual cohort
than the full claim cohort.
Casual/full jobseekers,
by broad nationality group Casual Full claim
EU13 0.9 1.1
EU15-28 14.3 9.1
Irish 79.6 83.2
Rest Of World 2.1 2.6
UK 3.1 4.0
Total 100 100
Table 6. Percentage of each nationality group in casual and full cohort (N=284,411)
Moving from nationality to location, the ratio of full jobseeker claims to casual claims is
broadly similar for most counties. This location variable refers to the Intreo office at
10 | P a g ewhich the person makes a claim rather than to the residence of the claimant. Table 15,
in the appendix, displays each county’s contribution to the total population of full and
casual claims. The greatest discrepancy between the two categories occurs along parts
of the west of Ireland (Donegal, Mayo, Leitrim and Kerry) and in the south-east
(Wexford, Kilkenny, Waterford, Carlow). These counties, along with Monaghan, all have
a share of the casual population that is at least 10% greater than the county’s share of
the jobseeker population. The reverse is the case in Dublin, which accounts for 26% of
the jobseeker population but only 18% of the casual population.
Family structure looks broadly similar for casual and full claims, although casual
claimants are more likely to have child dependents. Differences exist between the family
structures of male and female claimants (Table 7). In the case of full claims, men are
more likely than women to have no adult or child dependants – for casuals, the reverse
is true. Similarly, men with adult and child dependants make up a greater share of the
casual jobseekers cohort than of the full claim cohort whereas women with that family
structure make up less of the casual cohort than they do in the full cohort.
Casual/full jobseekers,
Male Female
by sex and family structure
Casual Full Casual Full
Adult and child dependant 21.1 15.9 11.9 13.9
Adult dependant only 8.4 7.7 4.5 4.4
Child dependant only 9.4 6.4 15.7 20.0
Neither 61.1 70.0 67.9 61.6
Total 100 100 100 100
Table 7. Percentage of each family claim type in casual and full cohort, by sex (N=284,411)
11 | P a g eDescriptive analysis - labour market characteristics
Having outlined the demographic characteristics of the population, we turn to labour
market characteristics. The first variable analysed is sector, which takes account of the
dominant sector in which someone was employed over a four-year periodx. Casual
claimants are more prominent in the wholesale and retail and accommodation and food
service activities sectors (see annex for full table).
In discussing sector, it is more realistic to compare casual jobseekers’ sector with that of
all people in employment rather than comparing casual claimants to full claim jobseekers
– a considerable proportion of whom have no sectoral information for the past four
years.
Table 8 shows the
previous status of
individuals with open
claims on 31
December 2015
(Figure 5 illustrates
the same information
by showing the flow
from previous
statuses to either full
or casual claims). It
does not reflect any
particular timeframe –
the previous episode
depends on the
duration of the
episode open on 31
December 2015.xi
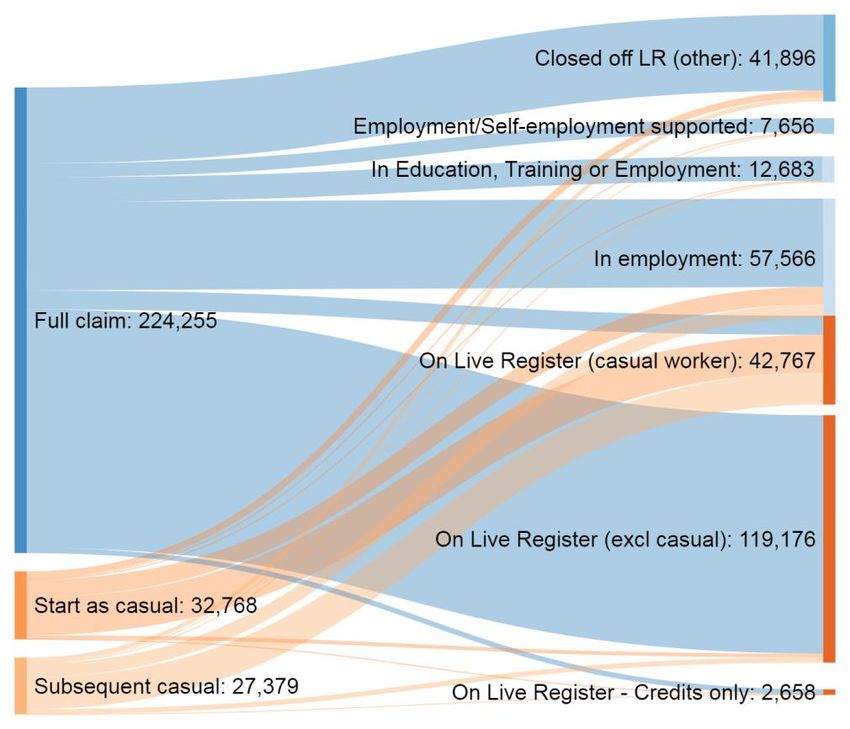
Casual jobseekers are
more likely to come
from Jobseekers
Figure 6. Origin of casual and full jobseeker claims(N=284,411). Diagram created using
SankeyMATIC
(Allowance or Benefit)
payments and
employment. They are noticeably less likely to transition from Education and Training.
12 | P a g eCasual/full jobseekers, by previous status Casual Full
Education and training 2.1 11.3
Employment 36.3 42.4
Jobseekers Allowance 36.4 18.6
Jobseekers Benefit 17.4 8.5
No previous jobseeker claim 3.8 11.3
One parent Family Payment 1.5 2.6
Other 2.5 5.3
Total 100 100
Table 8. Previous status, by casual/full status (N=284,411)
Table 9 compares full and casual claims by the highest level of education the person has
completed, where available. It is worth qualifying this table by highlighting the large
proportion of missing values, and by noting that education data are self-reported and
have not been otherwise verified. Casual workers have slightly higher frequencies of
Leaving Certificate and third level education, and correspondingly lower frequencies for
primary and Junior Certificate.
Casual/full jobseekers, by education level Casual Full claim
Primary or less 3.9 6.6
Junior Certificate 10.7 12.7
Leaving Certificate 17.8 16.4
Third-Level 17.8 15.6
Unknown 49.9 48.8
Total 100 100
Table 9. Reported education level (N=284,411)
Duration of claim is another important indicator of the likelihood of exiting an open
jobseeker claim. There is a well-established association between longer durations of
unemployment and greater difficulty in returning to employment. Table 10 shows the
mean duration of the current episode – full jobseekers and those on casual claims, with
a longer average duration for the former. However, median values indicate that long
duration claims seem to be increasing the mean value.
This duration variable counts the number of days from the start of the episode to 31
December 2015. It links claims in a way that more meaningfully represents durations of
unemployment than separately counting two episodes of unemployment. For example,
contiguous episodes of the insurance-based Jobseekers Benefit and contingency-based
Jobseekers Allowance will be linked and the total includes the count of days from the
13 | P a g ebeginning of the period of unemployment (which is likely to begin with the Jobseekers
Benefit claim). This count of days includes the period of unemployment and, where
applicable, the period of casual claim and part-time employment.
Casual/full jobseekers average duration Casual Full claim
Mean 934 964
Median 573 423
Table 10. Duration in days of current claim (N=284,411)
Of those whose status was casual on 31 December 2015, some began that episode as
casual claimants while others began as full jobseekers and then transitioned to casual
claims after finding part-time work. For further analysis, we can consider the duration of
the casual population by comparing those who begin with a casual claim to those who
had full jobseeker claims and subsequently became casual claimants.
Table 11 shows that beneath the average value there are two distinct types of casual
claims. Durations are much longer for subsequent casuals – in other words, those who
had full claims preceding their casual claim tend to spend longer on a casual claim. This
is partly explained by the fact that some of those who start as casual claimants are
transferring to part-time employment from full-time employment whereas subsequent
casuals are more likely to be coming from full unemployment to part-time employment.
Nevertheless, the variation between initial and subsequent casual status is noteworthy. xii
Average duration of claim,
by initial or subsequent casual episode Full claims Start as casual Subsequent casual
Mean 964 703 1,211
Median 423 363 902
Table 11. Average duration in days, by full claim and initial or subsequent casual episode (N=284,411)
For casual workers, we can examine how long they have been combining part-time work
with receipt of a social welfare payment by examining only the duration of the casual
part of the episode of (partial) unemployment.
Casual jobseekers average duration,
by sequence Full claim Start as casual Subsequent casual
Mean NA 628 586
Median NA 332 330
Table 12.Casual jobseekers average duration by sequence (N=284,411)
Finally, duration is also correlated with the previous status of the claimant. Table 13
shows the shortest median duration relates to those who had made no previous claim,
with the next lowest durations those whose claim was preceded by an episode of
employment and education and training.
14 | P a g eCasual/full jobseekers median duration in days,
by previous status Casual Full claim
Median Education 577 451
Employment 532 303
Jobseekers 784 577
No previous claim 316 206
OFP 786 962
Other 584 554
Table 13 Median duration of claim, by previous status (N=284,411)
15 | P a g eLabour market outcomes
Following the point-in-time analysis of the cohort of all jobseeker claims at 31 December
2015, labour market outcomes for the same cohort are examined exactly one year later,
31 December 2016. As with the analysis based on 2015, the labour market outcome
examines status at a point in time and does not track transitions in the interim.
Table 14 shows the divergent outcomes of the casual workers compared to full jobseeker
claims. Before introducing the results, a brief explanation of the outcome categories may
be useful.
‘Closed off the Live Register for other reasons’ covers those who have moved onto other
Department of Employment Affairs and Social Protection payments that are not counted
on the Live Register (such as Community Employment and the One-parent Family
Payment), those who are no longer entitled to a claim, those who have emigrated, and
those who have become inactive.
The category of ‘Employment/Self-employment supported by DEASP’ reflects progression
to programmes that support nascent enterprises, such as the Back to Work Enterprise
Allowance, or to employment that entitles the employee to Family Income Supplement,
an in-work benefit dependent on hours worked, earnings and family circumstances.
‘In Education, Training or Employment Placement Course’ covers SOLAS training, and
programmes such as the Back to Education Allowance, Momentum and JobBridge. ‘In
employment’ refers to unsupported employment.
The fact that casual jobseekers are less likely to have progressed to the category of
‘Employment/Self-employment supported by DEASP’ or to the category of ‘In Education,
Training or Employment Placement Course’ may reflect the lower level of activation for
casual jobseekers in 2015. It may also be that further training and education is not a
priority for those already engaged in part-time employment. While the numbers are low
for both full and casual claims, a future examination of this transition may reflect the
increasing level of engagement now underway.
The most significant progress for any episode of unemployment is the progression to ‘In
employment’ i.e. unsupported employment. Some 25% of those on casual claims had
progressed to unsupported employment one year after 31 December 2015, compared to
19% of those on full claims. This higher frequency of progression to unsupported
employment for casual claims supports the idea of the casual status on 31 December
2015 acting as a stepping stone to full-time employment.
A less positive finding is that a considerable share of the casual cohort has not
progressed to full-time employment and remains in the same status one year later
(56%). In other words, they have not increased their hours to the extent that they work
more than three days out of seven. In light of the employment growth at this time, an
increase in hours to moving to full-time employment seems a reasonable objective.
The other significant movement is among people whose partial connection to the labour
market has receded and they are now making a full jobseeker claim. Approximately 7%
of those on a casual jobseeker claim at the end of 2015 were on full jobseeker claims the
following year.
16 | P a g eThe share of casual claimants who are signing on for credited contributions – those who
are not working but not making a jobseeker claim – is slightly above zero.
In summary, a considerable share of casual claims progress to employment (25%) and
the largest share are no worse off one year later (56%). Only 7% of casual claims have
lost their connection to the labour market by moving to full claims.
Casual/full jobseekers, outcome 12 months later Casual Full claim
Closed off the Live Register for other reasons 8.8 16.3
Employment/Self-employment supported by DEASP 1.6 3.0
In Education, Training or Employment Placement Course 1.3 5.3
In employment 24.9 19.0
On Live Register (casual worker) 56.0 4.1
On Live Register (excluding casual workers) 7.2 51.2
On Live Register - Credits only 0.2 1.1
Total 100 100
Table 14. Labour market outcome 12 months later, by full/casual claim (N=284,411)
A further breakdown
shows that those who
began their episode
as casuals do better
than those who switch
to casual status after
the claim has
commenced (Table 15
and Figure 7). This
corresponds to
expectation, as it
reflects a connection
to the labour market
at an earlier point,
leading to an earlier
exit to full-time
employment. It also
corresponds to the
earlier finding of
shorter durations for
Figure 7.Labour market outcomes by full or casual claims and sequence(N=284,411). those who start an
Diagram created using SankeyMATIC
episode as a casual
claimant. Those who
17 | P a g ebegin as casual claimants are also less likely to transfer to full claims (only 6%,
compared to 9% for subsequent casuals).
Casual/full jobseekers, outcome 12 months Start as Subsequent Full Total
later Casual casual claim number
Closed off the Live Register for other 10.1 7.3 16.3 41,896
reasons
Employment/Self-employment supported 1.2 2.1 3.0 7,656
by DEASP
In Education, Training or Employment 1.3 1.4 5.3 12,683
Placement Course
In employment 25.7 24.0 19.0 57,566
On Live Register (casual worker) 55.9 56.0 4.1 42,767
On Live Register (excluding casual workers) 5.7 9.0 51.2 119,176
On Live Register - Credits only 0.2 0.2 1.1 2,658
Percent total 100 100 100 --
Number of observations, total 32,768 27,379 224,255 284,402
Table 15.Outcome 12 months later by initial or subsequent casual claim (N=284,411)
The sector of the casual claimants who subsequently went onto full-time employment
were broadly similar to the distribution of casual claimants overall (see Table 17 in the
appendix).
Longer run trends
To set this in context, and to account for the possibility of some unusual dynamic
between full and casual claims at year-end, the labour market outcomes analysis was
repeated over the following dates (113 days apart):
Casual/full claim open on: Labour market status check on:
31Dec2015 31Dec2016
14Jun2014 14Jun2015
26Nov2012 26Nov2013
11May2011 11May2012
23Oct2009 23Oct2010
This repeats the steps taken above as at 31 December 2015 (eg removal of those
signing for credits and those on activation and training) and assesses labour market
outcomes for the casual/full population 12 months after these dates. The x-axis reflects
the time the snapshot is taken and the markers identify the exact point at which the
claim was open (e.g casual or full on 26 November 2012). The y-axis identifies the
percentage that had, 12 months later, progressed to employment.
18 | P a g eThis longer view sets in context the results for 31 December 2015. While casual claims
open on 31 December 2015 did better than full claims when measured one year later,
the gap is narrower than it has been since 2009.
Full claims in Casual Casual
employment 12 claims in and
months later employment SSTW as
12 months share of
later LR
23Oct2009 17.5 30.7 20.96%
11May2011 17.9 28.9 21.89%
26Nov2012 16.7 31 22.38%
14Jun2014 18.3 29.9 19.65%
31Dec2015 19 24.9 20.72%
Table 16. Transitions to employment 12 months later (Source: DEASP administrative data)
Figure 8. Labour market outcomes one year later, for casual/full claims at five points, 2009-2015
Policy implications
In interpreting these findings, it should be noted that this descriptive analysis examines
characteristics individually and does not control for all other characteristics or attempt to
isolate causal effects. Indeed, it is likely that some characteristics of casual jobseekers
are correlated with labour market outcomes.
Furthermore, this analysis reflects interaction between various income support schemes
with differing eligibility criteria. For example, the differences in family structure evident
19 | P a g ebetween those on casual and full claims may reflect transitions to the Family Income
Supplement. At certain earnings levels, those who have some work and child and adult
dependents may be better off moving from a casual claim to the Family Income
Supplement once they can attain the threshold of 19 hours of work per week. This
scheme is not affected by the three days eligibility criterion outlined above.
Previous empirical research in Ireland suggests the casual cohort fares worse than those
on full jobseeker claims. A 2009 ESRI publication on the probability of exit from Live
Register claims finds that, when controlling for other factors, casual claimants are 9%
more likely to remain welfare dependant for 12 months or more.xiii In light of the positive
employment outcomes outlined in this paper, and given the increase in the share of
casual workers since 2009, further analysis may be worthwhile to examine whether this
has changed in the interim.
As activation for casual claimants has only recently commenced, it would be useful to
repeat this analysis to see the impact on labour market outcomes. Of particular interest
is the proportion of casual claims where employment has not progressed to more than
three days per week at a time of increasing employment opportunities. The greater
probability of casual claimants being in employment 12 months later – compared to full
claimants – appears to be narrowing over time (see Figure 8), even as employment
prospects are improving. This trend is worth monitoring given that, as a proportion of all
claimants, the number of casual claimants is now higher than in the pre-crisis period.
Examining the characteristics and labour market outcomes of casual claimants can
inform the interaction between DEASP and its clients, particularly in respect of the
frequency and nature of activation. In respect of those with casual claims, it is worth
noting:
Greater numbers from EU15-28 countries
Higher ratios of casual:full in the south-east, and certain western counties
Higher rate of exits to employment for casual claimants (compared to full claims)
Higher reported levels of education, therefore less likely to require referral to
education and training
Greater presence in the following sectors:
o Wholesale and retail trade
o Accommodation and food service activities
No particular sector is associated with higher transitions from casual claim to full-
time employment
Shorter claim durations in the case of those who start as casuals, compared to
subsequent casuals or full claims
A lower incidence of reversion to full claims of those who start as casuals.
Wider labour market factors and further work
The analysis presented here points to broadly positive labour market outcomes
associated with supported part-time work. In interpreting this, it is worth situating the
analysis within the wider labour market context.
First, welfare support for part-time work allows for some flexibility in employers’
responses to an economic shock such as that of 2009. If employers had not been able to
reduce hours (either though SSTW or casual claims) in response to dampened demand
20 | P a g efor goods and services during that period, the unemployment rate and the number of full
claims on the Live Register would have been greater. The direct negative consequences
include decreased output and revenue and increased Government expenditure.
Second, at the level of the individual, the evidence suggests part-time work is useful as
a stepping stone towards full-time employment. Part-time work (as an alternative to
becoming wholly unemployed) maintains jobseekers’ skills and sectoral experience,
expands their network of contacts and preserves or enhances the soft skills required in
the workplace.
For people who are already unemployed, in the absence of part-time income support, it
is reasonable to assume that at least some offers of part-time work would be refused,
given that acceptance would lead to an overall income loss. By combining earnings with
the part-time income support of a casual claim, any offer of part-time work can be
accepted (within the limits of the days-based system). In this way, the provision of part-
time income support eases the transition from unemployment to part-time employment,
and potentially onwards to full-time positions.
However, there are potential downsides to subsidising part-time work, and these can be
identified at the macro and micro level. First, it may be difficult to identify the point at
which facilitating firms retaining staff to see out a recession becomes a long-term
support for inefficient firms. Accordingly, saving existing jobs in the short-term may be
mitigated by a wider economic downside as it hinders the reallocation of labour from less
productive firms to more productive firms.
Second, the provision of part-time income support could inadvertently prolong the
existence of low hours jobs.xiv To respond to unpredictable and irregular demand,
employers may value variance in employees’ hours of work and a larger pool of
employees, at least some of whom work at less than full-time. The existence of casual
jobseeker claims may mean that part of the cost of maintaining a larger pool of
employees is shifting to the State.
In this respect, the days-based eligibility for jobseekers payments has an impact on
work patterns and how hours of work can be distributed across days. Any offer of work
will be assessed by potential employees against the loss of a casual jobseeker payment
in respect of those days. While the days-based system has been subject to criticism, it is
likely that it acts as a bulwark against low hours spread across the maximum number of
days (in a way that an hours-based system would not).xv This consequence of the days-
based system should be factored into any future consideration of changes.
Finally, it can be argued that part-time income support moderates one of the employer’s
incentives to convert part-time to full-time positions (eg the risk that the employee will
leave for full-time work elsewhere).xvi However, this should be mitigated by the
requirement on the jobseeker to seek full-time work as a condition of a jobseeker
payment, and by the recent commencement of activation for the casual cohort.
Ultimately, the complex weighting of the positive and negative aspects of part-time
income support should be underpinned by ongoing analysis of the labour market
outcomes of casual claimants. Further analysis would be useful to broaden the discussion
to other forms of subsidised employment.
21 | P a g eAppendix
Casual/full jobseekers, by county Casual Full claim
Carlow 2.0 1.7
Cavan 1.8 1.8
Clare 2.3 2.4
Cork 9.4 8.8
Donegal 7.1 4.5
Dublin 17.9 25.5
Galway 5.0 5.1
Kerry 6.1 3.5
Kildare 4.1 4.2
Kilkenny 2.0 1.6
Laois 2.1 2.1
Leitrim 0.9 0.8
Limerick 3.9 4.3
Longford 1.0 1.3
Louth 4.1 4.2
Mayo 3.4 2.8
Meath 2.1 2.4
Monaghan 1.8 1.3
Offaly 2.1 2.3
Roscommon 0.9 1.0
Sligo 1.4 1.3
Tipperary 4.3 4.0
Waterford 3.9 3.0
Westmeath 2.4 2.6
Wexford 5.1 4.4
Wicklow 2.7 3.0
Total 100.0 100.0
Table 17. Casual/full jobseekers, by county (N= 284,411)
22 | P a g eProportion in employment in each sector for all Total Casual Full claims Casual
employees, casual claims and full claims employment claims claims in
full
employment
12 months
later
Agriculture, forestry and fishing (A) 5 2 1 2
Industry (B to E) 13 7 5 8
Construction (F) 7 9 4 8
Wholesale and retail trade, repair of motor vehicles 14 20 8 19
and motorcycles (G)
Transportation and storage (H) 5 4 2 4
Accommodation and food service activities (I) 7 17 5 15
Information and communication (J) 4 1 2 1
Financial, insurance and real estate activities (K,L) 5 2 3 2
Professional, scientific and technical activities (M) 6 3 2 3
Administrative and support service activities (N) 3 8 6 9
Public administration and defence, compulsory 5 2 3 2
social security (O)
Education (P) 8 4 3 3
Human health and social work activities (Q) 13 7 5 6
Other NACE activities (R to U) 5 9 5 8
Not stated or unknown - 5 50 12
All NACE economic sectors 100 100 100 100
Table 18.Sector for all employees, casual claims and full claims; Source: QNHS and DEASP administrative data
(N=2,044,600 for all employees; N= 284,411 for claims)
Chi-sq table:
Table of cas_or_ful by detailed_outcome_12m
cas_or_ful detailed_outcome_12m
Frequency Closed
Percent off the In On Live On Live
Row Pct Live Education, In Register Register
Col Pct Register Employment/Self-employment Training or employmen (casual (excluding On Live Register -
fo supp Emplo t worker cas Credits only Total
23 | P a g eTable of cas_or_ful by detailed_outcome_12m
cas_or_ful detailed_outcome_12m
Frequency Closed
Percent off the In On Live On Live
Row Pct Live Education, In Register Register
Col Pct Register Employment/Self-employment Training or employmen (casual (excluding On Live Register -
fo supp Emplo t worker cas Credits only Total
Casual 5317 960 797 14991 33658 4322 111 60156
1.87 0.34 0.28 5.27 11.83 1.52 0.04 21.15
8.84 1.60 1.32 24.92 55.95 7.18 0.18
12.69 12.54 6.28 26.04 78.69 3.63 4.18
Full 36580 6696 11886 42576 9116 114854 2547 22425
12.86 2.35 4.18 14.97 3.21 40.38 0.90 5
16.31 2.99 5.30 18.99 4.07 51.22 1.14 78.85
87.31 87.46 93.72 73.96 21.31 96.37 95.82
Total 41897 7656 12683 57567 42774 119176 2658 28441
14.73 2.69 4.46 20.24 15.04 41.90 0.93 1
100.00
D
Statistic F Value Prob
Chi-Square 6 111957x
If no value is available for the last full year, the value for the preceding year applies; where at least two years
of the past four years have the same value, that value is preferred to a more recent (single) value.
xi
The ‘other’ category here includes Community Employment, JobBridge, SSTW, and the pre-retirement
allowance.
xii
Initial and subsequent refer only to the episode open at 31 December 2015 – it does not account for
whether the claimant had previous experience as a casual claimant.
xiii
See O’Connell et al (2009); National Profiling of the Unemployed in Ireland; ESRI.
xiv
For a discussion on prevalence, see https://dbei.gov.ie/en/Publications/Publication-files/Study-on-the-
Prevalence-of-Zero-Hours-Contracts.pdf
xv
See ‘A review of the status of casual workers in Ireland’, published by the Oireachtas Joint Committee on
Jobs, Social Protection and Education in May 2012.
xvi
Cahuc and Nevoux are critical of the expansion of short-time work in Franc in 2008-09, finding large firms to
be recurrent users of short-time work (http://ftp.iza.org/dp11010.pdf)
25 | P a g eYou can also read


