State of Curbside Recycling Report 2020 - The Recycling ...
←
→
Page content transcription
If your browser does not render page correctly, please read the page content below
2020
State of Curbside
Recycling Report

i THE RECYCLING PARTNERSHIP | 2020 STATE OF CURBSIDE RECYCLING REPORT
Lead Author: Acknowledgements
Scott Mouw
The Recycling Partnership would like to thank the hundreds of
municipal and county recycling programs for the data they
Lead Researchers: provided for this report through The Recycling Partnership’s
Scott Mouw, Lily Schwartz, 2019 State of Curbside Survey, the Municipal Measurement
and Sherry Yarkosky Program, and The Recycling Partnership’s West Coast
Contamination Initiative research. The dedicated work of
local government staff remains the foundation of the U.S.
Contributing Researchers and Authors: curbside recycling system.
Elizabeth Biser, Ali Blandina, Joe Bontempo,
Anthony Brickner, Jackie Caserta, Sarah Dearman, The Recycling Partnership would also like to thank the
Dylan de Thomas, Allison Francis, Keefe Harrison, State recycling programs, State Recycling Organizations,
Samantha Kappalman, Cody Marshall, Asami Tanimoto, the Northeast Recycling Council, the Southeast Recycling
Rob Taylor, Laura Thompson, and Aditi Varma Development Council, and Resource Recycling magazine for
their help in distributing the 2019 State of Curbside Survey and
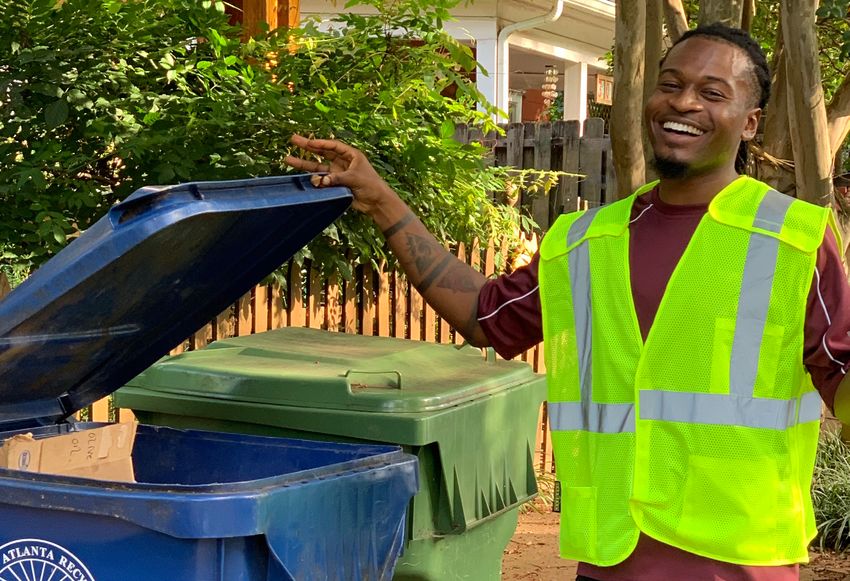
Cover photo: Morriss Ellison from Leadpoint Business Services
leads our feet on the street program in Atlanta and Auburn for additional information used to complete this 2020 State of
to help residents know more about what we they Curbside Report.
can and can’t recycle.
Release date: February 13th, 2020
© The Recycling Partnership 2020
THE RECYCLING PARTNERSHIP | 2020 STATE OF CURBSIDE RECYCLING REPORT   ii

Table of Contents

Executive Summary

Introduction

Chapter 1.  .  .  .  .  .  .  .  .  .  .  .  .  .  .  .  .  .  .  .  .  .  .  .  .  .  . 1
The Basic Dimensions of the
U.S. Curbside Recycling System

Chapter 2.  .  .  .  .  .  .  .  .  .  .  .  .  .  .  .  .  .  .  .  .  .  .  .  .  . 15
Local Curbside Program Performance

Chapter 3.  .  .  .  .  .  .  .  .  .  .  .  .  .  .  .  .  .  .  .  .  .  .  .  .  . 29
How Changing Material Values are
Affecting Local Curbside Programs

Chapter 4.  .  .  .  .  .  .  .  .  .  .  .  .  .  .  .  .  .  .  .  .  .  .  .  .  . 37
How Community Programs Are
Reacting to New Challenges

Chapter 5.  .  .  .  .  .  .  .  .  .  .  .  .  .  .  .  .  .  .  .  .  .  .  .  .  . 43
Helping the U.S. Curbside Recycling
System Thrive – Mapping the Path Forward

Conclusions. .  .  .  .  .  .  .  .  .  .  .  .  .  .  .  .  .  .  .  .  .  .  . 57

Glossary .  .  .  .  .  .  .  .  .  .  .  .  .  .  .  .  .  .  .  .  .  .  .  .  .  .  . 59

Appendices.  .  .  .  .  .  .  .  .  .  .  .  .  .  .  .  .  .  .  .  .  .  .  . 61
iii    THE RECYCLING PARTNERSHIP | 2020 STATE OF CURBSIDE RECYCLING REPORT

Executive Summary
This Recycling Partnership report is an analysis of the            However, the enduring value that citizens place on curbside
dimensions, performance, stresses, and opportunities for           recycling is helping the vast majority of community programs
improvement to curbside recycling in the United States. The        sustain their services. In addition, as first documented in The
purpose of curbside recycling is to efficiently collect and        Recycling Partnership’s 2016 State of Curbside Report, data
deliver high quality materials from U.S. households to the         presented in this study again underscores rich opportunities to
circular economy – a “reverse distribution” system to gather       improve the efficiency of those services. Tremendous progress
back millions of tons of paper and packaging dispersed to          can be made by converting bin- or bag-based collection to
millions of households for the manufacturing of new products.      cart-based collection and by converting subscription and
                                                                   opt in programs (when citizens need to choose and pay
Like other large scale “systems” in the U.S., such as              for curbside recycling service) to automatically provided
transportation, healthcare, or electricity generation, curbside    universal service. Emerging markets, industry investments,
recycling encompasses many different stakeholders,                 and technological advancements also point to a future of
approaches, and issues. In fact, it can be hard to see it          expanded material collection.
as a “system” at all because of so much variation across
the country. But to help curbside
recycling in the U.S. take the next                                Currently, the U.S. curbside recycling system
steps in its singular purpose of                         32%       is successfully capturing an estimated
capturing an estimated 37.4 million                                11.9 million tons, or only about 32 percent
tons of commodities to feed a circular                             of those 37.4 million tons.
economy, it must be viewed as a
system in which the application of
common, broad interventions can                                    Improved curbside recycling programs in the U.S. will
help it achieve its full potential.                                deliver more quality recyclable commodities to the circular
                                                                   economy, but they must also address the unwanted
Currently, the U.S. curbside recycling system is successfully      materials in curbside containers. This study documents a
capturing an estimated 11.9 million tons, or only about            first-of-its-kind national average inbound contamination rate
32 percent of that 37.4 million tons. To create a higher-          estimate of 17 percent by weight. The Recycling Partnership
functioning system, three essential elements – curbside            calls on all U.S. curbside recycling service stakeholders to
access, participation, and participant capture behavior            be precise and consistent in adopting the term inbound
– must receive focused attention. The good news is those           contamination to measure and specifically differentiate
elements can be addressed through smart applications of            contaminants in collected material from residues in material
funding, best management practices, and the broadest               recovery facilities (MRFs). By focusing on inbound materials,
possible stakeholder involvement.                                  communities can make major strides in addressing the
                                                                   contamination issue using proven best management
System interventions are critical now as curbside recycling        practices discussed in this report.
faces the most stressful time in its 30-year history. Dramatic
declines in the monetary value of key materials due to             The ability of curbside recycling in the U.S. to deliver
dramatic shifts in the global marketplace have imposed             substantial benefits to the economy and environment will
higher costs on the local curbside programs that act as            require all stakeholders to do something different than
the frontline for material recovery in the U.S. This study finds   they are today. Local governments, brand companies,
that local programs now pay an average processing fee to           commodity industries, states, the federal government, and
material recovery facilities (MRFs) of $64 per ton, with some      citizens themselves all own a role in transforming the U.S.
programs absorbing fees exceeding $100 per ton.                    curbside recycling system to its next iteration – Recycling
                                                                   2.0. The “return on investment” may in some cases not be
The economic impact of these processing charges has                immediate, but the stakes are too high to ignore, especially
led a limited number of communities to eliminate curbside          as the U.S. seeks to do its part on the global issues of climate
programs (54 programs in the U.S.), while others have              change, pollution, and the impacts of virgin material
reduced their material collection lists or raised recycling        extraction. This report attempts to provide a sober assessment
fees. With little relief in sight, economic pressures on local     of where we currently stand, but also what we might achieve
programs will continue to be a major issue in maintaining and      together through a concerted and dedicated effort.
expanding curbside recycling service in the U.S.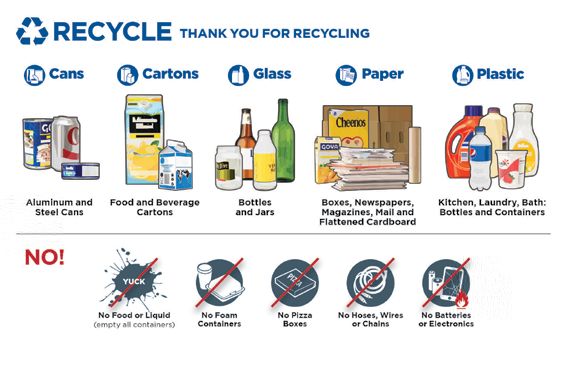
THE RECYCLING PARTNERSHIP | 2020 STATE OF CURBSIDE RECYCLING REPORT   iv

            Top 5 Perspectives
        on U.S. Curbside Recycling

1
    More than 20 million tons of curbside recyclable materials are disposed annually. Curbside recycling
    in the U.S. currently recovers only 32% of available recyclables in single-family homes, leaving
    enormous and immediate opportunity for growth to support the economy, address climate change,
    and keep recyclable commodities out of landfills.

2
    Only half of Americans have automatic access to curbside recycling, some who have access do not
    participate, and not all who participate do so fully. True access must be increased and the public can
    and should be engaged in improving participation and recycling behavior. All of these challenges
    can be successfully addressed through best management practices listed in this report.

3
    Many communities are increasingly paying more to send materials to a MRF than the landfill and
    many programs lack critical operating funds. Helping community recycling programs improve
    will require addressing challenging market conditions, providing substantial funding support, and
    addressing inexpensive landfill tipping fees that make disposal options significantly cheaper than
    recycling.

4   Investing to clean up the stream benefits all sectors of the system. Contamination remains a critical
    issue, but it can be substantially reduced through the implementation of proven techniques across
    the country.

5
    The ultimate fate of recyclable materials rests in the hands of a broad set of stakeholders who must
    all do something new and different to support a transition to a circular economy. Strong, coordinated
    action is needed in areas ranging from package design, capital investments, scaled adoption of best
    management practices, policy interventions, and consumer engagement.
v        THE RECYCLING PARTNERSHIP | 2020 STATE OF CURBSIDE RECYCLING REPORT

Introduction
The modern U.S. curbside recycling system is now more                        Currently, the U.S. curbside recycling system is probably,
than 30 years old. It has been a vital and consistent source                 at best, only delivering about one third of these benefits.
of commodity feedstocks to manufacturers worldwide and                       No one knows precisely how much because of a lack of
it offers millions of Americans the opportunity to actively                  comprehensive or consistent data at the local, state, or
participate in protecting the environment and mitigating                     federal levels. As displayed in this report, The Recycling
climate change.                                                              Partnership continues to dedicate substantial efforts
                                                                             with many stakeholders to build a better, data-based
The collection of curbside recyclables from millions of                      understanding of the U.S. curbside recycling system so
individual homes across America starts a chain of job                        that efforts to improve the system can be successfully
creation and material utilization that enormously benefits                   benchmarked and measured.
the U.S. economy. Using the U.S. EPA WARM model, if all of
the approximately 37.4 million tons of recyclable materials                  The U.S. curbside recycling system is further hampered
generated in single-family households in the U.S. were                       by disaggregated decision-making and general
collected curbside and delivered back to economic use, it                    underperformance. Curbside programs across the
would generate 370,000 full-time equivalent (FTE) jobs.                      country are facing significant challenges, including shifting
                                                                             commodity economics, stresses on taxpayer funded
These benefits are amplified by recycling’s power in helping                 collection services, concerns about material quality, and
to mitigate climate change. The U.N.’s Emissions Gap                         a general inelasticity of collected supply to market forces.
Report 2019 underscores the need for urgency on all fronts                   Further, the simple fact is that there is not equal access to
in addressing the climate crisis.1 Curbside recycling has its                recycling as there is to trash for many residents across the
role to play. Again, using the WARM model, if all of the 37.4                country and that an estimated $9.8 billion in investment is
million tons of single-family recyclables were put back to                   needed to create a truly robust system.
productive use instead of lost to disposal, it would reduce U.S.
greenhouse gas emissions by 96 million metric tons of carbon                 Still, in many ways, the system is also resilient and well-
dioxide equivalent, conserve an annual energy equivalent of                  poised to improve. Communities across the country remain
154 million barrels of oil, and achieve the equivalent of taking             committed to providing curbside services, just as Americans
more than 20 million cars off U.S. highways.                                 also continue to value and demand recycling as an essential
                                                                             public service.2 The good news is that the application of
                                                                             adequate resources and smart interventions can easily
Using the WARM model, if all of the 37.4 million tons of                     improve the performance of those services.3 The Recycling
single-family recyclables were put back to productive use                    Partnership’s Bridge to Circularity report detailed steps
instead of lost to disposal, it would reduce U.S. greenhouse                 to close the gap between future increased demand for
gas emissions by 96 million metric tons of carbon dioxide                    recyclables as manufacturing feedstock and current supply,
equivalent, conserve an annual energy equivalent of 154                      not just for plastics but for all materials. This report reinforces
million barrels of oil, and achieve the equivalent of taking                 that call to action, providing a snapshot of the challenges
more than 20 million cars off U.S. highways.                                 facing the U.S. curbside recycling system and recommending
                                                                             a set of integrated strategies to help it achieve its full
                                                                             potential.

    1 https://www.unenvironment.org/resources/emissions-gap-report-2019
    2 https://recyclingpartnership.org/download/30257/
    3 https://recyclingpartnership.org/partnership-empowers-atlanta-chicago-and-denver-to-measurably-improve-recycling/
THE RECYCLING PARTNERSHIP | 2020 STATE OF CURBSIDE RECYCLING REPORT vi
If all of the 37.4 million tons of single-family
recyclables were put back to productive use
instead of lost to disposal, what would that do?
Reduce U .S . Conserve an annual
greenhouse gas energy equivalent of
emissions by
154 million
barrels of oil
metric tons of carbon
dioxide equivalent
full-time equivalent
(FTE) jobs
Using the WARM model, if all of the 37.4 million tons of single-family recyclables were put back to
productive use instead of lost to disposal, it would reduce U.S. greenhouse gas emissions by 96 million
metric tons of carbon dioxide equivalent, conserve an annual energy equivalent of 154 million barrels
of oil, and achieve the equivalent of taking more than 20 million cars off U.S. highways.8 THE RECYCLING PARTNERSHIP | 2020 STATE OF CURBSIDE RECYCLING REPORT Chapter
THE RECYCLING PARTNERSHIP | 2020 STATE OF CURBSIDE RECYCLING REPORT   9

      The Basic Dimensions
      of the U.S.Curbside
      Recycling System
3 THE RECYCLING PARTNERSHIP | 2020 STATE OF CURBSIDE RECYCLING REPORT
Curbside Material Generation
To understand how well the U.S. curbside recycling system is performing, it is important to benchmark the nature and amount
of material it is designed to recover. Curbside recycling programs are designed to capture recyclable commodities primarily
from single-family households.4 Through an analysis of waste composition, recycling, and capture study data from a size and
geographic range of municipalities, The Recycling Partnership estimates that the average single-family household generates
768 pounds of recyclable material per year.
Figure 1: Estimate of Annual Curbside Recyclable
Material Generation per Single-Family Household
4 “
Single-Family household” is a common parameter of service delivery in municipal recycling programs and is generally defined as occupied housing
with between 1 and 4 dwelling units. Using the U.S. Census American Fact Finder and this parameter, 2017 data finds 97,334,176 occupied single family
homes (including mobile homes). The number for multifamily occupied homes is 21,008,278.THE RECYCLING PARTNERSHIP | 2020 STATE OF CURBSIDE RECYCLING REPORT 4
With this number in hand, it is possible to extrapolate the total tonnage of recyclable material in all single-family households In
the U.S. using U.S. Census occupied housing data for single-family households.
Figure 2: Estimate of Annual Tonnage of Curbside Recyclable Material
Generation by U.S. Single-Family Households
Material Tonnage
Cardboard 5,195,756
Mixed Paper 14,722,469
Aseptics & Cartons 295,586
PET Bottles 2,478,193
Non-bottle PET 524,009
HDPE Natural Bottles & Jars 512,905
HDPE Colored Bottles & Jars 786,644
Glass Containers 7,613,441
Steel Cans 1,126,674
Aluminum Cans 1,002,515
Aluminum Foil & Trays 273,814
Other Plastic Packaging (~3-7) 1,670,402
Bulky Rigid Plastics 1,161,215
Total 37,363,622
Data on the generation of multifamily recyclables generation is scarce but an assumption can be made that multifamily
households generate 75 percent of a single-family household’s total. Using this assumption, Figure 3 shows the estimated
total of all residential recyclables in the U.S.
Figure 3: Estimate of Annual Tonnage of Residential Recyclable Material Generation
Multi-Family
Single-Family Generation (using
Material Total Residential
Generation 75% Single-Family
Generation Factor)
Cardboard 5,195,756 841,076 6,036,831
Mixed Paper 14,722,469 2,383,236 17,105,704
Aseptics & Cartons 295,586 47,849 343,434
PET Bottles 2,478,193 401,164 2,879,356
Non-bottle PET 524,009 84,825 608,835
HDPE Natural Bottles & Jars 512,905 83,028 595,933
HDPE Colored Bottles & Jars 786,644 127,340 913,984
Glass Containers 7,613,441 1,232,444 8,845,885
Steel Cans 1,126,674 182,383 1,309,058
Aluminum Cans 1,002,515 162,285 1,164,800
Aluminum Foil & Trays 273,814 44,324 318,138
Other Plastic Packaging (~#3-7) 1,670,402 270,400 1,940,803
Bulky Rigid Plastics 1,161,215 187,975 1,349,190
Total 37,363,623 6,048,328 43,411,9515 STATE
THE OF CURBSIDE
RECYCLING REPORT| 2020 STATE OF CURBSIDE RECYCLING REPORT
PARTNERSHIP
A Closer Look at Polypropylene
Figures 1, 2, and 3 do not break out polypropylene
(PP) as a separate resin. The material is used in an
array of food and non-food packaging and has
largely been collected in curbside programs and
sorted in MRFs under the broad category of “3-
7” resins. Most MRF specific resin sorting capacity
is focused on PET and HDPE which are presumed
to be available in higher quantities than PP in the
household stream. However, some limited data from
capture studies suggest there may be as much as 17
pounds of PP available per year from a single-family
household. This would place PP at higher generation
1.65 billion lbs rates than both natural and colored HDPE. Total
annual PP tonnage by U.S. single-family households
per year would be an estimated 827,000 tons or 1.65 billion
pounds.
A Closer Look at Film &
Flexible Packaging
The U.S. recycling system has been traditionally
focused on paper, bottles, cans, and other mostly
three dimensional and rigid packaging. However,
as more packaging formats shift to flexible plastics,
using low-density polyethylene (LDPE) as the primary
resin, this material stream may emerge as a target
of curbside recovery. The Recycling Partnership’s
capture data allows some estimation of the possible
supply stream for eventual film and flexible processors
and end markets. Average household generation
across the spectrum of film and flexible materials
appears to be about 75 pounds per household
7.3 billion lbs per year. Simple extrapolation shows a potential
nationwide single-family supply stream of 7.3 billion
per year pounds per year. 5
5 T he 2017 National Post-Consumer Plastic Bag & Film Recycling Report conducted by the consulting firm MORE Recycling on behalf of the American
Chemistry Council estimated that around 147 million pounds of post-consumer bags and wrap were collected for recycling that year, roughly 90
percent of which was collected through store drop-off and the rest through MRF sortation.THE RECYCLING PARTNERSHIP | 2020 STATE OF CURBSIDE RECYCLING REPORT 6
Overall Material Value
The purpose of curbside collection programs is to capture these commodity materials from disposal and supply them for the
manufacturing of new products. As commodities, curbside recyclables begin to have market value when MRFs distribute them
into a marketplace of material utilization. With the overall generation estimate in Figure 2, it is possible to project a total market
value for all single-family curbside materials using available market indices. Figure 4 shows the total approximate market value
of all generated curbside (single-family generated) materials sorted and ready to sell from the MRF.
Figure 4: Estimated Annual Market Value of All Single-Family
Recyclable Materials as of November 2019
Annual Tons
Available from Material Price Annual Market
Material
all Single-Family per Ton* Value
Households
Cardboard 5,195,756 $24.69 $128,283,216
Mixed Paper 14,722,469 -$1.88 -$27,678,242
Aseptics & Cartons 295,586 $22.50 $6,650,685
PET Bottles (including non-bottle PET) 3,002,202 $188.60 $566,215,297
HDPE Natural Bottles & Jars 512,905 $1,008.00 $517,418,564
HDPE Colored Bottles & Jars 786,644 $262.00 $206,572,714
Glass Containers 7,613,441 -$20.70 -$157,674,363
Steel Cans 1,126,674 $80.63 $90,848,151
Aluminum Cans (Including
1,276,329 $1,025.00 $1,308,237,225
Aluminum Foil & Trays)6
Other Plastic Packaging (~#3-7) 1,670,402 $5.00 $8,352,010
Bulky Rigid Plastics 1,161,215 $48.80 $56,667,292
Total 37,363,623 $2,703,892,549
*Source: National average index pricing from recyclingmarkets.net and annual value calculations projected from
November 2019 pricing
As Figure 4 shows, if every pound of curbside materials was collected and processed for market, it would yield a net revenue
stream of $2.7 billion to support, but, as discussed below, far from fully cover curbside material collection and processing.
6 T hough aluminum foil and trays are often sold to different end markets than standard aluminum cans (or UBCs), no separate pricing data was available
for foil and trays, so were combined for Figure 4.7 THE RECYCLING PARTNERSHIP | 2020 STATE OF CURBSIDE RECYCLING REPORT
Figure 5 shows how the combined value of this material has declined by 41 percent since early 2017, much of which is due to a
massive drop in fiber prices brought on by the collapse of mixed paper export markets and a related imbalance in cardboard
demand. Of the total decrease from a peak of $5.3 billion in March 2017 to $2.7 billion in November 2019, theoretical market
value of single-family household mixed paper and cardboard alone dropped $2.1 billion to $.1 billion, a decline of $2 billion. But
fiber is not the only material experiencing market challenges. As of November 2019, according to The Recycling Partnership’s
analysis of material prices, aluminum dropped 33 percent, steel cans 54 percent, colored HDPE 34 percent, and PET 45 percent
in theoretical total values from their highs within this two-year period.7
Figure 5: Total Market Value of all Single-Family Curbside Materials
6 bil .
5 bil .
Market Value
4 bil .
3 bil .
2 bil .
1 bil .
0
Jan ‘17 May ‘17 Sep ‘17 Jan ‘18 May ‘18 Sep ‘18 Jan ‘19 May ‘19 Sep ‘19
Month / Year
Source: National average index pricing from recyclingmarkets.net
The total market value of generated recyclable materials is just part of the overall dimensions of the U.S. curbside recycling
system. Figure 4 shows the market values as if all feasible materials were captured – a theoretical performance of 100 percent
system efficiency. However, not all curbside materials are captured for economic use. The majority is still disposed of because
of issues in recycling access, participation, and capture behavior, three overarching metrics that provide the basic strategic
parameters for improving curbside recycling performance.
7 T he Recycling Partnership analyzed historical material prices from recyclingmarkets.net against typical MRF-processed material ratios from January 2017
through November 2019. Individual material value high points within that time period were compared to November 2019 pricing to calculate percentage
changes noted in the paragraphTHE RECYCLING PARTNERSHIP | 2020 STATE OF CURBSIDE RECYCLING REPORT 8
Curbside Recycling Access
As mentioned earlier, an accurate estimation of U.S. curbside recycling system performance is challenged by a lack of robust
and comprehensive data, a serious issue that should be addressed. Seemingly basic statistics, such as the number of active
public curbside recycling programs in the U.S. or the number of households they serve, cannot be, at present, calculated on
an annual basis. However, the Sustainable Packaging Coalition’s (SPC) 2015-2016 Centralized Study on Availability of Recycling
remains a unique and reliable estimation of household recycling access.8 Its statistical findings can be used as a starting point
to assess the effectiveness of the curbside recycling system. Figure 6 displays SPC’s main access percentage table applied to
all U.S. 2017 occupied households. Note that in the SPC analysis, the rate of households choosing to use the offered subscription
service, or uptake, was assumed to be 30 percent.
Figure 6: Estimate of Number of Households with Various Kinds of Recycling Access
Curbside
Access Total
59%
The 59 percent of U.S. households with access to curbside recycling amounts to a total count of around 69.8 million homes.
Participation and capture estimates can be applied to this baseline to further explore the overall performance of the U.S.
curbside recycling system. As explained earlier, for purposes of the following analysis, the 69.8 million homes are assumed to be
single-family homes, defined as dwellings with one to four units. Although some curbside programs serve larger dwellings, one
to four is a common parameter in programs across the U.S. Dividing 69.8 million homes with curbside access by a total of 97.3
occupied single-family homes means that 72 percent of all single-family homes have access to curbside recycling services.
8 https://sustainablepackaging.org/findings-released-spc-centralized-study-availability-recycling/9 THE RECYCLING PARTNERSHIP | 2020 STATE OF CURBSIDE RECYCLING REPORT
Curbside Recycling Participation
If almost 70 million homes have access to curbside collection services, how many people consistently use the service? The
Recycling Partnership’s 2019 State of Curbside Survey gave respondents the opportunity to answer a set of optional questions,
including providing an estimate of their community’s curbside participation rate.9 Of the 262 respondents willing to answer
the optional questions, 112 (or about 43 percent) supplied a participation estimate. Across curbside programs of all types, the
average reported participation rate was 72 percent. Figure 7 applies this general percentage to the number of U.S. households
who have access to curbside to estimate the number of U.S. households regularly recycling curbside.
Figure 7: Estimate of Number of Households and Percentage of all
U.S. Households Participating in Curbside Recycling
Number of U.S. Curbside Estimated Number Percentage of U.S.
Households with Participation of U.S. Households Single-Family
Curbside Service Rate10 Participating in Households Participating
Curbside Service in Curbside Service
52%
69.8 million 72% 50.3 million 52%
The data in Figure 7 helps to build out an estimate of the U.S. curbside recycling system’s overall efficiency in capturing
available material in single-family homes. If only 52 percent of households act as regular participants in curbside provided
collection, theoretically only 52 percent of the available 37.4 million single-family tons could feasibly be collected; none of the
materials available from homes without access or from homes that don’t use available curbside services would be captured.
Applying this percentage to generated single-family recyclables means the maximum amount of material that could feasibly
be expected to be captured by the U.S. curbside recycling services – as they are organized today – would be 19.3 million tons
per year.
However, that estimate also assumes that all participating households are perfect recyclers, which data shows is not the case.
9 Methodology for this data can be found in the appendices of this report.
10 Participation is defined as a household which puts out cart at least once a month or over two-to-three collection cycles.THE RECYCLING PARTNERSHIP | 2020 STATE OF CURBSIDE RECYCLING REPORT 10
Curbside Material Capture
An essential performance indicator for curbside recycling programs is the capture rate – the percentage of available material
that is recovered at collection. Capture rates can be calculated across an entire community’s residential recyclables (Whole
City Capture) or can focus on participating households (Participant Capture).11 Research directed by The Recycling Partnership
paired with evaluation of additional studies documents capture rate patterns that paint a picture of opportunity to improve the
performance of the U.S. curbside recycling system.
Figure 8 presents the results of The Recycling Partnership’s analysis of capture rate studies and community data where
contemporaneous waste composition and recycling composition is available.12 This table shows the current estimates of whole
city capture rates, generally derived from studies examining samples from waste and recycling trucks where both participant
and non-participant data is represented (with all non-participant material found in the waste truck).
Figure 8: Data on Whole City Capture Rates by Material Weight*
* Averages calculated for materials only where they are included in the locally specified collection mix
Figure 8 shows that some of the most iconic and economically important materials in U.S. households, such as aluminum cans
and PET bottles, suffer from low capture rates in whole city analyses. This also holds true for participating households, as shown in
Figure 9, reflecting data from studies in which paired household garbage and recycling carts – or set-outs – are analyzed to see
how well participants do in recycling specific commodities.
11 P articipant capture data can deliver a reliable estimate of household material generation that can be converted into a Whole City Capture
calculation if a municipality knows its recycling participation rate.
12 The Recycling Partnership has conducted numerous capture rate studies in conjunction with specific projects and has gathered additional capture
data through reports provided by local governments and consulting firms.11 THE RECYCLING PARTNERSHIP | 2020 STATE OF CURBSIDE RECYCLING REPORT
Figure 9: Percentage of Participant Material Capture Rates by Weight*
* Averages calculated for materials only where they are included in the locally specified collection mix
As demonstrated in Figure 9, the lag in high-value material capture is one of the critical issues facing U.S. curbside recycling
services and calls for both a greater understanding of household behavior and the development of strategies that reliably
improve that behavior.
This data on the recycling behavior of participants provides the final piece of the puzzle to estimate the overall effectiveness
of the U.S. curbside recycling system. Across all participant capture studies available to The Recycling Partnership, the average
participant capture rate for all curbside materials is 61.5 percent. Figure 10 applies this overall participant capture rate to the
19.3 million tons available in participating curbside-served households.THE RECYCLING PARTNERSHIP | 2020 STATE OF CURBSIDE RECYCLING REPORT 12
Figure 10: Estimated Total Collected Tonnage of Single-Family Curbside Materials
Figure 10 shows that the U.S. curbside recycling system is currently only 32 percent efficient in its task of delivering single-family
household recyclable commodities to the circular economy. This level of achievement is a function of shortfalls in access,
participation, and capture, all of which can be addressed by smart and direct interventions. Using the same source of
November 2019 pricing in Figure 4, the market value of this estimated collected material is $861 million, which falls well short of
the current estimated cost of collecting that material.
Additional Material Capture Beyond Curbside Recovery
Current curbside recovery of only 32 percent of all single-family recyclables in the U.S.
is a sobering statistic, but it does not represent the total recovery of these materials.
Two major other mechanisms pull additional material away from disposal and back
into the circular economy: recycling drop-off programs and state container deposit
programs. Unfortunately, no comprehensive data exists to estimate the additional
recovery achieved through drop-off, but substantial parts of the U.S. depend on this
method of material capture – rural areas, in particular, but also some large American
cities. An assessment of how much overall single-family material that deposit programs
capture is also difficult because none of the programs analyze the specific source of
deposit-returned material (i.e., how much comes from single-family residential versus
commercial or multifamily sources).
However, it can be conjectured that drop-off approaches, with lower participation rates than curbside, and
deposit programs, with a recovery scope limited to varying ranges of PET, glass, and aluminum containers could
add as much as 8-10 percent additional single-family material capture. If so, then that means about 6 out of every
10 tons of single-family recyclable material is disposed of in U.S. landfills and waste incinerators. 13
13 A
dditional capture of single-family household recyclables occurs through mechanisms such as aluminum buy-back, steel can recovery from waste-to-
energy incinerator ash, but the impacts of those mechanisms cannot be measured by currently available public data.13 THE RECYCLING PARTNERSHIP | 2020 STATE OF CURBSIDE RECYCLING REPORT
Recyclable Recovery by Household
These 10 homes generate 7,680 lbs of recyclable
material per year.
3 of the 10 don’t participate in recycling at all.
They dispose of 2,150 lbs of recyclable materials each year.
Those that do participate still put some (38.5%) of their
materials in the trash, disposing of another 2,130 lbs.
Knowing what to throw into the recycling, would increase materials captured.
By implementing our strategies, together, we could collect another 2,130 lbs.
from these participating houses.THE RECYCLING PARTNERSHIP | 2020 STATE OF CURBSIDE RECYCLING REPORT 14
Understanding System Costs
How much does it cost to provide a household curbside recycling collection service per year? This can be a difficult question to
answer because of all the possible variables that go into the calculation, including daily operational costs, the cost of capital,
administrative costs, and MRF processing fees that are now commonplace. Still, where communities charge specific household
recycling fees that are intended to cover the full cost of service, it is possible to get a sense of curbside collection costs.
Thirty-two communities responding to The Recycling Partnership’s 2019 State of Curbside Survey reported charging specific
household recycling fees designed to cover the full cost of the collection service. Of those communities, 23 quoted specific fee
data, with an average monthly charge of $4.39 per month or $52.64 per year. Additional respondents reported charging fees
where the full cost of recycling is not covered. This data actually shows a higher fee rate of $6.05 per month, or $72.55 per year,
even after eliminating outliers to the data.
The 2019 State of Curbside Survey received data from an additional 18 communities with specific budgeted data for their
curbside program along with specific data on the numbers of households they serve. This data yields an average annual cost
of $54.70 per household, or $4.56 per month.
Beyond this survey data, anecdotal information provides further insight into the cost of delivering curbside service. Because a
subscription program must theoretically bear its own costs, subscription charges can be an indicator of service costs. Curbside
service subscribers in the city of Indianapolis pay a fee of $99 per year or $8.25 per month. However, curbside collection routes
in Indianapolis are likely very inefficient with many homes passed by to pick up from the few that subscribe (subscription uptake
in Indianapolis is estimated to be 10 percent). In another subscription community, Colorado Springs, the cost quoted on the
website of one major local hauler (which also operates the local MRF) to add curbside recycling to garbage service is $5.30 per
month.
Further, a benchmarking study of solid waste and recycling services in 14 North Carolina communities conducted from 2013
through 2017, found an average per capita cost of delivering recycling services “per collection point” to be $39.44, or $3.28 per
month.14 These numbers, applying full cost accounting methods, would likely be higher now due to the effects of inflation and
processing charges.
While it is difficult to draw strong conclusions about the cost of providing curbside service from this limited data, it can still be
used to estimate the total cost of U.S. curbside recycling collections for the current estimated 69.8 million households served.
Figure 11 shows those estimated costs for that service, roughly $4.2 to $5.9 billion annually, which is chiefly borne through local
taxation and accomplished through the exercise of local political will.
Figure 11: Scenarios of Estimated Total Annual Collection Cost for U.S. Curbside Recycling
Total Annual Cost
for All Curbside
Served U.S.
Households
$7 $84 $5,865,052,017
14 https://www.apexnc.org/DocumentCenter/View/9795/Benchmarking-Study?bidId=15 THE RECYCLING PARTNERSHIP | 2020 STATE OF CURBSIDE RECYCLING REPORT
THE RECYCLING PARTNERSHIP | 2020 STATE OF CURBSIDE RECYCLING REPORT               16

    Chapter 2:
    Local Curbside
    Program
    Performance
    Chapter 1 presented a high-level overview of the U.S. curbside
    recycling system, demonstrating the power of metrics like capture
    rates and broadly pointing toward opportunities for tactical
    action to bring nationwide improvement. However, such a
    general analysis can hide significant details and nuances in how
    material capture and local services can vary across communities.
    The truth is that curbside recycling across the U.S. is a spectrum of
    poor to excellent programs, all serving households that generate
    different amounts of materials.

    What do we know about community programs themselves
    and how they are performing? A key metric in making that
    assessment is pounds per household served. It is a simple and
    universally applicable yardstick that divides the annual tonnage
    collected curbside by the households eligible for curbside service.
    The Recycling Partnership’s 2016 State of Curbside Report focused
    attention on this essential benchmark, finding that, on average,
    curbside programs recover 357 pounds per household per year.

    Using data from The Recycling Partnership’s 2019 State of
    Curbside Survey, plus information gathered through the Municipal
    Measurement Program, and a research project by The Recycling
    Partnership on West Coast cities, this report provides an update
    of this essential performance metric.15 Across the available data
    from a broad size and geographic spectrum of communities,
    Figure 12 shows the pounds per household performance levels for
    the whole dataset. It further provides a breakdown of programs in
    which recycling containers are provided automatically to eligible
    households compared to programs in which households need to
    take proactive steps, or opt in, to receive the service.

     15 Information on data sources used for this report can be found in Appendix A
17 THE RECYCLING PARTNERSHIP | 2020 STATE OF CURBSIDE RECYCLING REPORT
Figure 12: Average and Median Pounds per Household per Surveyed Community Curbside Programs
Average Pounds Median Pounds Number of
per Household per Household Community
Collected on an Collected on an Data Points
Annual Basis Annual Basis
All Programs 440.16 430.38 436
Programs with Automatically
459.06 449.90 365
Provided Service
Programs Requiring Subscription
331.09 278.97 56
or Opt-In Option
Other Programs - Mix of
392.77 337.50 15
Automatic and Opt-In Options
The information in Figure 12 may overestimate the typical
Requiring households to opt-in is a detriment performance of opt-in programs. The available data
to material capture. The conversion of opt- included a few very high-performing programs that skews the
average higher and is reflected in the substantial difference
in programs in the U.S. to universal service
between the average and median data. Nevertheless,
would address this shortcoming. the Figure points out the clear performance advantages
of automatically providing service in a curbside program,
delivering across the average 128 more pounds of material
collection and across the median almost 170 pounds.
Exploring More Detail on Pounds
per Household Calculations
The data reported in Figure 12 stating 440 pounds collected per year differs from The Recycling Partnership’s 2016 State of
Curbside report findings that curbside programs collect 357 pounds per household per year. One explanation for the gap is
that the two studies looked at different categories of communities. The Recycling Partnership’s 2016 State of Curbside report
focused on 460 specific communities constituting 20 percent of the population in each state, while The Recycling Partnership’s
2019 State of Curbside Survey invited data from communities willing to respond to a voluntary survey. As noted elsewhere in this
report, the capability and willingness to respond to a survey may skew toward higher performing programs.
In addition, The Recycling Partnership’s 2019 State of Curbside survey contains data from a slightly higher representation of cart
programs and a lesser representation of opt-in programs; two factors that would make the 2019 estimate higher. On balance,
the 2019 data set also includes more West Coast communities; to test the effect of this, dropping all California, Oregon, and
Washington communities out of the calculations reduces the average pounds per household to 417 and the median to 405.
Finally, a different alternative statistical approach to the 2019 data also delivers a lower result. Instead of conducting the
average calculation across individual programs, a calculation dividing the total of reported households by the total reported
tons across the whole dataset produces a lower result of 413 pounds per household.THE RECYCLING PARTNERSHIP | 2020 STATE OF CURBSIDE RECYCLING REPORT 18
Curbside collection programs provide service through a a range of containers – e.g. bins for some households and
variety of different kinds of containers: bins, bags, carts, cans, carts for others, or a variety of cart sizes. For example, 242 out
and, in some programs, whatever containers a household of the 435 programs analyzed provide some combination of
wants to use, usually within certain size or appearance cart sizes for their households. For each of the specified types
parameters. Figure 13 shows the range of pounds per of programs represented below, data is presented for only
household by the types of containers used in various those programs that solely use that kind of container.
collection programs. A surprising number of programs offer
Figure 13: Pounds per Household Curbside Program Performance by Type of Container
Average Pounds Median Pounds Number of
per Household per Household Community
Collected on an Collected on an Data Points
Annual Basis Annual Basis
Bin 360.38 363.33 48
Bag 324.79 353.68 6
Cart 458.81 452.60 242
Programs Using a Combination
451.54 448.77 47
of Bins & Carts
Figure 13 further validates The Recycling Partnership’s
The roughly 100 pound - or almost 28
2016 State of Curbside report that cart-based services
collect more material than bin- or bag-based programs. percent difference - underscores that
The roughly 100 pound - or almost 28 percent difference moving the bin-based programs to carts is
- underscores that moving the bin-based programs to
still an enormously important strategy for
carts is still an enormously important strategy for improving
the performance of U.S. curbside recycling services. The improving the performance of U.S. curbside
difference between bag-based and cart-based collection recycling services.
is even more pronounced and indicates substantial
opportunity to increase material capture.
Figures 12 and 13 reported data as collected pounds in
curbside programs. However, all curbside collected material
includes materials that are not wanted, such as trash and
other non-recyclable materials, commonly referred to as
contaminants.19 THE RECYCLING PARTNERSHIP | 2020 STATE OF CURBSIDE RECYCLING REPORT
Case Study
From left, City of Sarasota, Fla. Solid Waste Division Supervisor Jonathan Williamson and recycling driver Pito Ortega working together to roll out carts to
Sarasota residents as part of our Coastal Communities and Waterways grant to help keep litter out of our waterways.
Sarasota’s Recipe for Success:
Education + Carts = High Participation,
More Material, and Less Contamination
Participation and collection volumes are up, and One of the first communities to be awarded a Coastal
contamination is notably lower in the City of Sarasota Communities and Waterways grant, Sarasota is an ideal
following a city-led recycling program reboot this spring that location for the implementation of carted recycling. A
included amped-up education and new, 95-gallon single- community of 57,000 residents, located 60 miles south of
stream carts. Tampa on the Florida Gulf, Sarasota hosts a thriving tourism
industry, unique recreational activities and ample opportunity
The Recycling Partnership puts private dollars to work, helping to learn about the local waters and the life that depends
communities invest in systems that protect resources and upon them. Most of all, Sarasota has a staff that was ready
empower residents to take sustainable action. Through a to take on the project.
$1 million donation from the Coca-Cola Foundation, The
Partnership recently opened its first Coastal Communities
and Waterways Grant.CASE STUDY THE RECYCLING PARTNERSHIP | 2020 STATE OF CURBSIDE RECYCLING REPORT 20
“We thought we had some good ideas … but getting The The Recycling Partnership’s grant allowed Sarasota to
Recycling Partnership’s input and experience really enabled ramp up recycling education.
us,” says Jonathan Williamson, solid waste division supervisor
for the City of Sarasota. Williamson notes that the new The roll-out also included community events and
program took about 18 months from inception to launch. cleanups to bring attention not only to recycling, but
also to the ways that better recycling and decreased
Since collection with the new, closed-lidded carts began litter are connected. Education also connected the
April 1, 2019, about 75 percent of households have been dots to how clean and beautiful waterways in Sarasota
participating in the program, which collects every other influence the community’s financial health by way of
week, Williamson says. a healthy tourism industry and ample opportunity for
outdoor recreation.
Recycling volume is up too—about 71 percent over a
year ago. The new, improved recycling program in Sarasota is part
of the city’s long-term sustainability planning — the goal
Another win? “We are also getting feedback from (the of which is a 100-percent sustainable Sarasota by 2045.
place) where we are hauling our recyclable material that
it is very clean,” says Stevie Freeman-Montes, the city’s “The future in Sarasota, because we’ve implemented
sustainability manager. this new recycling single-stream recycling program, is
that we’re going to be cleaner and more beautiful,”
Freeman-Montes attributes these successes to the robust says Freeman-Montes. “It’s going to help raise awareness
recycling education taking place around the transition. While about recycling and waste reduction strategies overall.”
the city already had single-stream recycling, it had been
using 18-gallon bins before switching to two-wheeled carts.
The additional funds and technical assistance provided by
Sarasota by the Numbers
100% Sustainable Sarasota by 2045*
**
*City of Sarasota sustainability plan goal.
**April 2019 compared to April 2018 recycling collection.21 THE RECYCLING PARTNERSHIP | 2020 STATE OF CURBSIDE RECYCLING REPORT
Curbside Contamination Rates
Concerns about material quality have grown tremendously important in the wake of weak market conditions. As a general
term, “contamination” refers to the material that residents include in their recycling collection but is not accepted in their
curbside program as well as material that is on the list of acceptable materials but has unacceptable amounts of residue.
Over the past two years, media stories and some industry spokespersons have cited average contamination rates that are
more than 30 percent. But what does the data say?
To effectively improve material quality, a community should specifically know its inbound contamination rate, which measures
the amount of contamination, or non-commodity material, in loads being delivered to the MRF from curbside collection routes.
The inbound contamination rate is different from the residue rate, which measures the amount of all material that is sent to
disposal after having been processed in a MRF.
Three Types of Contamination
+
Commodity Bale
Inbound Contamination Contamination Residue
What Communities Control
What MRFs Control
Contamination of the residential recycling stream takes three forms: contaminants
in inbound materials, contaminants in commodity bales produced by the MRF,
and overall MRF residues (which may contain some good commodities). MRFs and
communities should work together to analyze inbound loads and pursue strategies
to effectively address inbound contamination.
Data collected from The Recycling Partnership’s 2019 State of Curbside survey, supplemented by research of West Coast
communities and submittals to the Municipal Measurement Program, indicate that about 35 percent of communities know
their inbound contamination rate, which averages 16.9 percent.16
Figure 14: Percentage of Communities in The Recycling Partnership’s
2019 State of Curbside Survey That Know Their Inbound Contamination Rates
35% 65%
16 T he majority (57 percent) of communities that know their inbound contamination rate received this information from their MRF through periodic audits
of their community’s specific inbound material. Nearly 15 percent of respondents who know their inbound contamination rate receive data from their
MRF that represents all the communities that are coming to the MRF and is not specific to their community. The rest of survey respondents receive their
inbound contamination data from haulers or other sources.THE RECYCLING PARTNERSHIP | 2020 STATE OF CURBSIDE RECYCLING REPORT 22
Figure 15 compares the average contamination rates among different groups of respondents based on different
characteristics of a community recycling program. Cart-based collection services have been presumed to have inbound
contamination rates drastically higher than bin programs. There is no previously published data comparing the contamination
rates of bin- and cart-based collection for community recycling programs across the U.S. The Recycling Partnership’s 2019
State of Curbside Survey finds that the average inbound contamination rate for bin/bag-based programs is approximately five
percentage points lower than cart-based programs.
Figure 15: Differences in Inbound Contamination Rates for Bin vs Cart Programs Among
The Recycling Partnership’s 2019 State of Curbside Survey Respondents.
The Recycling Partnership’s 2019 State of Curbside Survey data can also be broken down for high-performing, mid-range, and
low-performing programs in terms of collecting pounds of recyclables per household. While there was some slight variation, the
data does not show any significant difference between the average inbound contamination rates.
Figure 16: Difference in Inbound Contamination Rates by Program Performance Levels23 THE RECYCLING PARTNERSHIP | 2020 STATE OF CURBSIDE RECYCLING REPORT
Community Actions to Address Contamination
The Recycling Partnership’s 2019 State of Curbside Survey provides a glimpse into how communities are taking action on
contamination issues, as displayed in Figure 17. Approximately 22 percent of survey respondents implemented all four anti-
contamination strategies recommended by The Recycling Partnership - cart tagging (putting oops tags on carts that tells a
resident what materials were found in their carts that don’t belong), rejecting contaminated carts (not picking them up and
leaving them on the curb), sending direct mailers or bill inserts to residents on what recyclables are and are not accepted, and
using general advertising to promote what recyclables are and are not accepted.
Figure 17: Methods of Contamination Control Reported by
The Recycling Partnership’s 2019 State of Curbside Survey Respondents
54%
43%
60%
6%
17%
The Recycling Partnership’s
Website
The Recycling Partnership’s website offers free online
resources to communities that outline the best
management practices for tackling contamination
both at the curb and at community drop-off
recycling centers. Find our Anti-Contamination (123) 456-7890 sampleurl.org
Toolkit and Campaign Builder online which has been
designed to provide steps, tools, and resources to
help improve the quality of your recycling program.THE RECYCLING PARTNERSHIP | 2020 STATE OF CURBSIDE RECYCLING REPORT 24
To evaluate the effectiveness of anti-contamination strategies on material quality, a community must be able to benchmark
and measure its progress. Figure 18 shows that communities use a variety of metrics to track their impacts, but that nearly half
conduct no measurement and another 13 percent do not know.
Figure 18: Methods of Measuring the Impact of Anti-Contamination Efforts by
The Recycling Partnership’s 2019 State of Curbside Survey Respondents
21%
20%
33%
45%
13%
*Percentages add up to more than 100% because some communities use combinations of the first three methods.25 THE RECYCLING PARTNERSHIP | 2020 STATE OF CURBSIDE RECYCLING REPORT
Community Partners Using The Recycling Partnership’s
Anti-Contamination Strategies Comment on their Efforts
Cart-tagging is most successful when the practice of cart inspections is combined with the rejection of worst-case instances of
contamination. The Recycling Partnership’s 2019 State of Curbside Survey data in Figure 19 shows that the average inbound
contamination rates are lowest in communities where tagging and rejection methods are jointly implemented.THE RECYCLING PARTNERSHIP | 2020 STATE OF CURBSIDE RECYCLING REPORT 26
Figure 19: Mix of Methods used by Curbside Programs to Address Contamination
Community Subset
19%
21%
15%
Average Inbound Contamination Rate
Curbside Program Staffing Resources
Curbside programs can address inbound contamination and better deliver a steady stream of high-quality recyclable
materials, or optimize their program’s performance, if they have the staffing and outreach resources to support those efforts.
The optional questions asked in The Recycling Partnership’s 2019 State of Curbside Survey provides a glimpse into the level of
dedicated staffing for curbside programs. Of the 262 communities who answered the additional questions, 145 or 55 percent of
those programs indicated they employed a dedicated recycling coordinator position.
It would be misleading to extrapolate this statistic across all curbside programs in the U.S. As discussed earlier, there may have
been a degree of “self-selection” in the response to The Recycling Partnership’s 2019 State of Curbside Survey, with a very low
likelihood that communities with no dedicated staff would respond to such a survey. The average number of households served
by the communities who responded to the question was also on the high end of community size at 62,632, where resources
to hire a dedicated coordinator are more available. With these factors in mind, it is safe to say that most curbside recycling
programs in the country do not have dedicated staff to help optimize program performance.27 THE RECYCLING PARTNERSHIP | 2020 STATE OF CURBSIDE RECYCLING REPORT
Curbside Program Outreach Resources
Budgetary resources for recycling outreach allow programs to optimize participation, capture, and material quality. Combined
data from The Recycling Partnership’s 2019 State of Curbside Survey, MMP, and the Partnership’s West Coast Contamination
Initiative shows insights into how programs are faring on this issue. Of the verified data community reports for MMP, a healthy
75 percent of communities indicated having an outreach budget for recycling, with the average funds available at $.95 per
curbside household served. Of 262 The Recycling Partnership’s 2019 State of Curbside Survey respondents answering optional
questions, 56 percent reported an outreach budget averaging $1.06 per curbside household served. In West Coast research,
44 percent of Washington and Oregon communities reported having a dedicated recycling outreach budget at an average
of $1.29 per household while the 17 percent of California communities reporting a dedicated budget are spending $.64 per
household. Across all of the communities from all sources of data for this analysis, 51 percent reported having a dedicated
budget spending $1.16 per household.
As with the dedicated recycling coordinator question, this outreach budget data should also not be projected across all U.S.
curbside programs. Again, among other issues, communities who are generally higher-performing are the ones likely to respond
to data requests like The Recycling Partnership’s 2019 State of Curbside Survey and this can exaggerate the percentage of all
communities with outreach budgets and the funding levels of those budgets. Taking this perspective into account, it is likely
that well less than half of communities have dedicated outreach budgets to help optimize program performance.
Curbside Programs Outreach Budgets per Household
Taking this perspective into
account, it is likely that well
less than half of communities
have dedicated outreach
budgets to help optimize
program performance.
Insights into Local Program Performance
This chapter has shared key data on how the local recycling programs that form the foundation of the U.S. recycling system are
performing in collecting recyclable commodities and addressing challenges like contamination. Their efforts provide a baseline
level of material capture from which the system can improve, but the ability to make such improvements are hampered by
negative market conditions explored in Chapter 3.You can also read