STATE OF PUBLIC TRANSPORTATION - 2020 Report - Metropolitan ...
←
→
Page content transcription
If your browser does not render page correctly, please read the page content below
STATE OF PUBLIC TRANSPORTATION
2020 Report
STATE OF PUBLIC TRANSPORTATION | 2020 REPORT
Prepared by the TPB Regional Public Transportation Subcommittee

About the TPB
The National Capital Region Transportation Planning Board (TPB) is the federally designated
metropolitan planning organization (MPO) for metropolitan Washington. It is responsible for developing
and carrying out a continuing, cooperative, and comprehensive transportation planning process in the
metropolitan area. Members of the TPB include representatives of the transportation agencies of the
states of Maryland and Virginia and the District of Columbia, 24 local governments, the Washington
Metropolitan Area Transit Authority, the Maryland and Virginia General Assemblies, and nonvoting
members from the Metropolitan Washington Airports Authority and federal agencies. The TPB is staffed
by the Department of Transportation Planning at the Metropolitan Washington Council of Governments
(COG).

Credits
Editor: Antonio Castañeda
Contributing Editor: Eric Randall

Acknowledgements
Members of the TPB Regional Public Transportation Subcommittee

Accommodations Policy
Alternative formats of this document are available upon request. Visit
www.mwcog.org/accommodations or call (202) 962-3300 or (202) 962-3213 (TDD).

TITLE VI NONDISCRIMINATION POLICY
The Metropolitan Washington Council of Governments (COG) fully complies with Title VI of the Civil
Rights Act of 1964 and related statutes and regulations prohibiting discrimination in all programs and
activities. For more information, to file a Title VI related complaint, or to obtain information in another
language, visit www.mwcog.org/nondiscrimination or call (202) 962-3300.

El Consejo de Gobiernos del Área Metropolitana de Washington (COG) cumple con el Título VI de la Ley
sobre los Derechos Civiles de 1964 y otras leyes y reglamentos en todos sus programas y actividades.
Para obtener más información, someter un pleito relacionado al Título VI, u obtener información en
otro idioma, visite www.mwcog.org/nondiscrimination o llame al (202) 962-3300.

Copyright © 2021 by the Metropolitan Washington Council of Governments

                                                                         TPB STATE OF PUBLIC TRANSPORTATION | 2020 REPORT I 1
TABLE OF CONTENTS
STATE OF PUBLIC TRANSPORTATION | 2020 REPORT 4
Purpose 4
Summary 4
PART I – COVID-19 & IMPACTS ON PUBLIC TRANSPORTATION 7
NCR transit service providers’ pandemic-response measures ........................................................... 7
PART II - FIXED ROUTE PUBLIC TRANSIT SERVICES PROFILE SHEETS 11
Washington Metropolitan Area Transit Authority (WMATA) Metrorail .............................................. 11
Washington Metropolitan Area Transit Authority (WMATA) Metrobus ............................................. 12
Alexandria Transit Company (DASH) .................................................................................................. 13
ART Arlington Transit ........................................................................................................................... 14
DC Circulator........................................................................................................................................ 15
DC Streetcar ........................................................................................................................................ 16
City of Fairfax CUE ............................................................................................................................... 17
Fairfax Connector ................................................................................................................................ 18
Loudoun County Transit ...................................................................................................................... 19
Frederick TransIt ................................................................................................................................. 20
Charles County Transit Services - VanGO .......................................................................................... 21
Montgomery County Ride On .............................................................................................................. 22
Prince George's County The Bus ........................................................................................................ 23
Potomac & Rappahannock Transportation Commission.................................................................. 24
Virginia Railway Express ..................................................................................................................... 25
PART III - OTHER PUBLIC TRANSIT SERVICES - OVERVIEW 26
Washington Metropolitan Area Transit Authority (WMATA) MetroAccess ........................................ 26
Maryland Department of Transportation and Transit Administration (MDOT MTA) ........................ 26
MDOT MTA Commuter bus ................................................................................................................. 27
MARC (Maryland Area Regional Commuter) Rail .............................................................................. 28
Virginia Regional Transit (VRT) ........................................................................................................... 28
Regional Transportation Agency of Central Maryland (RTA) ............................................................. 28
PART IV - REGIONAL PUBLIC TRANSPORTATION ORGANIZATIONS 29
Northern Virginia Transportation Commission (NVTC) ...................................................................... 29
Northern Virginia Transportation Authority (NVTA) ............................................................................ 30
Washington Suburban Transportation Commission (WSTC) ............................................................ 31
Maryland Transit Administration (MTA) ............................................................................................. 31
Virginia Department of Rail and Public Transportation (DRPT) ........................................................ 31
PART V - PUBLIC TRANSPORTATION ACCOMPLISHMENTS 33
Major Studies Completed and List of Studies in Progress ............................................................... 33
Significant Operational Achievements ............................................................................................... 37
PART VI: TRANSPORTATION PLANNING BOARD ACTIVITIES 38
TPB Regional Public Transportation Subcommittee (RPTS) ............................................................. 38
Performance Based Planning and Programming .............................................................................. 39
Visualize 2045..................................................................................................................................... 39
APPENDIX – FIGURES 41
TPB STATE OF PUBLIC TRANSPORTATION | 2020 REPORT I 2FIGURES AND TABLES
Figure 1: National Capital Region Unlinked Annual Trips by Mode (%) 5
Figure 2: National Capital Region Local Agency Bus/Streetcar
Trips by Agency (Percentage), 2019 NTD 6
Figure 3 - Percentages of Normal Transit Ridership
and Service Levels Reported by Selected Transit Providers As of December 1, 2020 7
Figure 4 - Overview of COVID-19 responses by Service Provider in the NCR 7
TPB STATE OF PUBLIC TRANSPORTATION | 2020 REPORT I 3STATE OF PUBLIC TRANSPORTATION | 2020 REPORT
PURPOSE
The purpose of this report is to provide a concise overview of the state of regional public transportation
in the National Capital Region (NCR). Public transportation is a vital component to improving livability,
environmental and economic quality of life for many communities. Impacts include providing access
to jobs, goods and services for millions of residents, allowing more vibrant and meaningful social
interaction during daily travel, serving as an alternative to single-occupancy vehicles, reducing
congestion and offsetting greenhouse gas emissions.
SUMMARY
Public transportation is an important component of the region’s transportation network. In the 2019
annual data reported to the National Transit Database (NTD) of the Federal Transit Administration
(FTA), there were over 420 million unlinked passenger trips across the region, with approximately 1.4
million trips by public transportation taken every weekday in the NCR.
Three primary modes of public transportation operate in the region:
Rail – offers high-capacity, high quality transit along major corridors. The region’s major public
transportation provider, the Washington Metropolitan Area Transit Authority (WMATA) operates
Metrorail, which is the backbone of the region’s transit system carrying over half of all daily public
transportation trips. Commuter rail in the NCR is operated by MARC and VRE for Maryland and Virginia
respectively, and brings travelers from the more distant communities to the employment centers in
the downtown core. The region’s rail network will continue to expand with the future completion of
Phase 2 of the Metrorail Silver Line in Virginia and the Purple Line light rail in Maryland. In addition,
there is a short segment of streetcar in the District of Columbia.
Bus – provides access across the region and carry over 40% of all transit trips in the region. Thirteen
bus transit operators form a network for the region, serving as the primary means of public
transportation for most travelers as well as carrying many passengers to rail stations to continue their
trips by rail. WMATA Metrobus is the region’s largest operator, providing 70% of all bus trips in the
region. The region’s transportation network is supplemented by local bus providers in many local
jurisdictions and longer-distance commuter buses, which offer a variety of services like bus to rail
connections, bus rapid transit.
Paratransit – supplements bus and rail fixed-route service by offering on-demand or shuttle services
for customers with disabilities or otherwise mobility-impaired. MetroAccess is the largest paratransit
operator and provides most service in DC and Maryland, while several Virginia jurisdictions operate
their own local services. Paratransit providers must meet certain operating requirements under the
Americans with Disabilities Act (ADA).
TPB STATE OF PUBLIC TRANSPORTATION | 2020 REPORT I 4Other modes and providers of public transportation – beyond the services operated by government
agencies include private coach operators, taxicabs, private shuttle services, Transportation
Networking Companies (TNCs) and other public transportation providers that operate into the
Metropolitan Washington region.
TPB Regional Travel & Voices of the Region Surveys - TPB conducts a Regional Travel Survey (RTS)
every ten years in order better understand the daily travel patterns of the residents. The last RTS was
completed in 2018 and its key takeaways can be found in the below link:
https://www.mwcog.org/newsroom/2018/06/20/here-are-seven-takeaways-from-tpbs-
regional-travel-trends-study/a
Additionally, in 2020 TPB conducted a public opinion survey on travel related to and after the
pandemic called the Voices of the Region Survey as a part of the public engagement efforts for the
next update of TPB’s long-range transportation plan, Visualize 2045. Key findings can be found in Part
VI of the SOPT report and in the link below:
https://www.mwcog.org/newsroom/2021/03/09/what-did-the-voices-of-the-region-survey-
tell-us-about-travel-during-covid-19-and-beyond-tpb-visualize-2045/
NCR 2019 NTD Data Overview - Congress established the NTD to be the Nation’s primary source for
information and statistics for US transit systems. Statute requires that recipients or beneficiaries of
grants from the FTA under the Urbanized Area Formula Program (§5307) or Other than Urbanized Area
(Rural) Formula Program (§5311) submit data to the NTD. The data used in this report is from years
up to and including reporting year (RY) 2019, which was made available in October 2020.
Figure 1 below provides a breakdown of the annual transit ridership by mode in the NCR Capital
Region. In 2019, 84% percent of all public transportation rides in the region were delivered by WMATA,
with a majority of those on Metrorail followed by Metrobus. Local bus operators and the DC Streetcar
make up 11% of the annual public transportation trips in the region. Commuter rail and commuter bus
account for 5% of the annual public transit trips.
Figure 1: National Capital Region Unlinked Annual Trips by Mode (%)
Commuter Rail Commuter Bus
13,598,999 6,433,387
3% 2%
Local Bus &
Streetcar
48,075,750
11%
Metrorail
Metrobus 228,974,810
123,333,115 55%
29%
Source: 2019 National Transit Database
TPB STATE OF PUBLIC TRANSPORTATION | 2020 REPORT I 5Separate from WMATA, the NCR contains several local public transportation operators who provided
over 48 million unlinked passenger trips in 2019. Figure 2 illustrates the percentage of overall local
bus and streetcar ridership for 2019 by local operator. Montgomery County’s Ride On accounts for
12% of local bus trips in the region, equivalent to over 20 million passenger trips in 2019. Another
significant local operator is the Fairfax Connector, which provided over 8 million trips across its service
area in 2019. Metrobus, Ride On and Connector services together account for nearly 90% of local bus
trips in the NCR. The remaining 10 local bus service operators provided over 19 million trips in 2019
combined.
Figure 2: National Capital Region Local Agency Bus/Streetcar Trips by Agency (Percentage), 2019 NTD
DC
Circulator
Connector 3%
5% DASH
2%
ART
2%
Metrobus Other
72% 28% The Bus
1%
RideOn
12%
DC Streetcar,
Omni Ride, Van
Go, CUE, TransIT,
Loudoun County
Transit
3%
Source: 2019 National Transit Database.
TPB STATE OF PUBLIC TRANSPORTATION | 2020 REPORT I 6PART I – COVID-19 & IMPACTS ON PUBLIC
TRANSPORTATION
Overview Figure 3 - Percentages of Normal Transit Ridership and
In the wake of the COVID-19 pandemic and Service Levels Reported by Selected Transit Providers
throughout 2020 local transit services in the As of December 1, 2020
National Capital Region were faced with new
pressures operationally, financially and 100%
politically to adapt to a new normal of 77%
80%
decreasing ridership, loss of peak travel 65% 64%
55%
demand and related fare revenue losses as a 60%
45% 48%
40%
result of stay-at-home orders and work from 40% 28%
25%
home policies implemented across many
20% 13% 13% 10% 10%
employers. Simultaneously, service providers 4%
quickly adapted to the new public health 0%
protocols mandated across levels of
government, to protect the health and safety of
riders and operators. Through these new
pressures, many of our local service providers
quickly shifted priorities and service levels to % of Normal Ridership (All Day)
balance short- and long-term needs while
finding innovative ways to ensure the region’s % of Normal Service Levels (AM Peak
Only)
transportation networks remain operational for
our transit dependent workers unable to Source: SOPTR Questionnaire and online review of
telework. A few measures taken by local service service providers’ COVID-19 policies.
providers across 2020 included suspension of
fare collection and allowed or mandated rear-door boarding, implementation of social distancing
requirements on vehicles, installation of physical barriers between riders and operators, and increased
cleaning frequencies of fleets to reduce or prevent the spread of the virus. More detailed policies and
strategies can be found below for each service provider in the region.
Figure 4 - Overview of COVID-19 responses by Service Provider in the NCR
TPB STATE OF PUBLIC TRANSPORTATION | 2020 REPORT I 7NCR TRANSIT SERVICE PROVIDERS’ PANDEMIC-RESPONSE
MEASURES
Washington Metropolitan Area From mid-March through July/August, Metro
Transit Authority (WMATA) implemented “A/B Scheduling” for train
operators, bus operators and maintenance
Throughout 2020, Metro adjusted its service personnel to minimize the risk of transmission
pattern, frequency and hours on Metrorail and and protect service continuity. Under this
Metrobus to enhance safety for employees and practice, Metro staff were divided into two
individuals who must travel during the groups (an “A” group and a “B” group) within
pandemic. Service on bus and rail was initially each office; the lettered groups worked
decreased to approximately 35% of pre- alternating days, remained separated to
pandemic levels. At this time, Metro closed 19 minimize the risk of transmission and protect
Metrorail stations as well as entrances at an service continuity.
additional nine stations in an effort to conserve
critical resources and protect the health and Lastly, Metro held extensive marketing
safety of Metro employees and the public. campaigns at various points throughout the
Metro reopened 15 stations in June 2020, as pandemic, encouraging customers to use
business and social restrictions began to lift in Metro only for essential trips, to maintain
the District, Maryland, and Virginia. By late- social distancing and wear masks as service
August 2020, Metro ran approximately 75% of resumed and stay-at-home orders were lifted
pre-pandemic bus service and more than across the region. In December 2020, Metro
doubled the number of weekday rail service began publishing data publicly about on-board
trips scheduled. crowding to allow customers to socially-
distance, on both bus and rail.
To protect frontline employees on rail, Metro
isolated the first and last railcars and DASH
encouraged station managers to aid customers In Spring 2020, ridership levels dropped to
from inside kiosks. On bus, Metro 15% of pre-pandemic levels on DASH services,
implemented rear-door only boarding and slowly climbing to 40% by year’s end. Beginning
increased the distance between operators and in March 2020 and continuing onwards, DASH
customers by blocking of seats closest to the reduced service levels, suspended fare
operator. Bus fares were also waived and by collection and introduced rear door boarding.
mid-May, all customers were required to wear Lastly throughout 2020, DASH required masks
face coverings or masks when traveling on be worn inside buses, installed driver barriers
Metro. They also significantly increased interior on all revenue vehicles, reduced rider capacity
cleaning of railcars, buses and passenger allowed in vehicles (from March to September)
facilities including nightly disinfection of every and provided additional standby buses on call
vehicle in service, passenger facility cleaning at to meet demand changes.
revenue and non-revenue locations and garage
to garage service to allow for cleaning of buses
between each run.
TPB STATE OF PUBLIC TRANSPORTATION | 2020 REPORT I 8DC Circulator
In 2020, DDOT expanded its red bus lane pilot TransIT
with three quick-build bus priority pilot To protect customers and staff, TransIT
projects as part of its COVID-19 response and Services of Frederick County implemented the
recovery. The three quick-build bus priority following safety protocols throughout 2020,
projects allowed for rapid implementation from mandated wearing of masks and rear door
DDOT’s list of bus priority corridors, required boarding, strongly encouraged social
minimal design, and helped address current distancing practices while on board TransIT
and future needs for Metrobus and Circulator and provided hand sanitizer at every bus door.
service. Additionally, the dedicated car free Additionally, TransIT suspended fare
lanes allowed WMATA and Circulator to collection, installed driver barriers, required
efficiently operate bus service, helping to drivers to wear gloves when handling
reduce passenger crowding and maintain safe passengers’ belonging, and implemented an
distancing. DC Circulator also provided new enhanced cleaning and disinfecting schedule
signage regarding public safety measures and with hospital-grade anti-viral misting (drivers
operated on a modified schedule starting in also periodically clean their areas throughout
Spring 2020. Additional safety measures the day).
implemented during 2020 included the
following: required face masks and social VanGo
distancing on buses, suspension of fare Throughout 2020, Charles County VanGO
collection, enabled rear-door boarding, and operated full fixed route service while limiting
expanded cleaning protocols to properly deep bus capacity to 50% and required face masks
clean and disinfect buses be worn while onboard. An enhanced
disinfecting schedule was implemented for
City-University Energysaver vehicles, facilities and bus shelters.
At the beginning of the COVID-19 pandemic, Paratransit service levels were adjusted to
The City of Fairfax’s City-University Energysaver meet reduced demand, subscription trips to
(CUE) suspended fare collection and began dialysis remained at 100% of pre-pandemic
rear door boarding to limit contact between levels while subscription service to senior
drivers and passengers. CUE also increased centers have not operated since March 2020.
cleaning cycles on buses, in shelters and at Fixed route service ridership has settled at
other CUE facilities, and regularly about 60% of pre-pandemic levels, while ADA
communicated reminders about evolving best ridership settled at about 80% of pre-pandemic
practices (such as social distancing, hand levels.
washing, and wearing masks when this was
recommended for the general public). Regular Ride On
schedules were maintained throughout the In early March when the coronavirus began to
pandemic to reduce the risk of crowding and spread, concerns were immediately raised for
retain CUE’s skilled and essential workforce. Ride On staff regarding bus operator safety and
availability, and some operators were placed
Connector on administrative leave based on CDC
In response to the pandemic, Fairfax Connector guidelines related to personal care and/or
reduced bus service on many of its routes in family members. In mid-March, Ride On began
April 2020. Service was restored on August 29. to gradually reduce service levels based on
Other COVID-related mitigation efforts included ridership demand and bus operator availability
the adoption of rear door only and the (during this time schedules were modified on a
suspension of fare payments. Fare payment nearly daily basis). On March 29, 2020 the
and front door boarding resumed early 2021. Essential Service Plan was implemented.
TPB STATE OF PUBLIC TRANSPORTATION | 2020 REPORT I 9Operators who worked under the new plan enhanced cleaning performed weekly. When
received an extra $10 per hour. Ride On staff possible, drivers limited the number of
worked collaboratively with MCGEO (United passengers to 10 at a time to promote social
Food and Commercial Workers International, distancing. Seats closest to the bus operator
Local 1994) union representatives to ensure were blocked off to encourage social
work was distributed equitably amongst the distancing from the driver. OmniRide also
active operators. This new procedure allowed reduced service levels on select routes,
for improved operational flexibility. suspended fares on its Local and Metro
Express services to minimize interactions
In addition to new routes and service plan between bus operators and riders and allow
during 2020, Ride On also suspended fare customers to board quickly and self-distance
collection, required riders wear face masks more effectively. Fares were still required for
and practice social distancing while onboard commuter services, but cash was not accepted
and frequently disinfected bus fleets. In 2020
Ride On expanded their call-n-ride service to VRE
allow for the use of taxis for delivery of On March 17, 2020, VRE shifted to a reduced
essential goods from grocery stores, food “S” schedule (16 daily trains) to adjust for
banks, and restaurants. reduced ridership. By July 27, an “S Plus”
schedule was implemented and continued
TheBus throughout 2020 (operating 18 daily trains). In
Beginning in late March 2020, Prince Georges addition to reduced service, the following
County’s TheBus reduced service levels in procedures and protocols were implemented
response to the covid pandemic. Specifically, for staff and passengers:
TheBus suspended service on low ridership • Staff began working from remote
lines, maintained service on major lines and environments in mid-March 2020.
community lines without nearby Metrobus • Train crews and other front-line staff
service. For the remainder of the year, TheBus were provided PPE (e.g., masks,
suspended fares, installed driver barriers, sanitizer, social distancing.
increased frequencies of interior cleaning and • Enhanced cleaning of passenger
required passengers to board from the rear coaches and facilities was
doors. Ridership in 2020 decreased by 70% implemented with an emphasis on
compared to pre-COVID ridership levels. In high-touch surfaces, included twice
August 2020, TheBus increased frequencies daily and a nightly cleaning.
on active service and reactivated 3 bus lines to • Installed graphics to make social
increase service coverage and access to distancing on trains and at stations as
Metrorail stations. Ridership, while still lower simple as possible and hand sanitizer
than pre-COVID levels, increased to an average dispensers across stations and trains.
of 4,000 passengers per day. • Implemented Federal and state orders
requiring face masks for passengers.
PRTC • Created video tour of railcar outlining
For passengers conducting essential travel, social distancing measures.
OmniRide took recommended precautions to • Continued monitoring of passenger
reduce the likelihood of passengers and staff loads, enhanced cleaning protocols
spreading COVID-19 on buses. This included and social distancing measures.
stringent daily cleaning of bus interiors; local
buses sanitized mid-day in between service,
TPB STATE OF PUBLIC TRANSPORTATION | 2020 REPORT I 10PART II - FIXED ROUTE PUBLIC TRANSIT SERVICES
PROFILE SHEETS
WASHINGTON METROPOLITAN AREA TRANSIT AUTHORITY
(WMATA) METRORAIL
https://www.wmata.com
Overview
Metrorail provides safe, clean, reliable transit service for more than 800,000 customers a day
throughout the Washington, DC area. The system is one of the busiest in the United States, serving 91
stations in Virginia, Maryland, and the District of Columbia. The Metrorail urban rail system is the
second largest urban rail system in the country, serving a 1,500 square-mile area and including
118 miles of network and 91 stations.
Recent Accomplishments
• SmarTrip® on iPhone and Apple Watch was released in 2020, allowing riders to add a SmarTrip
card to their devices, hold them near any card reader where SmarTrip is accepted and pay for their
fares via their device. As of 2021 SmarTrip® is also available on Android via Google Pay.
• Silver Line Phase 2 is nearly complete; The Potomac Yard Metro Station is now more than 50%
complete. Opening of Silver Line Phase 2 is anticipated for Fall 2022.
• The Major Platform Rehabilitation Project which rebuilt deteriorating platforms at four stations in
Northern Virginia: East Falls Church, West Falls Church, Dunn Long, and Vienna was completed.
• Over 13 station platforms have been rehabilitated to date as a part of the Platform Improvement
Project. Key customer experience improvements at the stations include new slip-resistant tiles,
passenger information displays (PIDs), surveillance systems, bus shelters, renovated bathrooms,
and improved lighting.
System Characteristics
Vehicle Fleet: 1200 Passenger Cars. 91 Stations
Service Type: Heavy Rail
Provider data
Metrorail Annual Operating Costs Annual Ridership
1,200
Millions
1,000 $1,113
$1,044
$984 $1,002 $993
800
600
400
200 270.2 249.2 227.1 229.2 229.0
0
2015 2016 2017 2018 2019
Source: National Transit Database: FY15-19; see below for revenue source information
TPB STATE OF PUBLIC TRANSPORTATION | 2020 REPORT I 11WASHINGTON METROPOLITAN AREA TRANSIT AUTHORITY
(WMATA) METROBUS
https://www.wmata.com
Overview
Metrobus provides more than 400,000 trips each weekday serving 11,500 bus
stops in the District of Columbia, Maryland, and Virginia. Metrobus is the sixth
busiest bus agency in the United States, with a fleet of more than 1,500 buses.
Recent Accomplishments
• Metrobus’ Service Guidelines were updated in 2020 to help create a clear and formalized
approach to service and budget decisions, as well as assist in the provision of more equitable
service, incorporating customer experiences, and better aligning Metrobus with its peers. The
service guidelines were the first recommendation from the Bus Transformation Project.
• Metro worked closely with the District Department of Transportation (DDOT) on a number of bus
priority projects, including the expansion of bus priority lanes (red painted lanes), testing of Transit
Signal Prioritization (TSP) software with the District, and advanced TSP implementation programs.
Metro identified additional bus queue jump locations for the District and agreed to coordinate a
deployment schedule.
• During the pandemic, Metro developed and released real-time crowding information for Metrobus
and Metrorail, to empower customers with more information to decide when and how to travel.
System Characteristics
Vehicle Fleet: 1558 Buses, 319 Routes, 14 Maintenance Facilities
Service Type: Fixed Route
Provider Data
METROBUS Annual Operating Costs Annual Ridership
1,200
Millions
1,000 $1,113
$1,044
$984 $1,002 $993
800
600
400
200
132.9 127.7 123.1 119.7 123.3
0
2015 2016 2017 2018 2019
FY19 Revenue Sources (for all of WMATA) 1%
26% 35% 22% 16%
Directly Generated Local Government State Government
Federal Government Non-Added Revenue
Source: National Transit Database: FY15-19
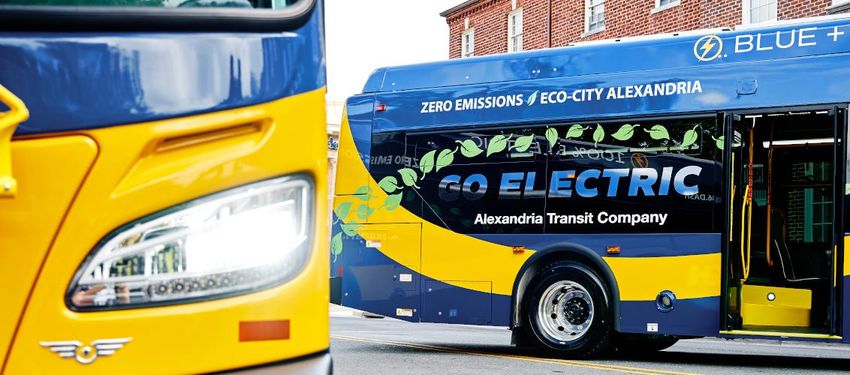
TPB STATE OF PUBLIC TRANSPORTATION | 2020 REPORT I 12ALEXANDRIA TRANSIT COMPANY (DASH)
https://www.dashbus.com
Overview
The Alexandria Transit Company’s DASH system provides safe, reliable,
and convenient bus service within the City of Alexandria. DASH
connects with other transit services including Metrobus, Metrorail,
Virginia Railway Express, and other local bus systems via 11 routes.
DASH serves all the Alexandria Metrorail Stations as well as the
Pentagon Metrorail station during morning and evening peak periods.
DASH’s name symbolizes a commitment to the citizens of Alexandria,
Driving Alexandria Safely Home.
Recent Accomplishments
• Major service enhancements in early 2020 along routes AT1+ & AT9 resulted in a 30-45% increase
in ridership. The enhancements were funded by I-95/395 Commuter Choice Program.
• DASH procured six electric buses in late 2020, an additional eight are scheduled for Fall 2021.
• DASH and the City of Alexandria completed the Alexandria Transit Vision Plan in 2019. This project
redesigned the city's bus network in an effort to better align the network design with community
priorities, meet current/future demands, and make transit more useful for more people. The first
phase of the ATV Plan, known as the "New DASH Network" is being launched in September 2021.
• The King Street Metro Access Improvements Project nears completion, the new bus loop began
operation in June 2021
System Characteristics
Vehicle Fleet: 101 Buses, 11 Routes, 1 Maintenance Facility
Service Type: Fixed Route
PROVIDER DATA
DASH Annual Operating Costs Annual Ridership
25
Millions
20
$20
15 $17 $17 $17
$16
10
5
4.3 4.1 3.9 3.9 3.9
0
2015 2016 2017 2018 2019
FY19 Revenue Sources
16% 75% 4% 5%
Directly Generated Local Government State Government Federal Government
Source: National Transit Database: FY15-19
TPB STATE OF PUBLIC TRANSPORTATION | 2020 REPORT I 13ART ARLINGTON TRANSIT
https://www.arlingtontransit.com
Overview
Arlington Transit (ART) operates within Arlington County, Virginia, supplementing Metrobus with cross-
county routes and neighborhood connections to Metrorail and VRE. ART improves the quality of life in
the region by moving and connecting people while reducing traffic congestion. All ART buses operate
on clean-burning natural gas (CNG) and are fully ADA accessible.
Recent Accomplishments
• In September 2020 as a part of Hunger Action Month, ART partnered with the Arlington Food
Assistance Center (AFAC) and Giant Foods to take action against hunger by challenging the
community to “stuff” STAR (Specialized Transit for Arlington Residents) vans full of non-perishable
food items. The “Stuff the Bus” event donated all the food to AFAC who distributed it to over 2,200
families who rely on AFAC for free supplemental groceries.
• The Ballston Station Multimodal Improvements project is currently under the first phase of
construction. The ART / Metro joint project aims to improve traffic safety, transit circulation, access
and user comfort of the facilities and public spaces at the Ballston-MU Metrorail Plaza
System Characteristics
Vehicle Fleet: 51 Buses, 17 Routes, 1 Maintenance Facility
Service Type: Fixed Route
Provider data
ART Annual Operating Costs Annual Ridership
16
Millions
14 $15
$14 $15
12
$12
10
$10
8
6
4
3.4 3.9
2 2.8 3.1 3.0
0
2015 2016 2017 2018 2019
FY19 Revenue Sources
9% 40% 49% 2%
Directly Generated Local Government State Government Federal Government
Source: National Transit Database: FY15-19
TPB STATE OF PUBLIC TRANSPORTATION | 2020 REPORT I 14DC CIRCULATOR
https://www.dccirculator.com
Provider Overview
The DC Circulator delivers affordable, comfortable, and efficient bus service that connects people to
business, culture and entertainment throughout the District of Columbia. The system consists of six
routes that provide over five million trips a year to Washington, DC, and Rosslyn, VA. The local bus
service, now the fourth largest bus system in the National Capital Region, is the product of a unique
partnership between the District Department of Transportation (DDOT), Washington Metropolitan Area
Transit Authority (WMATA) and DC Surface Transit, Inc. (DCST).
Recent Accomplishments
• Three corridor projects constructed in 2020 (14th St NW, M Street SE, MLK Jr Ave SE) tripled the
amount of bus lane-miles in the District.
• A total of eight corridor projects are in progress including 16th St NW (under construction), H & I
streets NW (construction scheduled for 2021), and K street (currently in its design phase).
• The Bus Priority Toolbox was completed in late 2020 to help identify bus priority treatments, improve
bus service and deliver projects faster. A Bus Priority Plan is currently in progress and anticipated to
be completed in 2021.
System Characteristics
Vehicle Fleet: 61 Buses, 6 Routes, 2 Maintenance Facilities
Service Type: Fixed Route
Provider Data
DC Circulator Annual Operating Costs Annual Ridership
30
Millions
25 $27
$25
20 $22
$20 $19
15
10
5
5.1 5.9 5.0 5.5
4.6
0
2015 2016 2017 2018 2019
Source: National Transit Database: FY15-19; see below for Revenue Source information
TPB STATE OF PUBLIC TRANSPORTATION | 2020 REPORT I 15DC STREETCAR
https://www.dcstreetcar.com
Provider Overview
The DC Streetcar is a surface streetcar network in Washington, D.C. Opened in 2016, the Streetcar
consists of a single line: a 2.2-mile segment running in mixed traffic along H Street and Benning Road
in the city's Northeast quadrant. The route is served by 6 streetcars that provided over 1,000,000 trips
in the district in 2019. DC Streetcar operates as a free service with the goals of linking neighborhoods
with a modern, convenient, and attractive transportation alternative; providing quality service to attract
and reach new transit ridership; offering a broader range of transit options for District residents;
reducing short inner-city auto trips, parking demand, traffic congestion and air pollution; and
encouraging economic development and affordable housing options along streetcar corridors.
Recent Accomplishments
• Planning activities continue for the eastward extension of the streetcar to the Benning Road
Metrorail station
System Characteristics
Vehicle Fleet: 6 Streetcars, 1 Route, 1 Maintenance Facility
Service Type: Fixed Route
Provider Data
DC Streetcar Annual Operating Costs Annual Ridership
14
Millions
12 $13
10 $11
8 $9
6
4
2 1.12 1.17 1.19
0
2017 2018 2019
FY19 Revenue Sources (For both Circulator & Streetcar)
100%
State Government
Source: National Transit Database: FY15-19
TPB STATE OF PUBLIC TRANSPORTATION | 2020 REPORT I 16CITY OF FAIRFAX CUE
https://cuebus.org
Provider Overview
The City of Fairfax City-University Energysaver (CUE) bus system provides regularly scheduled, low-cost
transportation services to George Mason University, shopping centers and other locations within the
City of Fairfax, as well as the Vienna/Fairfax-GMU Metrorail Station. All CUE buses are fully accessible
to persons with disabilities.
Recent Accomplishments
• Automatic Passenger Counters (APC) were installed on all CUE buses in April 2020.
• The multimodal transportation chapter of Livable Fairfax (the city’s comprehensive plan) was
completed in summer 2020. Its goals include: identifying priority transit networks on key corridors,
enhancing significant transfer locations, implementing recommendations from the Transportation
Development plan (TDP), expanding ADA-accessible sidewalks and crosswalks serving bus stops,
and achieving / maintaining 90% on-time performance for the CUE system.
• The CUE Access and Technology Improvements study was completed in 2020 to prioritize
improvements to the CUE Bus system including amenities (e.g., shelters and signs) while increasing
the availability of real-time transit information. Design and construction of improvements are
anticipated by 2022.
• CUE’s Bus Stop Improvement Project began its design phase in 2020, and is expected to be
completed by FY2023 (the project is funded by the I-66 Commuter Choice program)
System Characteristics
Vehicle Fleet: 12 Buses, 4 routes, 194 bus stops, 1 Maintenance Facility
Service Type: Fixed Route
Provider Data
CUE Annual Operating Costs Annual Ridership
5
Millions
4
$4
$4
$4 $3 $3
3
2
1
0.77 0.68 0.65 0.61 0.60
0
2015 2016 2017 2018 2019
FY19 Revenue Sources
27% 58% 15%
Directly Generated Local Government State Government
Source: National Transit Database: FY15-19
TPB STATE OF PUBLIC TRANSPORTATION | 2020 REPORT I 17FAIRFAX CONNECTOR
https://www.fairfaxcounty.gov/connector
Provider Overview
Fairfax Connector is the largest local bus system in the Northern Virginia
region transporting approximately 30,000 passengers on 91 routes daily. Fairfax Connector aims to
provide world class transportation service, promote greater mobility, while improving the safety of its
community and enhancing the quality of life for riders.
Recent Accomplishments
• Two new routes began operation in 2020: Route 396 began service in January & Route 697 in
August. Both routes are funded by two-year grants from the I-66 Inside the Beltway Commuter
Connections grant program managed by NVTC.
• Design for the Springfield CBD multi-modal facility was completed in 2020. The facility will include
space for slug lines, a multi-use space for the public and bus lane; construction is expected in 2021.
• Design is in progress for the Monument Drive multi-modal facility. Funded by the I-66 Outside the
Beltway Project, the project will include space for slug lines, bicycle facilities, and an 8-bay bus loop.
• The Gambrill Road Park-and-Ride / Backlick North Park-and-Ride secure bicycle parking projects are
both currently in design review. Funding is via the I-95/I-395 Commuter Connections grant program.
• Planning for the operational takeover of 5 Metrobus routes (3A, 3T, 15K, 29C, 29W) as Connector
routes (803, 703, 715, 834, and 835 respectively), and the Springfield Circulator routes (former
Metrobus Routes S80, S91) is now complete.
System Characteristics
Vehicle Fleet: 308 Buses, 91 Routes, 3 Maintenance Facilities
Service Type: Fixed Route and Commuter Service
Provider Data
Fairfax Connector Annual Operating Costs Annual Ridership
100
Millions
80 $86 $85
$81 $81 $81
60
40
20
9.8 9.0 8.6 8.3 8.3
0
2015 2016 2017 2018 2019
FY19 Revenue Sources
13% 87%
Directly Generated Local Government State Government
Source: National Transit Database: FY15-19
TPB STATE OF PUBLIC TRANSPORTATION | 2020 REPORT I 18LOUDOUN COUNTY TRANSIT
https://www.loudoun.gov/bus
Provider Overview
Loudoun County offers four distinct transit services: Local Fixed Route, Paratransit, Metro Connection
and Commuter Bus. The Local Fixed Routes provides all day transit service from Purcellville through
Leesburg and eastern Loudoun County. Paratransit services are ADA-accessible, and also provide curb
to curb bus service for eligible riders within ¾ of a mile of local fixed routes. Metro Connection provides
rush hour bus service between fifteen Loudoun County Park and Ride Lots and Metrorail Stations. The
commuter bus services operate during the AM and PM peak periods providing transportation from
Loudoun Park and Ride lots to Rosslyn, Crystal City, the Pentagon, and D.C.
Recent Accomplishments
• Throughout 2020, local fixed-route bus stop improvements were in their design phase as they plan
to be implemented in a phased approach based on ease of implementation, permitting
requirements, need for ROW acquisition and bus ridership.
• Design Phase is underway for the Western Loudoun Park and Ride Project and scheduled for
completion in late 2022. The project will provide a minimum of 250 surface parking spaces adjacent
to the proposed Fields Farm Park in Purcellville.
• The Metro Station Area Pedestrian Improvements project along the Loudoun Gateway is currently
underway and to provide sidewalks, shared-use trails, crosswalks or intersection improvements to
improve pedestrian access. The project is being administered by VDOT.
System Characteristics
Vehicle Fleet: 30 local buses, 77 commuter buses, 1 Maintenance Facility.
Service Type: Fixed Route, Commuter, and Paratransit Service
Provider Data
Loudoun County Annual Operating Costs Annual Ridership
20
Millions
$17 $17
15 $16
$16
$14
10
5
1.8 1.8 1.8 1.7 1.7
0
2015 2016 2017 2018 2019
FY19 Revenue Sources
41% 30% 28%
Directly Generated Local Government State Government
Source: National Transit Database: FY15-19
TPB STATE OF PUBLIC TRANSPORTATION | 2020 REPORT I 19FREDERICK TRANSIT
https://frederickcountymd.gov/105/TransIT
Provider Overview
TransIT Services of Frederick County is an award-winning public transit organization providing access
to jobs, shopping, medical services, and educational institutions, while reducing auto emissions, traffic
congestion, and improving the quality of life for residents of Frederick County. Connector buses
operate in the City of Frederick and the urbanized areas of Frederick County. Six routes can deviate
within ¾ mile of the route to assist passengers who are unable to board the bus at a regular stop. Five
commuter and two Meet-the-MARC shuttles operate on weekdays to serve outlying communities.
Recent Accomplishments
• Three new electric buses entered service in 2020 and are powered by county-owned solar arrays.
• The new mobile ticketing app Token Transit was implemented in 2019 with new features introduced
like fare capping, and upcoming 2.0 upgrades which will include google maps integration.
• Two new taxi service providers added to the Taxi Access Program to enhance service.
System Characteristics
Vehicle Fleet: 28 Buses, 20 Cutaways, 1 Maintenance Facility
Service Type: Fixed Route
Provider Data
TransIT Annual Operating Costs Annual Ridership
6
Millions
5.7
5
5.2
4.7
4
4.2 4.1
3
2
1 0.69 0.61 0.57 0.57 0.55
0
2015 2016 2017 2018 2019
FY19 Revenue Sources
13% 19% 17% 52%
Directly Generated Local Government State Government Federal Government
Source: National Transit Database: FY15-19
TPB STATE OF PUBLIC TRANSPORTATION | 2020 REPORT I 20CHARLES COUNTY TRANSIT SERVICES - VANGO
Provider Overview
VanGO provides local bus and demand response paratransit services for
over 800,000 trips a year across 16 routes in Charles County and offers
connection service to other local counties including Calvert, St. Mary’s
and Prince George’s.
Recent Accomplishments
• The new Brandywine route was implemented in 2020, connects Waldord to Brandywine Crossing
shopping center and offers connections to TheBus.
• Additional route restructuring was completed in 2020 in Western Charles County which improved
transportation options by providing new timed transfers
• New solar powered & lighted bus shelters were installed.
• 5 new medium duty buses procured, began design and engineering for an 18,000 square foot transit
operations and maintenance facility.
System Characteristics
Vehicle Fleet: 24 Connector Buses, 15 Shuttle Buses, 16 routes, 1 Maintenance Facility
Service Type: Fixed Route
Provider Data
VanGo Annual Operating Costs Annual Ridership
7
Millions
6
6.1
5 5.4
5.0 4.9 5.1
4
3
2
0.87 0.87 0.87 0.75 0.76
1
0
2015 2016 2017 2018 2019
FY19 Revenue Sources
6% 43% 7% 44%
Directly Generated Local Government State Government Federal Government
Source: National Transit Database: FY15-19
TPB STATE OF PUBLIC TRANSPORTATION | 2020 REPORT I 21MONTGOMERY COUNTY RIDE ON
https://www.montgomerycountymd.gov/dot-transit/index.html
Overview
The Montgomery County Division of Transit Services plans, schedules, and
manages the County’s Ride On bus system and its 370 buses, providing over 20
million trips per year. The Ride On system is designed to complement the transit
services of other providers in the region. The county also manages extRA: a popular limited stop
service, Flex: the first on-demand service in the region, and FLASH: a bus rapid transit-like service, and
related transit infrastructure including over 500 bus shelters, 5,000 bus stops, 700 benches and
multiple Park & Ride lots.
Recent Accomplishments
• Ride On expanded their call-n-ride service to allow for the use of taxis for delivery of essential goods
from grocery stores, food banks, and restaurants.
• In May 2020, four electric buses were procured. An additional ten are anticipated in FY21
• The new FLASH BRT service was launched in Fall 2020. The service operates between Burtonsville
Park & Ride Lot and Silver Spring Transit Center.
• Ride On was awarded grants in 2020 for the expansion of a new travel training program, a crowd
sourcing system (ROCSS), and an Accelerating Innovative Mobility Demonstration Grant (AIM).
System Characteristics
Vehicle Fleet: 369 Buses, 85 Routes, 3 Maintenance Facilities
Service Type: Fixed Route
Provider Data
Ride On Annual Operating Costs Annual Ridership
140
Millions
120
$125
$119
100 $112 $109 $113
80
60
40
20 26.0 24.5 23.0 21.6 20.6
0
2015 2016 2017 2018 2019
FY19 Revenue Sources
16% 49% 28% 8%
Directly Generated Local Government State Government Federal Government
Source: National Transit Database: FY15-19
TPB STATE OF PUBLIC TRANSPORTATION | 2020 REPORT I 22PRINCE GEORGE'S COUNTY THE BUS
https://www.princegeorgescountymd.gov/1120/Countys-TheBus
Overview
Prince George’s County’s operates The Bus, a fixed route bus system for the
county with over 100 vehicles and 28 routes that serve over 2.5 million trips
per year. In addition to the 28 routes, The Bus offers “Call-A-Bus” (curb-to-
curb service) and “Call-A-Cab” (discounts cab service when public transit is
unavailable) for seniors and persons with disabilities through a small
network of scheduled routes and participating cab companies. The services
are overseen by the Department of Public Works and Transportation
(DPW&T) leadership team in the Office of Transportation.
Recent Accomplishments
• In Spring 2020, planning staff completed a refresh of TheBus website, including new shapefiles.
• In November 2020, The Bus implemented Saturday service across thirteen routes and PGC Link,
an on-demand micro-transit pilot for the Oxon Hill & Fort Washington Communities.
• In 2020, service frequencies were improved on major routes from sixty minutes to thirty.
• ADA access improvements were completed on over twenty bus stops via phase II of the Bus Stop
Improvement Program (BSIP). Improvements included bus stop / bus shelter standing pad
installations, sidewalk, curb, & gutter repairs and curb cut & bump tile installations.
System Characteristics
Vehicle Fleet: 93 Buses, 28 Routes, 1 Maintenance Facility
Service Type: Fixed Route
Provider Data
The Bus Annual Operating Costs Annual Ridership
35
Millions
30
25 $29
$26 $27 $27 $27
20
15
10
5 3.7 3.2 3.0 2.8 2.6
0
2015 2016 2017 2018 2019
FY19 Revenue Sources
4% 55% 35% 6%
Directly Generated Local Government State Government Federal Government
Source: National Transit Database: FY15-19
TPB STATE OF PUBLIC TRANSPORTATION | 2020 REPORT I 23POTOMAC & RAPPAHANNOCK
TRANSPORTATION COMMISSION
http://omniride.com
Overview
OmniRide is PRTC's commuter and local bus service. OmniRide offers safe, reliable, and flexible
weekday service throughout Prince William County and along the I-95 and I-66 corridors to
destinations including the Mark Center, Pentagon, Crystal City, Rosslyn/Ballston, Tysons Corner,
downtown Washington, D.C., and the Washington Navy Yard. In addition to morning and evening
commuter service, midday service is available on most routes. OmniRide provided close to 2.5 million
trips in FY19 across its commuter and local bus routes and encouraged over 1.5 million vanpool trips
with help from Transportation Demand Management strategies.
Recent Accomplishments
• The OmniRide Western Maintenance Facility was completed in 2020. The maintenance facility will
also include a bus storage yard and administrative offices to support operations starting in 2021.
• The Design-Build contract for the Neabsco/Potomac Commuter Garages project was awarded.
• Eight million dollars in NVTA Regional Revenue was awarded in 2020 to connect the commuter
lots along Routes 1 and 123 via the Annapolis Way Extension project.
• The intersection improvements and 635 feet of linear sidewalk were completed for the Gemini
Way Project, which aims to improve access to the transit options at the Dale City Commuter Lot.
System Characteristics
Vehicle Fleet: 135 Commuter Buses, 49 Buses, 26 Routes, 2 Maintenance Facilities
Service Type: Commuter Service, Local Service in Prince William County
Provider Data
OmniRide Annual Operating Costs Annual Ridership
35
Millions
30 $33
$31 $32 $31
$30
25
20
15
10
5 3.1 2.8 2.6 2.4 2.9
0
2015 2016 2017 2018 2019
FY19 Revenue Sources
26% 14% 41% 18%
Directly Generated Local Government State Government Federal Government
Source: National Transit Database: FY15-19
TPB STATE OF PUBLIC TRANSPORTATION | 2020 REPORT I 24VIRGINIA RAILWAY EXPRESS
https://www.vre.org
Overview
The Virginia Railway Express (VRE) is a joint project of the Northern Virginia
Transportation Commission and the Potomac Rappahannock Transportation
Commission to provide safe, cost effective, accessible, reliable, convenient, and
comfortable commuter-oriented rail passenger service. VRE provides commuter
rail service from the Northern Virginia suburbs to Alexandria, Crystal City and
downtown Washington, D.C., along the I-66 and I-95 corridors
Recent Accomplishments
• In 2020, the advanced design phases began for the following VRE projects: Broad Run Expansion,
Franconia-Springfield Station Improvements, Rolling Road Station Improvements.
• Construction was underway at: Crossroads Yard, Spotsylvania County, VA, and the Life Cycle
Overhaul and Upgrade Facility (LOU).
• The Fleet Management and Transit Development (TDP) were also recently updated.
• The Crystal City Station Improvements Project, which is underway, is scheduled to complete
Preliminary Engineering (PE) and NEPA environmental review phase by Spring 2021.
System Characteristics
Vehicle Fleet: 19 Stations, 20 Locomotives, 100 Passenger Cars, 2 Maintenance Facilities
Service Type: Commuter Rail
Provider data
VRE Annual Operating Costs Annual Ridership
100
Millions
80
$79 $77
$74
60 $70
$66
40
20
4.5 4.4 4.7 4.6 4.4
0
2015 2016 2017 2018 2019
FY19 Revenue Sources
38% 15% 31% 16%
Directly Generated Local Government State Government Federal Government
Source: National Transit Database: FY15-19
TPB STATE OF PUBLIC TRANSPORTATION | 2020 REPORT I 25PART III - OTHER PUBLIC TRANSIT SERVICES - OVERVIEW
WASHINGTON METROPOLITAN FASTRAN
AREA TRANSIT AUTHORITY
(WMATA) METROACCESS Overview
Fastran is a specialized transportation service
Overview for residents of Fairfax County and the Cities of
MetroAccess is a shared ride, door-to-door Fairfax and Falls Church that offers lift-
transportation service for people with equipped, door-to-door service for people
disabilities who are unable to use fixed-route whose disability or special need prevents them
public transit. MetroAccess is the fifth largest from using public transportation to get to
paratransit service in the country, transporting county-sponsored programs and services. All
approximately 2.2 million passengers annually. Fastran riders must be certified by a
Service is provided to locations in Fairfax, sponsoring Human Services agency:
Arlington, Prince George’s, and Montgomery
counties; the District; and the cities of Fairfax, • Critical Medical Care: Transportation
Falls Church, and Alexandria that are located for Fairfax County residents who must
within ¾ mile of a Metrobus or Metrorail line. undergo life sustaining treatments
including dialysis, radiology,
The Abilities-Ride program offers MetroAccess chemotherapy, brain injury therapy,
customers a new, more flexible option for travel physical therapy, and water therapy.
within Maryland. Metro has partnered with Transportation service under this
Regency Taxi and Silver Cab to provide on- program is not guaranteed but is
demand discounted taxi services. provided on a space available basis.
• Adult Day Health Care - Transportation
Recent Accomplishments to and from adult day health care
During 2020 as ridership decreased on centers.
MetroAccess and vehicles were underutilized, • Community Services Board -
Metro partnered with local hospitals and used Transportation to and from support
the surplus MetroAccess vehicles to initiate a services and worksites related to
shuttle service that transports medical intellectual disability, mental health,
professionals to their places of work. and the Recovery Women’s Center.
• Senior Centers - Transportation to and
In concurrence with the WMATA IG from Fairfax County Senior Centers.
MetroAccess Report, WMATA has committed to Service is arranged through centers
continuing to monitor trip length performance only.
to comply with ADA allowable fixed route • Senior Residences - Transportation for
equivalent (FRE) time and identify potential twice-a-month grocery shopping trips
scheduling / routing issues. Additional and a trip to the mall every other
commitments include updating MetroAccess’ month for residents of 18 senior
Performance Report to reflect On-Time Pick-up residence developments. Trips
and including FRE compliance and continuing scheduled by sites.
to provide regular updates to the accessibility • Therapeutic Recreation Services -
advisory committee and members of the Transportation to and from outings
disability community at-large of updates to and structured recreational activities
MetroAccess service improvements. for individuals with intellectual or
physical disabilities.
TPB STATE OF PUBLIC TRANSPORTATION | 2020 REPORT I 26DOT MARYLAND DEPARTMENT OF
DOT is the City of Alexandria’s paratransit TRANSPORTATION AND TRANSIT
service for residents and visitors who cannot ADMINISTRATION (MDOT MTA)
use fixed-route bus or rail services due to their
disability. DOT provides service throughout the Overview
City of Alexandria as well as the City of Falls The Maryland Transit Administration (MTA) is a
Church, Arlington and Fairfax Counties and the division of the Maryland Department of
City of Fairfax. Over 65,000 trips were provided Transportation (MDOT) and one of the largest
by taxi or wheelchair accessible vans in 2019. multi-modal transit systems in the United
States. MDOT MTA operates Local Buses
(CityLink and LocalLink), Commuter Buses, and
STAR
multiple rail services including: Light (RailLink),
Specialized Transit for Arlington Residents
Heavy (SubwayLink), and commuter rail
(STAR) is the paratransit component of
(Maryland Area Regional Commuter (MARC),
Arlington Transit (ART) and provides shared
and a comprehensive Paratransit system
ride paratransit service for Arlington residents
(MobilityLink). MDOT MTA also manages the
who have difficulties using public fixed route
Taxi Access system and directs funding and
transit service either due to age or disability.
statewide assistance to Locally Operated
Transit Systems (LOTS) in each of Maryland's
Recent Accomplishments
23 counties, Baltimore City, Annapolis, and
In September 2020 as a part of Hunger Action
Ocean City. MDOT MTA’s commuter bus
Month, ART partnered with the Arlington Food
(MARC) and rail services operate in portions of
Assistance Center (AFAC) and Giant Foods to
the NCR.
take action against hunger by challenging the
community to “stuff” STAR (Specialized Transit
Ongoing Projects
for Arlington Residents) vans full of non-
MDOT and MTA continue to manage
perishable food items. The “Stuff the Bus”
construction of the Purple Line Light rail project
event donated all the food to AFAC who
which will extend from Bethesda in
distributed it to over 2,200 families who rely on
Montgomery County to New Carrollton in Prince
AFAC for free supplemental groceries.
George’s County. Key contracts and hundreds
of subcontracts have been assumed, while the
PRINCE GEORGE’S COUNTY CALL-A- selection of a new design-build contractor is
BUS still underway. This work is in addition to
Call-A-Bus is the paratransit service provided by ongoing MTA projects, including:
Prince George’s County, providing demand • The Polk Street Maintenance Facility,
response, curb-to-curb bus service throughout • Ken-Gar wetlands restoration,
the County available to all residents who are • Paint Branch stream restoration, and
not served by, or cannot use, existing bus or rail • Washington Suburban Sanitary
services. However, priority is given to seniors Commission’s 66” waterline relocation
and persons with disabilities. Persons with design.
disabilities must provide their own escort, if
needed. Service animals are allowed for the
visually impaired. Reservations can be made MDOT MTA COMMUTER BUS
up to 7 days in advance. In addition to the
County’s Call-a-Bus service, 17 local MDOT MTA Commuter Bus Service is a vital link
municipalities also provide their own Call-a-Bus that connects thousands of Maryland’s
service. Call-A-Bus has 40 vehicles making over suburban residents with jobs in Baltimore and
75,000 trips annually. Washington D.C. Commuter Bus is managed by
TPB STATE OF PUBLIC TRANSPORTATION | 2020 REPORT I 27You can also read