STATE OF RHODE ISLAND DEPARTMENT OF ENVIRONMENTAL MANAGEMENT OFFICE OF AIR RESOURCES - Rhode Island 2021 Annual Monitoring Network Plan
←
→
Page content transcription
If your browser does not render page correctly, please read the page content below
STATE OF RHODE ISLAND DEPARTMENT OF
    ENVIRONMENTAL MANAGEMENT
       OFFICE OF AIR RESOURCES

Rhode Island 2021 Annual Monitoring Network Plan

       DRAFT Posted for Public Review on June 15, 2021
              Submitted to EPA on July 26, 2021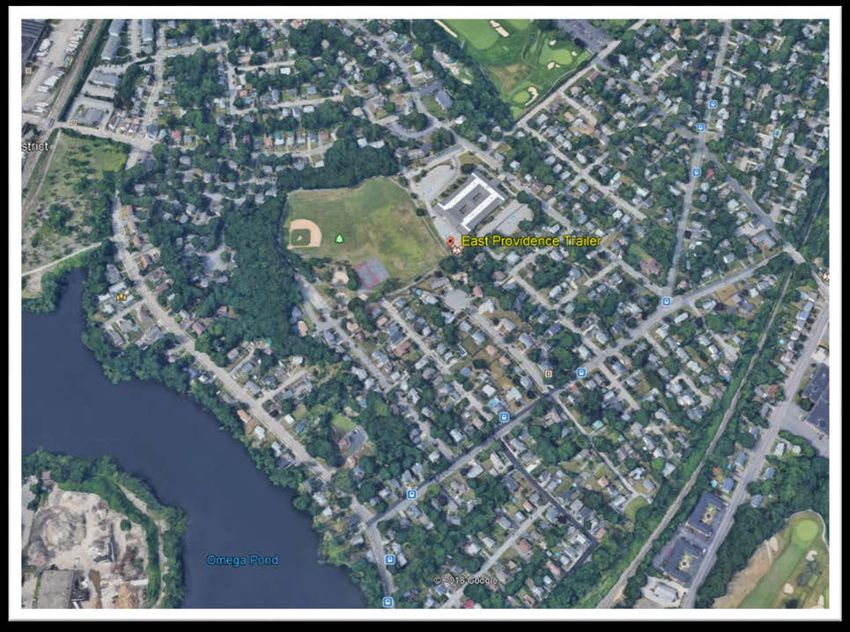
Table of Contents
Acronyms and Abbreviations ................................................................................................. 5
Introduction and Regulatory Background ............................................................................... 6
Port of Providence .......................................................................................................................... 6
Rhode Island Monitoring Network ......................................................................................... 8
Summary of Proposed Changes in the Rhode Island Monitoring Network.................................... 9
Network Evaluation ...................................................................................................................... 15
      Ozone (O3) ............................................................................................................................. 15
      Carbon Monoxide (CO) .......................................................................................................... 18
      Nitrogen Dioxide (NO2) .......................................................................................................... 21
      Fine Particulate Matter (PM2.5)............................................................................................ 24
Speciation Monitoring .................................................................................................................. 28
Lead (Pb) ....................................................................................................................................... 28
Ozone Precursor and Air Toxics Measurements........................................................................... 28
      Photochemical Assessment Monitoring Stations (PAMS) ..................................................... 28
      PAMS Monitoring Implementation Network Plan ................................................................ 28
Enhanced Monitoring Plan Update............................................................................................... 33
Air Toxics ....................................................................................................................................... 33
National Core Multi-Pollutant Monitoring Stations Network ...................................................... 35
Detailed Site Information: ................................................................................................... 35
Near Road Providence – Future Site ............................................................................................. 48
PM 10 Monitoring Sites ................................................................................................................ 57
All Rhode Island Monitoring Sites ................................................................................................. 58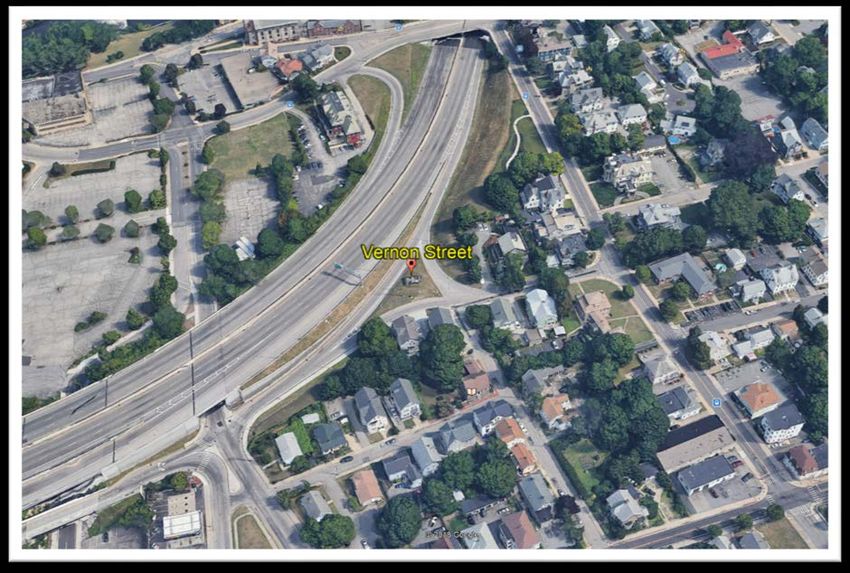
List of Tables
Table 1: National Ambient Air Quality Standards (NAAQS) ..................................................... 10
Table 2: Monitoring Site Information....................................................................................... 12
Table 3: Additional Monitoring Site Information ..................................................................... 13
Table 4: Rhode Island Ozone Monitoring Sites ........................................................................ 15
Table 5: Ozone Design Values (ppb)......................................................................................... 16
Table 6: Carbon Monoxide Monitoring Network ..................................................................... 18
Table 7: Sulfur Dioxide Monitoring Network ........................................................................... 20
Table 8: Nitrogen Dioxide Monitoring Network....................................................................... 21
Table 9: PM10 Monitoring Network .......................................................................................... 23
Table 10: PM2.5 Monitoring Network ..................................................................................... 24
Table 11: Design values for PM2.5 ........................................................................................... 26
Table 12: PAMS Target Compound List .................................................................................. 29
Table 13: Equipment Inventory at East Providence Site ........................................................ 32
Table 14: Myron Francis School – East Providence ................................................................ 36
Table 15: W. Alton Jones Campus – West Greenwich............................................................ 38
Table 16: US EPA Lab - Narragansett ...................................................................................... 40
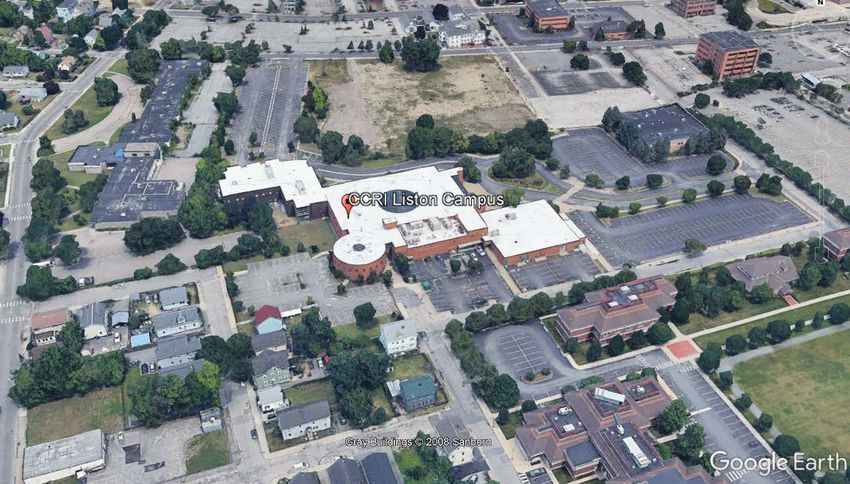
Table 17: CCRI Liston Campus - Providence ........................................................................... 42
Table 18: Vernon St - Pawtucket ............................................................................................ 43
Table 19: Providence – Near -Road ........................................................................................ 43
Table 20: 2015 AADT HPMS DATA .......................................................................................... 48
Table 21: RIDEM State Beach Pavilion - East Matunuck......................................................... 53
Table 22: Continuous Gaseous Monitoring Sites.................................................................... 55
Table 23: PM2.5 Monitoring Sites .......................................................................................... 56
3
List of Figures
Figure   1:    Community Scale Monitoring Locations ................................................................... 7
Figure   2:    Ozone Trends 2001-2020 ........................................................................................ 17
Figure   3:    East Providence Location ........................................................................................ 37
Figure   4:    East Providence Monitoring Trailer ........................................................................ 37
Figure   5:    W. Alton Jones Monitoring Location ...................................................................... 39
Figure   6:    W. Alton Jones Monitoring Site .............................................................................. 39
Figure   7:    Narragansett Monitoring Location ......................................................................... 41
Figure   8:    Narragansett Monitoring Shelter ........................................................................... 41
Figure   9:    Providence- CCRI Monitoring Location ................................................................... 42
Figure   10:   Pawtucket Monitoring Location ............................................................................. 43
Figure   11:   Providence Near-Road Monitoring Location .......................................................... 44
Figure   12:   Providence Near-Road Site ..................................................................................... 45
Figure   13:   Highway Considerations ......................................................................................... 47
Figure   14:   Traffic Count Data ................................................................................................... 49
Figure   15:   Preliminary location of new Near-Road site ........................................................... 51
Figure   16:   Wind Rose Data....................................................................................................... 52
Figure   17:   East Matunuck Site Location................................................................................... 54
Figure   18:   East Matunuck Monitoring Site .............................................................................. 54
Figure   19:   Continuous Gas Monitoring Sites ........................................................................... 55
Figure   20:   PM2.5 Monitoring Sites .......................................................................................... 56
Figure   21:   PM-10 Monitoring locations ................................................................................... 57
Figure   22:   RI Monitoring Network ........................................................................................... 58

                                                                                                                                      4
Acronyms and Abbreviations

AIRS-AQS   Aerometric Information Retrieval System - Air Quality System
AQI        Air Quality Index
BAM        Beta Attenuation Monitor
CAA        Clean Air Act
CFR        Code of Federal Regulations
CO         Carbon Monoxide
DEM        Department of Environmental Management (RI)
DOH        Department of Health (RI)
EIS        Emissions Inventory System
EMP        Enhanced Monitoring Plan
EPA        Environmental Protection Agency
FEM        Federal equivalent method
FRM        Federal reference method
GC         Gas chromatograph
HAPs       Hazardous air pollutants
MADEP      Massachusetts Department of Environmental Protection
MDL        Method detection limit
MSA        Metropolitan statistical area
NAAQS      National Ambient Air Quality Standards
NAMS       National Air Monitoring Station
NATTS      National Air Toxics Trends Station
NCORE      National Core Multi-pollutant Monitoring Station
NO2        Nitrogen dioxide
NOx        Nitrogen oxides
OAQPS      Office of Air Quality Planning and Standards
ORD        Office of Research and Development
OTR        Ozone Transport Region
PAMS       Photochemical Assessment Monitoring Stations
PAH        Polycyclic Aromatic Hydrocarbon
PM10       Particulate matter < 10 microns
PM2.5      Particulate matter < 2.5 microns
QAPP       Quality assurance project plan
O3         Ozone
SIPs       State implementation plans
SLAMS      State and Local Air Monitoring Station
SOP        Standard operating procedure
SO2        Sulfur dioxide
STN        Speciation Trends Network
SVOC       Semi-Volatile Compound
VOC        Volatile Organic Compound

                                                                          5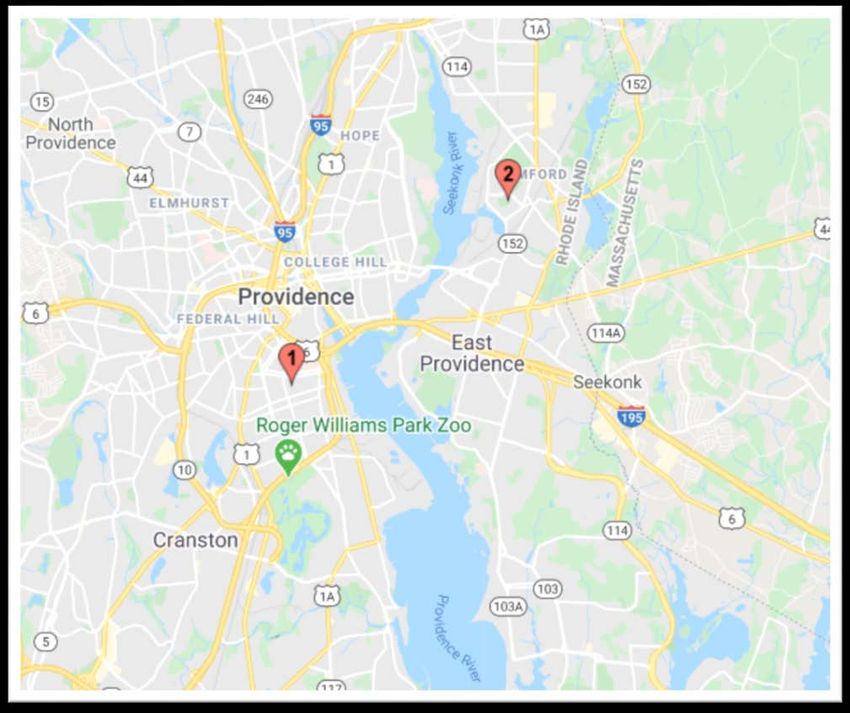
Introduction and Regulatory Background

This document will serve as Rhode Island’s 2021 Annual Monitoring Network Plan, prepared by
the Rhode Island Department of Environmental Management, in accordance with Section 58.10
(a) of Title 40 of the Code of Federal Regulations (40 CFR 58.10(a)), which requires states to
submit a monitoring network plan to the United States Environmental Protection Agency (EPA)
in July of each year. The plan provides a description of the state’s current monitoring network,
demonstrates that the network conforms to EPA requirements, and discusses any plans to
remove or move a monitoring station in the 18 months following the plan submittal. The Annual
Monitoring Network Plan must be posted for public comment 30 days prior to submittal to the
EPA. Note, Rhode Island’s 5- Year Network Assessment was submitted to EPA on July 24, 2020.

Port of Providence
RIDEM submitted a grant application for a 2020 Community-Scale Air Toxics Monitoring Grant
(EPA-OAR-OAQPS-20-05), which was awarded in August 2020 by EPA. The project will
characterize air toxic emissions near the Port of Providence to characterize risk to the most highly
impacted populations, including surrounding environmental justice areas, residences, schools,
and hospitals. Air quality near the Port is impacted by air pollution generated from diesel trucks,
marine vessels, oil and gas storage and distribution, asphalt and cement processing, metals
recycling, natural gas and utility service, and large heating plants. It is important to note that
RIDEM is continuously seeking strategies to evaluate air quality in this Environmental Justice Area,
with this and future studies.
In the 2015, Community Scale Air Toxics Monitoring report, “Evaluation of the Impact of On-Road
Mobile Source Air Toxics on Air Quality at Sensitive Receptors Adjacent to Interstate Route 95 in
the Providence Metropolitan Area,” data indicate that ethylbenzene and xylene levels may be
influenced by emissions from port activities and that emissions from the Port should be further
evaluated 1. This proposed project will satisfy that outcome.
The first phase of this project began by deploying five Clarity Node low cost sensors in Fall 2020
to monitor continuous PM2.5 and NO2. The PM2.5 measurement of the Clarity Nodes correlated
well with RIDEM FEM instruments at the Near Road site (after 30-day collocation and correction
factors), with accuracy greater than R2 > 0.70. The Clarity Nodes also provide screening level NO2
data. These data are not as accurate as the PM2.5, but with assistance from Clarity’s technical
staff, correction factors are also applied to this data set to improve accuracy.
It is anticipated that these data will be collected for a minimum of 1 year. The following locations,
as indicated by the blue push pins are being monitored by Clarity Nodes.

1
    http://www.dem.ri.gov/programs/air/documents/air-mobile95-report.pdf
                                                                                                   6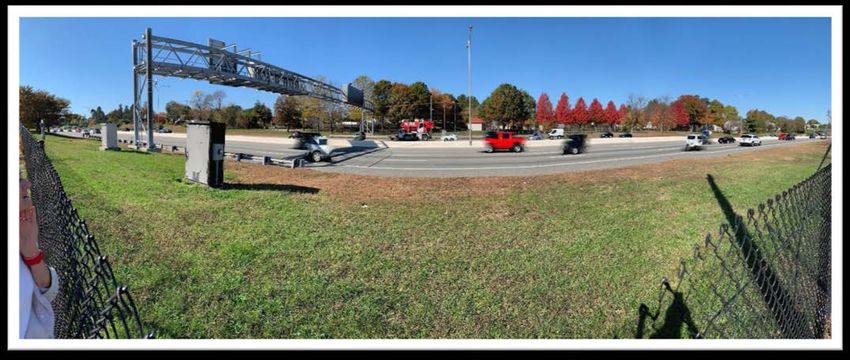
1)   Providence Community Health Center, Eddy Street
   2)   Providence Animal Shelter, Terminal Road
   3)   Private Residence, Washington Avenue, Washington Park
   4)   Suez Pumps Station, Riverside
   5)   Vartan Gregorian Elementary School, Wickenden Street

              Figure 1:     Community Scale Monitoring Locations

The next phase of the study, which began on June 3, 2021 will focus on volatile organic
compounds, benzene and 1,3 butadiene found in diesel exhaust and petroleum products. VOC
samples will be obtained every sixth day on the same schedule and method as PAMs VOC
sampling using Method TO-15A by the Air Pollution Laboratory using an Agilent GC/MS. See
Table 12 for the full listing of targeted compounds.

Additionally, measurement of meteorological parameters began early May 2021 using the
Rainwise MK4-C station to measure temperature, relative humidity, wind speed, wind direction,
dewpoint, barometric pressure, and rainfall. Wind direction and mixing is critical in

                                                                                           7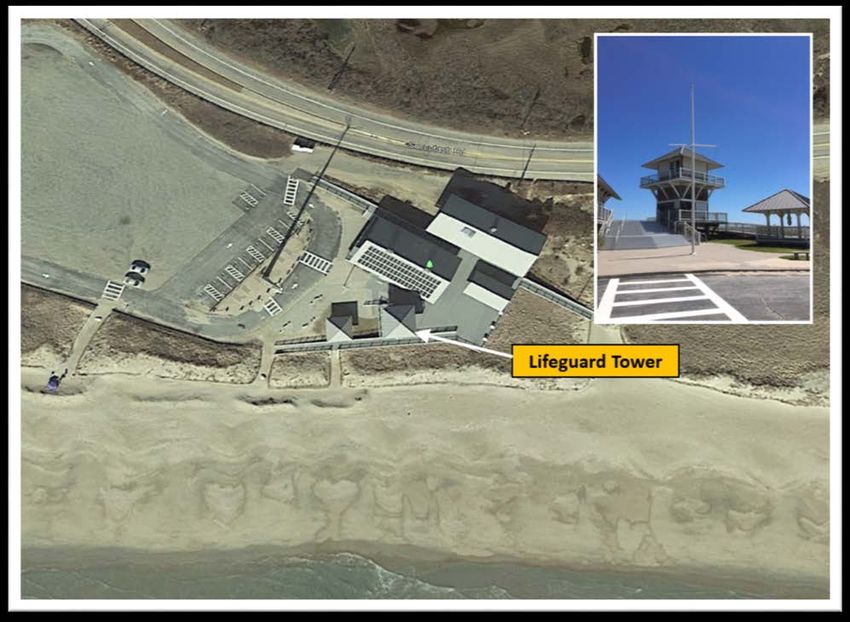
understanding pollution sources. These stations were deployed at Providence Community Health
Center (1), Providence Animal Shelter (2), and the Suez Pump Station (4). The comprehensive
study also includes a survey of all sources in the area for chemical and fuel use and compliance
inspections at all facilities located in the Port area. Following completion of sampling, a full
report will be completed with community outreach, presentations, and sharing of the findings
to all interested parties.

As time and staff allow, some handheld monitoring may also be conducted to monitor for particle
count, black carbon along busy roadways, and possibly targeted VOC grab samples during times
of tanker bulk petroleum offloading or any other air quality event deemed relevant.

Rhode Island Monitoring Network

The Rhode Island Department of Environmental Management (RIDEM), in conjunction with the
Rhode Island Department of Health (RIDOH), operate a network of air monitoring stations to
measure ambient concentrations of pollutants for which the EPA has established a National
Ambient Air Quality Standard (NAAQS). Those pollutants, which are known as criteria pollutants,
include ozone (O3), particulate matter smaller than 10 microns (PM10), particulate matter smaller
than 2.5 microns (PM2.5), nitrogen dioxide (NO2), sulfur dioxide (SO2), carbon monoxide (CO) and
lead. The criteria pollutant monitoring sites are part of the EPA’s State or Local Air Monitoring
Stations network (SLAMS).

In addition, RIDEM and RIDOH monitor ambient levels of toxic air pollutants and ozone
precursors, which are compounds that react in the atmosphere to form ground-level ozone. The
State operates one monitoring site that is part of the National Air Toxics Trends Sites (NATTS)
network, one that is part of the Photochemical Assessment Monitoring Stations (PAMS) network
(East Providence), one that is part of the PM2.5 Speciation Trends Network (STN), and one that is
part of the network of core multipollutant monitoring stations (NCORE).

Table 1 summarizes the NAAQS and Table 3 lists the locations of the six air monitoring stations
that operated in the State in 2020 and operate currently, along with the parameters monitored
and methods. The locations of those sites are shown in Figure 22. These sites have been
approved by EPA Region 1 as meeting applicable siting criteria, as specified in Subpart B of 40
CFR Part 58. All criteria pollutants are monitored, as required in the CFR, using Federal Reference
Methods (FRMs) or Federal Equivalent Methods (FEMs) and monitors are operated according to
the procedures specified in Quality Assurance Project Plans (QAPPs)2 that have been approved
by EPA. Sites are in the Providence-New Bedford-Fall River, RI-MA Metropolitan Statistical Area
(MSA), which encompasses all of Rhode Island as well as Bristol County in Massachusetts.

2
  RI DEM and RI DOH, “QAPP for Criteria Pollutants Including Particulates and NCORE Parameters, Revision 1.0,”
approved by EPA March 2018, revised November 2020 and “QAPP: Air Toxics and PAMS Monitoring Programs,
Revision 6.1,” approved by EPA March 2018, revised November 2020.

                                                                                                            8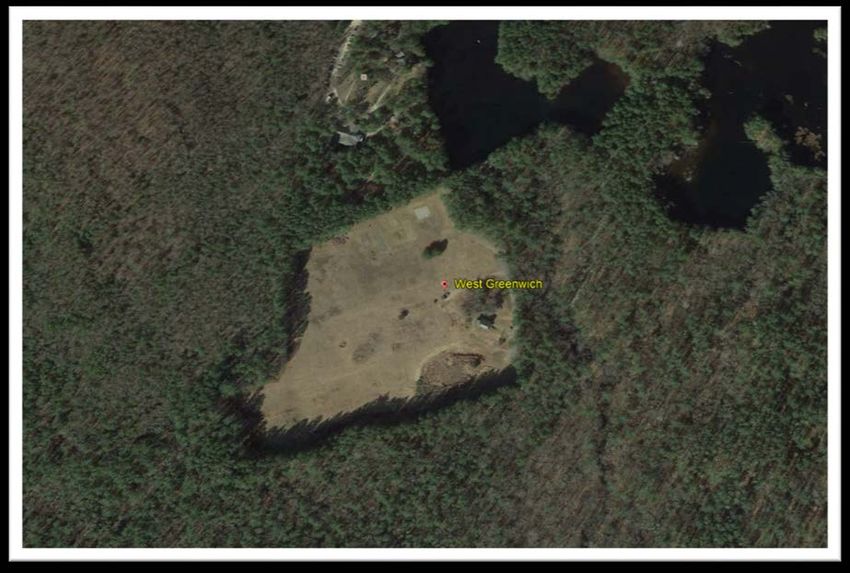
Summary of Proposed Changes in the Rhode Island Monitoring Network

In summary, RI DEM plans to modify the current monitoring network as follows:

   •   Per RIDOT, the highway construction activity on the northbound side of I-95 is tentatively
       expected to begin summer 2021. RIDEM will discontinue monitoring at the current Near-
       Road site at the corner of Park and Hayes Street in Providence and relocate to the
       approved Near-Road monitoring site as soon as possible. Details on the newly approved
       Near-Road location are contained later in this report.

   •   Due to financial hardship, The University of Rhode Island has closed the W. Alton Jones
       Campus (West Greenwich), where a monitoring location resides. RIDOH continues to have
       access to the property with adequate utilities, but RIDEM has established a back-up
       location if the current site is inaccessible. The backup location selected is Arcadia
       Headquarters on 260 Arcadia Road, West Greenwich, 02832.

   •   As part of the EMP, RIDEM has once again deployed a 2B Ozone monitor, on loan from
       EPA, at East Matunuck with the goal of meeting AQS siting criteria. In order to establish a
       stable temperature for the calibrator and citing criteria for the 2B monitor, heat was
       installed in the tower during the week of April 26th, 2021. The analyzer was deployed on
       April 12, 2021.

   •   RIDOH Air Laboratory along with EPA’s Office of Research and Development deployed the
       NASA Pandora platform at the East Providence NCORE site on April 21, 2021. The
       instrument will be measuring ozone, nitrogen dioxide, and formaldehyde.

   •   RIDEM and the University Maryland Baltimore County (UMBC) have established a
       communication protocol to push data from the ceilometer at the East Providence NCORE
       site data to their server, which houses a national network of publicly available ceilometer
       data. A daily visual of ceilometer data from East Providence is available on their website.
       https://alg.umbc.edu/prov-archive-calendar/

RIDEM understands that all network modifications that involve discontinuation or moving of any
sites are subject to EPA approval, even if the remaining network meets EPA’s minimum
requirements.

                                                                                                9
Table 1: National Ambient Air Quality Standards (NAAQS)

POLLUTANT                             AVERAGING TIME         PRIMARY                    SECONDARY STANDARD
 (links to historical tables of                              STANDARD
 NAAQS reviews)

Sulfur Dioxide (SO2)               3-HourA                   None                       0.5 ppm (1300 µg/m³)

                                   1-HourB                   0.075 ppm (75 ppb)         None

                                   8-HourA                   9 ppm                      None
Carbon Monoxide (CO)
                                   1-HourA                   35 ppm                     None

Ozone (O3)                         8-HourC                   0.070 ppm (70 ppb)         Same as Primary Standard

Nitrogen Dioxide (NO2)             Annual        Arithmetic 0.053 ppm (53 ppb)
                                                                                        Same as Primary Standard
                                   Mean

                                   1-HourD                   100 ppb                    None

Particulate Matter (PM10)           24-HourE                 150 µg/m³                  Same as Primary Standard

                                   Annual Arithmetic
                                                             12.0 µg/m³                 15.0 µg/m³
Particulate Matter (PM2.5)         MeanF

                                   24-HourG                  35 µg/m³                   Same as Primary Standard

                                   Rolling 3-Month
Lead (Pb)                                                    0.15 µg/m³                 Same as Primary Standard
                                   Average

     Primary standards protect against adverse health effects.
     Secondary standards protect against welfare effects such as damage to crops, vegetation, and
     buildings.
     A
         Not to be exceeded more than once a year.

     B
      To attain the 1-hour NAAQS, the 3-year average of the 99th percentile of the daily maximum 1-hour average SO2
     level at each monitor must not exceed 75 ppb.

     C
      The ozone NAAQS is violated when the average of the 4th highest daily eight-hour concentration measured in 3
     consecutive years exceeds 0.070 ppm (70 ppb).

                                                                                                                10
D
To attain the 1-hour NO2 NAAQS, the 3-year average of the 98th percentile of the daily maximum 1-hour average
NO2 concentration at each monitor must not exceed 100 ppb.
E
To attain the PM10 standard, the 24-hour concentration at each site must not exceed 150 µg/m³ more than once
per year, on average over 3 years.
F
To attain the PM2.5 annual standard, the 3-year average of the weighted annual means of the 24-hour
concentrations must not exceed the NAAQS value.
G
To attain the PM2.5 24-hour standard, the 3-year average of the 98th percentile of 24-hour concentrations must
not exceed 35 μg/m3.
µg/m³ = micrograms per cubic meter
mg/m³ = milligrams per cubic meter
ppb = parts per billion
ppm = parts per million
11Site
CCRI
EPA Labs
East Prov.
Near Road
Alton Jones
East Matunuck
X
PM2.5 (FRM), 1:3
X = Existing
Vernon Street X X
PM2.5 (FRM, Collocated),1:6
X
X
X
X
PM2.5 (Continuous - FEM)
* Includes metals
*
X X
PM10/PM- (Hi Vol), 1:6
X X
**
PM10/PM- (Hi Vol), Collocated), 1:6
X
PM10/PM-Coarse(lo-Vol), 1:3
X
Polycyclic aromatic hydrocarbons (PAH), 1:6
X
S= Seasonal (June 1-August 31)
Speciation, PM2.5, SASS (CSN), 1:3
** Includes collocated metals 1:12
PM2.5 Carbon (URG) (CSN),1:3
S
S
S
S= Seasonal (March 1 – September 30)
Ozone
SO2
Table 2: Monitoring Site Information
X
CO
Direct NO2
X
NO/NO2/NOx
NO/NOy
X
X
X
VOCs 24-HR Canister (NATTS, State)
VOCs Hourly PAMS
X
X
Black Carbon
Black Carbon, Collocated
X
Carbonyls, 1:6, Collocated 1:12
Carbonyls, PAMS 8-hr
X
Particle Counter
X
X X
X
Wind Speed and Direction
Ceilometer
X
Temperature
Dew Point / Rel. Humidity
X X X
Barometric Pressure
12
The ambient air monitoring sites currently operated by RIDEM and RIDOH are listed in the Table
3 below. Detailed information for each monitoring site is provided in a later section of this plan.
X S X S
Solar Radiation
UV Radiation
X X X X X X X X S X X X S S X X X X X S S S
PrecipitationTable 3: Additional Monitoring Site Information
Site AQS ID Latitude Parameter Method Of EPA Method
Longitude Measured Sampling Designation
Vernon 440070026 41.874683o PM2.5 Lo Vol Reference
Vernon Street VOC Canisters, GC/FID/MS Reference
Pawtucket -71.379936o
USEPA Laboratory 440090007 41.495060o Ozone U.V. Photometric Reference
27 Tarzwell Drive PM2.5 Beta Attenuation/Cont Equivalent
Narragansett -71.423713o Wind Speed Anemometer N/A
Wind Direction Wind Vane N/A
Temperature Spot Reading N/A
Myron Francis 440071010 41.840954o Oxides of Nitrogen Chemiluminescence Reference
School Nitrogen Dioxide (low range)
64 Bourne Avenue -71.360976o NO/NOy Chemiluminescence Reference
E. Providence (low range)
Carbon Monoxide Gas Filter Correlation Equivalent
(low range)
Sulfur dioxide Pulsed Fluorescence Equivalent
(low range)
Ozone U.V. Photometric Reference
PM2.5 Lo Vol Reference
PM2.5 Beta Attenuation/Cont Equivalent
Speciated PM2.5 Speciation Monitor N/A
Coarse PM (PM10-2.5) Lo Vols (PM10 & PM2.5) Reference
Black Carbon Aethalometer N/A
VOC Canisters, GC/FID/MS Reference
VOC Continuous GC Reference
Carbonyls HPLC Cartridges Reference
Wind Speed Anemometer N/A
Wind Direction Wind Vane N/A
Barometric Pressure Barometer N/A
Temperature Spot Reading N/A
Relative Humidity Plastic Film N/A
Solar Radiation Pyranometric N/A
UV Radiation UV Photometric N/A
Precipitation Bucket/Continuous N/A
Direct NO2 Cavity Attenuated Phase Equivalent
Shift (CAPS)
Ceilometer LIDAR N/A
13Site AQS ID Latitude Parameter Method Of EPA Method
Longitude Measured Sampling Designation
CCRI Liston Campus 440070022 41.807523o PM2.5 Beta Attenuation/Cont Equivalent
1 Hilton Street PM10/Metals Hi Vol Reference
Providence -71.413920o VOC Canisters, GC/FID/MS Reference
Carbonyls HPLC Cartridges Reference
Black Carbon Aethalometer N/A
Semi-volatiles PUF/XAD, GC/MS N/A
Wind Speed Anemometer N/A
Wind Direction Wind Vane N/A
Temperature Spot Reading N/A
Relative Humidity Plastic Film N/A
Particle Count Water Based N/A
Condensation
Alton Jones Campus 440030002 41.615316o Ozone U.V. Photometric Reference
Victory Highway VOC Canisters, GC/FID/MS Reference
West Greenwich -71.720032o PM2.5 Beta Attenuation/Cont Equivalent
Wind Speed Anemometer N/A
Wind Direction Wind Vane N/A
Barometric Pressure Barometer N/A
Temperature Spot Reading N/A
Relative Humidity Plastic Film N/A
Solar Radiation Pyranometric N/A
Near-Road Site 440070030 41.829523o Oxides of Nitrogen Chemiluminescence Reference
Hayes and Park Nitrogen Dioxide (low range)
Streets -71.417584o Carbon Monoxide Gas Filter Correlation Equivalent
Providence (low range)
PM2.5 Beta Attenuation/Cont Equivalent
Black Carbon Aethalometer N/A
Particle Count Water Based N/A
Condensation
East Matunuck State 440090008 41.377451o Ozone U.V. Photometric Equivalent
Beach Pavilion
950 Succotash Road -71.52485o
South Kingstown
14Network Evaluation
Following is a discussion, by pollutant, of:
• The current monitoring network,
• The NAAQS and a comparison of recent measurements with the NAAQS,
• Whether that network meets EPA’s monitoring criteria,
• Whether new sites are needed,
• Whether any existing sites are no longer needed, and
• Plans for modification of the network in the next 18 months.
Ozone (O3)
The sites in the current ozone monitoring network are listed in Table 4 and shown on Figure 19
which includes all gaseous monitors.
SITE MEASUREMENT MONITORING OBJECTIVE SCHEDULE
SCALE
Alton Jones Regional Upwind background Continuous
Campus Population exposure Ozone Season
Victory Highway March-September
West Greenwich
USEPA Regional Population exposure Continuous
Laboratory Ozone Season
27 Tarzwell Drive March-September
Narragansett
Myron Francis Neighborhood Maximum precursor Continuous
School (PAMS, NCORE) emissions impact Year-Round
64 Bourne Population exposure
Avenue
E. Providence
East Matunuck Regional Upwind background Continuous
State Beach Population exposure Ozone Season
Pavillion Coastal and Long Island March-September
950 Succotash Sound
Road, South
Kingstown
Table 4: Rhode Island Ozone Monitoring Sites
The ozone NAAQS is 70 ppb over an 8-hour average. A site is in violation of that NAAQS when the
average of the 4th highest daily eight-hour ozone concentration measured in 3 consecutive years
(the design value) at that site exceeds 70 ppb.
15Ozone design values for Rhode Island sites have generally decreased over time, but values have
fluctuated both slightly above and slightly below the 2015 NAAQS of 70 ppb. Based on the 2014-
2016 design values, all counties in Rhode Island have been classified as Attainment/Unclassifiable
for the 2015 standard. However, Rhode Island’s 2015-2017 design values have increased slightly for
all three monitors. The 2018 design values show an increase for both West Greenwich and East
Providence, with a decrease in design value for the Narragansett monitor. The final 2019 design
values did not change for East Providence and Narragansett but dropped 2 ppb for West Greenwich.
The design values for 2018-2020 dropped from the previous years. In 2018, Rhode Island monitors
experienced 12 exceedances, with only 2 exceedances in 2019, and 4 in 2020. There were some
evidence that local and regional emissions (NOx and PM2.5) were down due to reduced traffic and
other economic restrictions early in the 2020 COVID lockdowns. However, ozone exceedances are
strongly influenced regionally by weather patterns, and other influences such as fire smoke, so
attributing a slower ozone season due to COVID restrictions is especially difficult.
2020 design values……
W. Greenwich Narragansett E. Providence
2002 - 2004 87 90 84
2003 - 2005 84 89 82
2004 - 2006 83 85 81
2005 - 2007 86 84 84
2006 - 2008 80 81 82
2007 - 2009 77 77 77
2008 - 2010 71 76 72
2009 - 2011 73 73 71
2010 - 2012 74 78 75
2011 - 2013 74 78 76
2012 - 2014 70 74 73
2013 - 2015 70 73 70
2014- 2016 70 70 68
2015- 2017 72 71 70
2016- 2018 73 69 73
2017- 2019 71 69 73
2018-2020 67 68 69
Table 5: Ozone Design Values (ppb)
Note, 2020 was the first year RIDEM attempted to produce AQS level data at East Matunuck. Data
capture was achieved at 81%, and the 4th highest value was 67 ppb.
16Figure 2: Ozone Trends 2001-2020
Since EPA’s rules require Rhode Island to operate at least two ozone monitors, the State has two
more monitors than the minimum number required. Continued operation of all existing monitors is
important for the following reasons:
• Ozone concentrations continue to reach unhealthy levels several days each summer, with
moderate levels on many days.
• The four sites represent three distinct geographical and micro-climates that are affected by
different localized weather patterns and can experience very different ozone levels on some
days.
• The availability of real-time ozone data from the four ozone sites enables RIDEM to issue
area-specific health advisories as appropriate and to provide residents with real-time
information about ozone concentrations and associated health risks in their region of the
state.
• The East Matunuck site may provide critical information on transport of ozone along Long
Island Sound corridor and the immediate coastline.
As part of RIDEM’s EMP, additional ozone monitoring will again be conducted during 2021 as
described in the EMP section of this plan. There are no changes planned in the next 18 months.
17Refer to the Enhanced Monitoring portion of this document regarding possible future plans of the
East Matunuck monitor.
Carbon Monoxide (CO)
The current CO monitoring network is listed in Table 6 and shown on Figure 19.
Table 6: Carbon Monoxide Monitoring Network
SITE MEASUREMENT MONITORING OBJECTIVE SCHEDULE
SCALE
Myron Francis Neighborhood Maximum precursor Continuous
School emissions impact Year-Round
64 Bourne Population exposure
Avenue
E. Providence
Near-Road Site Microscale Maximum emissions Continuous
Hayes and Park Near-road Year-Round
Streets
Providence
The NAAQS for CO are:
• 35 ppm as a 1-hour average, not to be exceeded more than once per year (design value
is the highest annual 2nd maximum 1-hour concentration) and
• 9 ppm as an 8-hour average, not to be exceeded more than once per year (design value is
the highest annual 2nd maximum non-overlapping 8-hour concentration)
The CO design values for Rhode Island are:
Near Road 2019:
• 2.3 ppm – 1-hour average, 6.3 % of NAAQS
• 1.7 ppm – 8-hour average, 18.9 % of NAAQS
Near Road 2020:
• 2.3 ppm – 1-hour average, % of NAAQS
• 1.8 ppm – 8-hour average, % of NAAQS
East Providence 2019:
• 1.6 ppm – 1-hour average, 4.5% % of NAAQS
• 0.8 ppm – 8-hour average, 8.9 % of NAAQS
East Providence 2020:
• 1.6 ppm – 1-hour average, % % of NAAQS
18• 1.0 ppm – 8-hour average, % of NAAQS
The CO NAAQS has not been exceeded in Rhode Island since 1984. Since 2001, all CO levels recorded
in Rhode Island have been in the “Good” category of the EPA’s Air Quality Index (AQI).
EPA’s regulations do not specify a minimum number of CO monitors that must be operated in a
state, except that CO monitoring is required at NCORE sites (40 CFR 58, Appendix D 3(b)) and EPA
regulations require a certain number of CO monitors to be operating near road based upon
population. Since the East Providence site is both a PAMS site and the State’s NCORE site, carbon
monoxide monitoring will continue at that site using a low range monitor, consistent with NCORE
requirements.
Near-road sites are required in all urban areas which, like the Providence-New Bedford-Fall River,
RI-MA MSA, have a population of 1,000,000 or more. Near-road CO monitoring was not required
until January 1, 2017; however, Rhode Island began operating a low-range CO monitor at a site
adjacent to Interstate Route 95 that meets the above near-road specifications in April 2014.
The Near Road location is expected to be moved during the summer 2021, per later details in this
report. No other changes to the CO monitoring network are planned in the next 18 months.
19Sulfur Dioxide (SO2)
The current SO2 monitoring network is listed in in Table 7 and shown on Figure 22.
Table 7: Sulfur Dioxide Monitoring Network
SITE MEASUREMENT MONITORING SCHEDULE
SCALE OBJECTIVE
Myron Francis Neighborhood NCORE Continuous
School Year-Round
64 Bourne Avenue
E. Providence
The NAAQS for SO2 are:
• 75 ppb, 1-hour average. The design value is the average of the 99th percentile maximum
daily hour measured in 3 consecutive years.
• 0.5 ppm (500 ppb), 3-hour average (secondary standard) not to be exceeded more than once
per year.
The 2019 SO2 design values (2017 – 2019) in Rhode Island are:
• 3 ppb -- 1-hour average 4 % of primary NAAQS – East Providence monitor
The SO2 design value (2018 – 2020) in Rhode Island is as follows:
• 2 ppb -- 1-hour average 3 % of primary NAAQS – East Providence monitor
The SO2 NAAQS has never been exceeded in the State. One-hour design values for SO2 have been
below 75 ppb since 1994. All measurements have been in the “Good” range of the AQI since 2007.
EPA’s 2006 amended monitoring regulation requires SO2 monitoring only at NCORE sites.
However, the 2010 SO2 NAAQS rule requires at least one SO2 monitor in the Providence-New
Bedford-Fall River RI, MA MSA, which includes all of Rhode Island and Bristol County, Massachusetts.
That SO2 monitor must be sited to meet one or more of the following objectives: (1)
characterizing concentrations around emissions sources, (2) measuring the highest
concentrations in an area, (3) determining population exposure, (4) establishing general
background levels and (5) evaluating regional transport.
The State of Massachusetts operates a SO2 monitor in the Providence Warwick RI-MA MSA, in
Fall River. Additionally, East Providence is positioned to represent the maximum concentrations
in the MSA, as it is located downwind of the City of Providence.
20Nitrogen Dioxide (NO2)
The current NO2 monitoring network is listed in Table 8 and shown on Figure 22.:
Table 8: Nitrogen Dioxide Monitoring Network
SITE MEASUREMENT SCALE MONITORING SCHEDULE
OBJECTIVE
Myron Francis School Neighborhood (PAMS) Population exposure Continuous
64 Bourne Avenue Year-Round
E. Providence True NO2 during
PAMS season only
Near-Road Site Microscale Maximum emissions Continuous
Hayes and Park Streets Near-road Year-Round
Providence
The NO2 NAAQS are:
• 100 ppb – 1-hour average. The design value is the average of the 98th percentile maximum
daily hour measured in 3 consecutive years.
• 0.053 ppm (53 ppb) - annual average
The design values for 2017-2019 are:
• 50 ppb – 1-hour average, 50 % of NAAQS - Near Road
• 39 ppb – 1-hour average, 39 % of NAAQS - East Providence
The annual averages for 2019 are:
• 17 ppb annual average, 32 % of NAAQS – Near Road
• 7 ppb annual average, 13 % of NAAQS – East Providence
The design values for 2018-2020 are:
• 49 ppb – 1-hour average, 49 % of NAAQS – Near Road
• 39 ppb – 1-hour average, 39 % - East Providence
The annual averages for 2020 are:
• 15 ppb annual average, 28 % of NAAQS – Near Road
• 6 ppb annual average, 11 % of NAAQS – East Providence
21The NO2 NAAQS have never been exceeded in Rhode Island. Since there was no short-term NAAQS
for NO2 until the standard was amended in 2010, this pollutant was not used for the Air Quality
Index (AQI) before that date. The amended NO2 NAAQS rule, which was published on February 9,
2010, establishes hourly concentrations of 54 -100 ppb as the range for a “Moderate” AQI3.
The 2010 amended NO2 NAAQS requires Rhode Island to operate two NO2 monitoring sites, one at
“a location of expected highest NO2 concentrations representing the neighborhood or larger spatial
scales” and a second monitor at a near-road location where maximum microscale-representative
concentrations are expected.
The East Providence location fulfills the neighborhood monitoring scale for NO2 and operates year-
round to fulfill the neighborhood or larger spatial scale requirements. To fulfill PAMS requirements,
Direct/True NO2 is monitored at East Providence June 1 to August 31. A low range monitor that
measures NO and NOy (total reactive nitrogen oxides) has been operated at the East Providence site
since January 2011, consistent with the NCORE requirements.
In April 2014, RIDEM began operating a near-road site on the east side of the Interstate Route 95
near downtown Providence, monitoring for NO2/NOx, CO, PM2.5 and black carbon to characterize
those pollutants from the highway, downwind of the climatological prevailing wind direction.
Construction of the northbound highway and bridge, next to where the monitoring shelter is
located, is estimated to begin sometime summer in 2021. The site is expected to be moved prior,
during late summer 2021 to the new location as outlined in this report.
Particles smaller than 10 microns (PM10)
The current PM10 monitoring network is listed in Table 9 and shown in Figure 21:
3
USEPA, “Primary National Ambient Air Quality Standards for Nitrogen Dioxide: Final Rule, “FR 75(26):6474, 9 February
2010. http://www.epa.gov/ttn/naaqs/standards/nox/fr/20100209.pdf
22Table 9: PM10 Monitoring Network
SITE MEASUREMENT MONITORING SCHEDULE
SCALE OBJECTIVE
CCRI Liston Campus Neighborhood Population exposure 24-hour
1 Hilton Street (NATTS) Highest concentration 1 in 6 day
Providence Co-located 1 in 6
day
Myron Francis School Neighborhood Population exposure 24-hour
64 Bourne Avenue (NCORE) (Lead discontinued 1 in 3 (PM 10-2.5)
E. Providence 6/30/16) and PM10-2.5)
The PM10 NAAQS is:
• 150 µg/m3 – 24-hour average, not to be exceeded more than once per year on average
over 3 years (design value is 4th high value in a 3-year period)
The highest 24-hour average value for PM10 recorded at a Rhode Island site for the past 3 years is:
2018 79 µg/m3 – 24-hour average, 53 % of NAAQS, recorded at Vernon St.
2019 41 µg/m3 – 24-hour average, 27 % of NAAQS, recorded at Vernon St.
2020 33 µg/m3 – 24-hour average, 22 % of NAAQS, recorded at East Providence.
The PM10 NAAQS has never been exceeded in Rhode Island. Since PM10 is measured using a filter-
based method, results are not immediately available and cannot be used for Air Quality Index
calculations. Levels tend to be highest at the Vernon Street site, which is adjacent to I-95, and higher
than the Providence and East Providence sites. PM10 levels appear to have slightly decreased over
the past decade.
PM10 is measured at the East Providence NCORE site once every three days using a lo-vol sampler.
The PM10 measurements are used, in conjunction with PM2.5 measurements at that site, for
calculating PM10-2.5 levels.
EPA’s monitoring regulations require areas like the Providence-New Bedford-Fall River, RI-MA
Metropolitan Statistical Area (MSA), which has a population greater than 1,000,000 and measured
PM10 concentrations below 80% of the NAAQS, to operate a minimum of 2 - 4 PM10 monitoring sites.
As discussed, PM10 measurements at the East Providence site are used for calculating PM10-2.5
levels and, since this measurement is required at NCORE sites, PM10 sampling cannot be
discontinued at that site. Similarly, PM10 samples collected at CCRI Providence are analyzed for
metals to fulfill NATTS requirements, so PM10 sampling at that location cannot be discontinued.
The Vernon St., Pawtucket site, adjacent to I-95, characterizes the highest PM10 concentrations
in the RI. Although Vernon experiences the highest PM10 values, at no point has the site
23approached the standard. As RIDEM continually seeks options for cost and workload savings,
RIDEM discontinued PM10 monitoring at Vernon Street at the end of 2019. The two remaining
PM10 monitors will adequately characterize exposure of the sensitive populations in urban areas
to PM10 and fulfill the minimum monitoring requirement of the MSA.
Fine Particulate Matter (PM2.5)
The current Federal Reference Method/Federal Equivalent Method (FRM/FEM) PM2.5
monitoring network is listed in Table 10 and shown on Figure 20:
Table 10: PM2.5 Monitoring Network
SITE MEASUREMENT MONITORING SCHEDULE
SCALE OBJECTIVE
Vernon Trailer Middle Population exposure 24-hour, 1 in 3 day FRM
Vernon Street Co –located FRM
Pawtucket
CCRI Liston Campus Neighborhood Population exposure 24-hour, daily
1 Hilton Street Highest Continuous FEM
Providence concentration
Myron Francis School Urban Population exposure 24-hour, daily
64 Bourne Avenue Highest Continuous FEM
E. Providence concentration 1 in 3 day
FRM
Alton Jones Campus Regional Population exposure Continuous FEM
Victory Highway General/Background
West Greenwich Regional Transport
USEPA Laboratory Regional Population exposure Continuous FEM
27 Tarzwell Drive
Narragansett
Near Road Site
Corner of Hayes and Microscale Near-road Continuous FEM
Park
Providence
A filter based FRM (Method 145) PM2.5 unit is the primary sampler at the Vernon site. FEM
(Method 170) continuous PM2.5 monitors are used as the primary samplers at West Greenwich,
Narragansett, East Providence, CCRI, and the Near-Road site in Providence. Co-located filter
based FRM samplers are operated at the Vernon and East Providence sites for quality assurance
purposes (Method 145).
24The PM2.5 NAAQS are:
• 35 µg/m3 - 24-hour average (design value is the 3-year average of the 98th percentile 24-
hour concentration)
• 12 µg/m3 - annual average (design value is calculated by averaging the daily concentrations
from each quarter, averaging these quarterly averages to obtain an annual average, and
then averaging the annual averages for three consecutive years)
The highest PM2.5 values for 2019 are:
• 28 µg/m3 – 24-hour average, 80 % of NAAQS, recorded at Near Road.
• 8.5 µg/m3 – annual average, 71 % of NAAQS, recorded at Near Road.
The highest PM2.5 values for 2020 are:
• 31.3 µg/m3 – 24-hour average, 89 % of NAAQS, recorded at East Providence.
• 8.3 µg/m3 – annual average, 69 % of NAAQS, recorded at Near Road.
25Table 11: Design values for PM2.5
** Design values are for the monitors formerly located at Urban League
SITE 24 hour 24 hour 24 hour Annual Annual Annual
DV DV DV DV DV DV
2016- 2017- 2018- 2016- 2017- 2018-
2018 2019 2020 2018 2019 2020
Vernon
Vernon Street 16 15 16 6.7 6.4 7.0
Pawtucket
CCRI Liston
Campus** 16 16 16 6.3 5.9 6.0
1 Hilton Street
Providence
Myron Francis
School 17 16 17 6.7 6.3 6.3
64 Bourne
Avenue
E. Providence
Alton Jones
Victory Highway 14 13 13 5.0 4.9 4.9
West Greenwich
USEPA
Laboratory 15 14 14 5.1 4.8 4.5
27 Tarzwell Drive
Narragansett
Near Road Site
Hayes and Park 19 18 19 8.8 8.5 8.5
Streets
Providence
26Historically, annual average levels have been consistently highest at the Vernon Street site, which is
adjacent to I-95, and higher at the East Providence and Urban League sites than at the rural West
Greenwich site. PM2.5 levels have slowly decreased over the past decade. The 2017-2020 design
values of PM2.5 data at Near Road are the highest in the monitoring network.
EPA regulations require a minimum of two PM2.5 Rhode Island monitoring sites to characterize the
following:
• Community-wide air quality
• Background PM2.5 levels in the RI
• Regional transport of PM2.5
Although Rhode Island operates more PM2.5 sites than required, each site fulfills a specific
informational need or EPA requirement. The West Greenwich site fulfills EPA’s requirements for
measurement of background and regional transport concentrations of PM2.5 into the state. The 24-
hour and annual PM2.5 design values for the Vernon Street, Pawtucket site, which is immediately
adjacent to Interstate Rte. 95, tend to be higher than those at the other sites besides Near Road.
The East Providence monitor cannot be removed because PM2.5 monitoring is required at NCORE
sites, and the Urban League (now CCRI) and Narragansett monitors fulfill the need for air quality
data for urban and coastal areas of the State, respectively.
As discussed above, Near Road PM2.5 monitoring began in April 2014 and will continue until such
time that the site is no longer available, due to scheduled construction of the 95N viaduct. As
discussed previously it is anticipated that the Near Road site will be relocated to a new EPA approved
site in summer 2021. RIDEM relocated the Urban League monitor to the Community College of
Rhode Island, Liston Campus in June 2019. Since CCRI cannot accommodate all the equipment
from the Urban League site, the filter based FRM PM2.5 from that location was moved to Vernon
Street for co-locating with the existing FRM on April 1, 2017.
RIDEM has assigned the FEM PM2.5 monitor at East Providence to be the primary monitor and
uses the FEM and FRM data from that site to evaluate FEM-FRM comparability. The advantages
of using the East Providence, rather than the West Greenwich site for this purpose include:
• PM2.5 levels at the East. Providence site, although still substantially below the NAAQS,
tend to be higher than those at the West Greenwich site.
• Since the East Providence FRM runs 1 in 3 days, it generates more comparative data than
West Greenwich.
Historical data has demonstrated that the East Providence FEM and FRM measurements have
better correlation and less bias than is observed at the W. Greenwich site.
27There are no other changes to the PM2.5 network anticipated in the next 18 months.
Speciation Monitoring
The EPA’s PM2.5 Speciation Trends Network (STN) is designed to characterize metal, ion and carbon
constituents of PM2.5. Per NCORE requirements, the speciation equipment, including the carbon
sampler, has been in operation at the East Providence NCORE site in January 2011 and is now
being operated there on a 1-in-3 schedule. Speciation filters are analyzed by an EPA contractor.
Lead (Pb)
As specified in the lead NAAQS rule, sampling of lead was previously conducted on a one-in-six-
day schedule. EPA deleted the requirement to monitor for non-source Pb at NCORE sites from
Appendix D of 40 CFR part 58.16 and to allow monitoring agencies to request permission to
discontinue non-source monitoring following the collection of at least 3 years of data at urban
NCORE sites. Since ambient lead monitoring was conducted in the State for more than 3 years
and the lead levels were consistently considerably lower than the NAAQS since the inception of
monitoring, RI DEM was granted permission to discontinue monitoring as of June 30, 2016.
Ozone Precursor and Air Toxics Measurements
Photochemical Assessment Monitoring Stations (PAMS)
The Clean Air Act Amendments of 1990 (CAAA) required serious, severe and extreme ozone
nonattainment areas to establish enhanced monitoring networks to measure ozone and ozone
precursors. In response to that mandate, the US EPA promulgated rules in 1993 that required the
establishment of a network of Photochemical Assessment Monitoring Stations (PAMS) to measure
ozone, NOx, volatile organic compounds (VOCs), carbonyls, and meteorological parameters in
serious and above nonattainment areas. This network was designed to provide comprehensive data
on trends in ambient concentrations of ozone and ozone precursors and to evaluate the spatial and
diurnal variability of those pollutants to track the formation and transport of ozone across large
areas and to evaluate the effectiveness of strategies implemented to reduce levels of that pollutant.
PAMS Monitoring Implementation Network Plan
RIDEM operated two Photochemical Assessment Monitoring Stations (PAMS) sites in the air
monitoring network in 2017, at the West Greenwich and East Providence sites. West Greenwich
is no longer designated a PAMS site. The NCORE site located at Francis School in East Providence
continues to serve as the location of the required PAMS site and will measure the following
parameters described below. An inventory of equipment used at the site is provided in Table 13.
28The following PAMs pollutant were monitored during the 2020 PAMs season and will continue
during the 2021 PAMs season:
• The NCORE site located at Francis School in East Providence serves as the PAMS site and will
measure parameters described below.
• 24-hour speciated VOC samples are collected every sixth day year-round at the Alton Jones
and East Providence site. As of June, July and August of 2017, VOC samples were collected
hourly at East Providence using an Auto-GC. Hourly VOC sampling will again continue June-
August for 2021 at East Providence. A complete list of the targeted compounds is found in
Table 12. For 2021, hourly speciated VOC measurements continue to be measured with an
auto-gas chromatograph (GC) using Chromatotec GC 866 Airmo VOC.
• 24-hour carbonyl samples are collected every sixth day year-round at the East Providence site
using an ATEC 8000 Sampler. Three 8-hour carbonyl samples per day are collected every
third day during June, July and August for 2020. A complete list of the target carbonyl
compounds may be found in Table 12. The TO-11A test method is used, as in the National
Air Toxics Trends (NATTS) 4 program.
• Rhode Island has measured reactive nitrogen oxides (NO and NOy) at East Providence since
January 2011 to fulfill NCORE requirements. New EPA regulations required NO, NOy, true NO2
and mixing height measurements at required PAMS sites during the ozone season. True NO2
and mixing heights began in 2019 and will continue for 2021. True NO2 is measured by cavity
attenuated phase shift (CAPS) spectroscopy with a Teledyne API T500U. NO and NOy are
measured using a Thermo 42iY.
• Ozone is measured at the West Greenwich, Narragansett, and East Matunuck sites March
through September beginning in 2017. Ozone is measured year-round at East Providence to
fulfill NCORE requirements.
• Surface meteorological parameters are measured at West Greenwich, Narragansett, and East
Providence year-round.
• RIDEM continues to measure wind direction, wind speed, temperature, humidity,
atmospheric pressure, precipitation, solar radiation, and ultraviolet radiation. For measuring
mixing height, a Vaisala CL51 ceilometer was purchased in August 2018 and was installed at
East Providence in 2019.
Table 12: PAMS Target Compound List
4
See NATTS Technical Assistance Document for TO-11A method
29Priority Chemical AQS Compoun Optional Chemical AQS Compound
Parameters Paramet d Class Parameters Paramete Class
(Required) er Code r Code
1,2,3- 1,3,5-
45225 aromatic 45207 aromatic
trimethylbenzene trimethylbenzene
1,2,4-
45208 aromatic 1-pentene 43224 olefin
trimethylbenzene
2,2-
1-butene 43280 olefin 43244 paraffin
dimethylbutane
2,2,4- 2,3,4-
43250 paraffin 43252 paraffin
trimethylpentane trimethylpentane
2,3-
Acetaldehyde 43503 carbonyl 43284 paraffin
dimethylbutane
2,3-
Benzene 45201 aromatic 43291 paraffin
dimethylpentane
2,4-
cis-2-butene 43217 olefin 43247 paraffin
dimethylpentane
Ethane 43202 paraffin 2-methylheptane 43960 paraffin
Ethylbenzene 45203 aromatic 2-methylhexane 43263 paraffin
Ethylene 43203 olefin 2-methylpentane 43285 paraffin
Formaldehyde 43502 carbonyl 3-methylheptane 43253 paraffin
Isobutane 43214 paraffin 3-methylhexane 43249 paraffin
Isopentane 43221 paraffin 3-methylpentane 43230 paraffin
Isoprene 43243 olefin Acetone 43551 carbonyl
m&p-xylenes 45109 aromatic Acetylene 43206 alkyne
m-ethyltoluene 45212 aromatic cis-2-pentene 43227 olefin
n-butane 43212 paraffin Cyclohexane 43248 paraffin
n-hexane 43231 paraffin cyclopentane 43242 paraffin
n-pentane 43220 paraffin isopropylbenzene 45210 aromatic
30Priority Chemical AQS Compoun Optional Chemical AQS Compound
Parameters Paramet d Class Parameters Paramete Class
(Required) er Code r Code
o-ethyltoluene 45211 aromatic m-diethlybenzene 45218 aromatic
o-xylene 45204 aromatic methylcyclohexane 43261 paraffin
Methylcyclopentan
p-ethyltoluene 45213 aromatic 43262 paraffin
e
Propane 43204 paraffin n-decane 43238 paraffin
Propylene 43205 olefin n-heptane 43232 paraffin
Styrene 45220 aromatic n-nonane 43235 paraffin
Toluene 45202 aromatic n-octane 43233 paraffin
trans-2-butene 43216 olefin n-propylbenzene 45209 aromatic
criteria
Ozone 44201 n-undecane 43954 paraffin
pollutant
criteria
true NO2 42602 p-diethylbenzene 45219 aromatic
pollutant
total trans-2-pentene 43226 olefin
total non-
VOCs,
methane organic 43102 monoterpen
non- α-pinene 43256
carbon e olefin
methane
monoterpen
β-pinene 43257
e olefin
1,3 butadiene 43218 olefin
benzaldehyde 45501 carbonyl
carbon
43804 halogenated
tetrachloride
Ethanol 43302 alcohol
Tetrachloroethylen
43817 halogenated
e
31Table 13: Equipment Inventory at East Providence Site
NAME Manufacturer Model
Black Carbon-Aethalometer Teldyne M633
Black Carbon-Aethalometer Magee AE16-ER
Carbonyl sampler Atec 2200
Carbonyl sampler Atec 2200
Wind direction sensor MetOne 590S (6929)
Pure air generator Aadco 737-R-12A
Chemiluminescence
NO-NO2-NOx Analyzer Thermo 42ITL
Sulphur Dioxide analyzer Thermo 43ITLE
Caron Monoxide analyzer Thermo TE48i
Data logger Agilaire 8832
Hydrogen generator Packard H2PD-150NA
Translator module MetOne 126
Translator module MetOne 2270
Barometric pressure sensor MetOne 091
Rain sensor MetOne 370-8"
Relative Humidity/temp sensor MetOne 083D-1-35
Met Station Tower MetOne
Ultraviolet radiation sensor EPLAB TUVR
Wind Speed sensor MetOne 014A
Solar Radiation pyranometer sensor LI-COR LI-200SZ
Chemiluminescence NO-DIF-NOy Analyzer Thermo TE42iY
Ozone analyzer Thermo TE49i
PM2.5 Sampler MetOne 1020
PM2.5 Speciation MetOne SASS
PM2.5 Partisol-Plus R&P 2025
PM2.5 Partisol-Plus R&P 2025
Standard Calibrator, API M700E
Standard Calibrator Environics 6103
Standard-Zero Air Teledyne 701
VOC sampler Xontech 910A
VOC sampler Xontech 910A
Compac II AC units Marvair
Compac II AC units Marvair
GC custom Agilent 7890A
Mass Spec Agilent 5973N
Auto GC Chromatotec 866
Ceilometer Vaisala CL51
Carbonyl Sampler Atec 8000
True NO2 Teledyne API T500U
32Enhanced Monitoring Plan Update
RIDEM has developed an Enhanced Monitoring Plan (EMP) for implementing additional
applicable PAMS requirements. Full details on the siting for the initial EMP can be reviewed in
the 2018 ANP.
Because of the immediate coastal location of the East Matunuck monitor, RIDEM feels this
position may uniquely capture ozone plumes migrating over water along Long Island Sound
coming ashore. These measurements will enhance the existing network of Rhode Island ozone
monitors to complement transport movement into the state from inland, and now, the
immediate coastline.
During the 2018 and 2019 PAMs seasons, the ozone analyzer did not meet EPA siting criteria and
the data did not meet EPA AQS criteria. For the 2020 season, RIDEM attempted to have the 2B
Analyzer meet regulatory grade monitoring by tracking operating temperature, performing
required calibration checks, and having established proper inlet configuration outside the
lifeguard tower. However, cooler spring temperatures in the unheated building made calibration
checks difficult due to instability of the calibrator. Baseboard heating was installed in April of
2021, with hopes this stabilizes the temperature of the tower.
RIDEM has considered that the coastal stretch of Westerly, Rhode Island may possibly experience
very high ozone, which is often hinted in daily air quality models. Specifically, the stretch of
Misquamicut lies further south than East Matunuck, and further west, often closest to the higher
ozone readings in Coastal Connecticut. After capturing 3 years of data and a Design Value for
East Matunuck, RIDEM may explore the logistics of moving the 2B monitor from East Matunuck
to Misquamicut.
Air Toxics
Rhode Island operates one site that is part of the National Air Toxics Trends Stations (NATTS)
network. The primary purposes of the NATTS network are to track trends in ambient air toxics
levels, to characterize exposures, and to measure progress toward emission and risk reduction
goals.
The Rhode Island NATTS site was previously located on the roof of the Urban League building in
an urban residential neighborhood on the south side of Providence, approximately ½ mile west
of I-95. This site was chosen as the State’s NATTS site because it is not dominated by local sources
and because levels of air toxics at this site appear to be representative of those in urban areas in
the State.
In early July 2019 relocation to the CCRI Liston Campus was completed. This new location is
approximately 315 feet (0.06 miles) to the south and east Urban League.
33You can also read