STATE OF SMALL BUSINESS BRITAIN REPORT 2018 - Enterprise Research Centre
←
→
Page content transcription
If your browser does not render page correctly, please read the page content below

STATE OF SMALL
BUSINESS BRITAIN
REPORT 2018

www.enterpriseresearch.ac.uk


Table of Contents
Part A: SME trends and recent research                                               5

  1. Overview                                                                        6

  2 SME Challenges and opportunities                                                 8

  3 Benchmarking local growth                                                        9

  4 Micro-business Britain                                                           11

  5. Research round-up                                                               13

Part B: Micro-business Britain                                                       16

Micro-business Britain - Executive Summary                                           17

  1. Introduction                                                                    19

  2. Understanding the UK’s micro-businesses                                         20

  3. A story of ambition – for the individual, for the business                      23

  4. Innovation – investments and outcomes                                           25

  5. Adoption of digital technologies                                                29

            5.1 Adoption                                                             29

            5.2 Trends in Digital Technology Adoption                                32

            5.3 Perceived Advantages and Disadvantages of Using Digital Technology   33

  6. Pathways to productivity                                                        34

  7. Next steps                                                                      35

  Annex 1: The Micro-businesses Britain Survey                                       37

            A1.1 Introduction                                                        37

            A1.2 Sampling                                                            37

            A1.3 Fieldwork                                                           37

            A1.4 Weighting                                                           38
Table of Contents
Part C: Benchmarking Local Growth                           40

  UK Local Growth Dashboard                                 41
  1 Introduction                                            41

          1.1 Data Sources                                  41

  2 Growth Metrics                                          42

          2.1 Growth of Start-ups – Initial Scaling         43

          2.2 Growth of Existing Businesses - Stepping Up   44

          2.3 High-Growth Firms                             45

          2.4 Small High-Growth Firms                       46

          2.5 Productivity Growth                           47

  3 Conclusion                                              49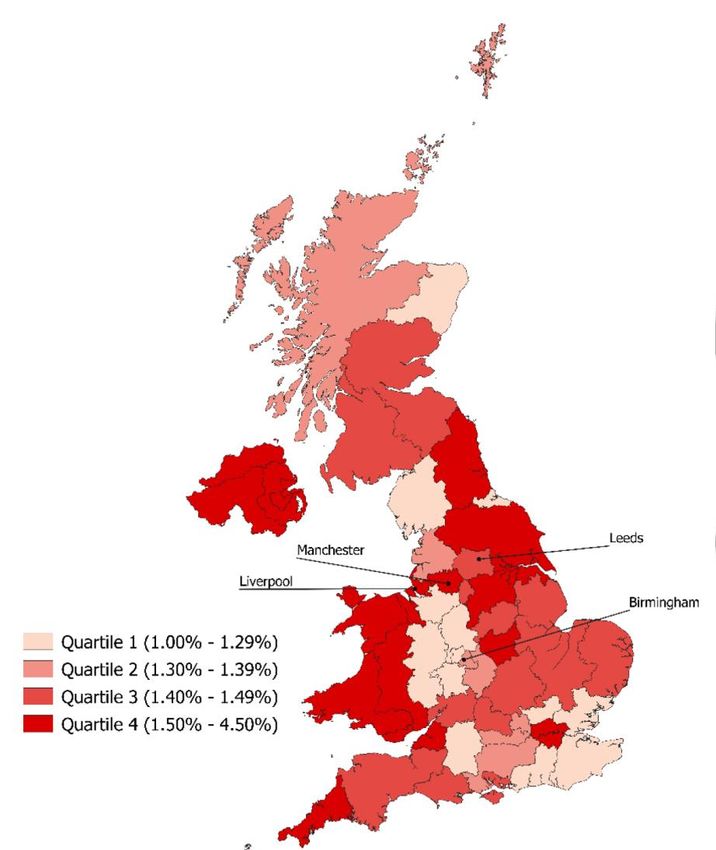
The State of Small Business Britain

 Part A: SME trends and recent research
           Stephen Roper and Mark Hart

                                          5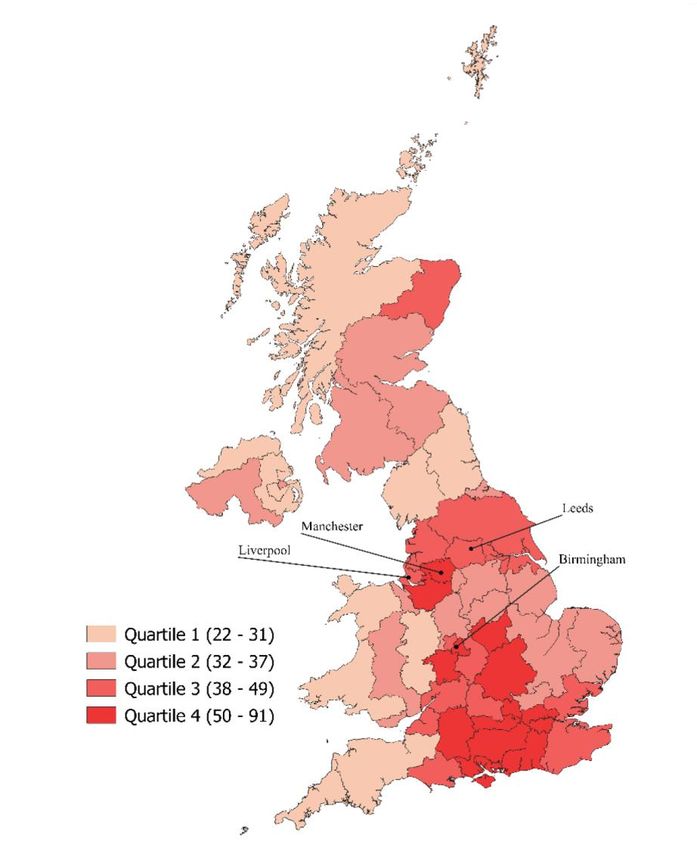
SME Trends and recent research
        1. Overview

        The most recent survey evidence suggests that the profile of growth achieved by the UK’s SME population has
        remained broadly stable since 2015. In 2017, 36 per cent of SME employers reported turnover growth in the
        Longitudinal Small Business Survey (LSBS), with 19 per cent of firms reporting a fall 1 . These proportions were
        broadly similar to those in 2015 and 2016. Expectations of growth also remain broadly stable, with 47 per cent of
        LSBS respondents expecting turnover to increase during 2018. Evidence from the same survey also provides some
        welcome news about SME exporting with the proportion of exporting firms rising 2pp between 2016 and 2017.

        Looking at data from the longitudinal Business Structure Database (itself based on VAT and PAYE data) can
        provide a long-term picture of the proportion of high-growth firms (HGFs) in the UK. A high-growth firm is here
        defined using the standard OECD definition: more than 10 employees, three years old and has achieved average
        growth of either sales or employment of 20 per cent pa for the last three years 2 . In 2017 there were around 11,000
        such firms in the UK, accounting for around 6 per cent of the eligible population of SMEs. Figures were broadly
        similar to those in 2016 (Figure 1.1). We also know that this small group of high-growth firms, whether start-ups
        scaling or more established businesses growing rapidly for the first or second time, continue to have had a
        disproportionate impact on job creation. While we continue to measure and report this OECD metric we will see
        later in this report that a single-minded preoccupation with HGFs may not be a sensible focus for policy-makers.
        Not only are these measures somewhat artificially defined, they also have the disadvantage of rendering invisible the
        reality of growth for the majority of businesses.

        Figure 1.1: Trend in high-growth firms in the UK: Number and rate (1998-2017)

          18                                                                                                                                                                               10
          16                                                                                                                                                                               9
          14                                                                                                                                                                               8
                                                                                                                                                                                           7
          12
                                                                                                                                                                                           6
          10
                                                                                                                                                                                           5
            8
                                                                                                                                                                                           4
            6
                                                                                                                                                                                           3
            4                                                                                                                                                                              2
            2                                                                                                                                                                              1
            0                                                                                                                                                                              0
                                                                  2003/06
                1998/01

                          1999/02

                                    2000/03

                                              2001/04

                                                        2002/05

                                                                             2004/07

                                                                                       2005/08

                                                                                                 2006/09

                                                                                                           2007/10

                                                                                                                     2008/11

                                                                                                                               2009/12

                                                                                                                                         2010/13

                                                                                                                                                   2011/14

                                                                                                                                                             2012/15

                                                                                                                                                                       2013/16

                                                                                                                                                                                 2014/17

                                                                            Number of HGFs                           HGF Rate

                                          Source: ERC analysis of the Business Structure Database (BSD)

1 See https://assets.publishing.service.gov.uk/government/uploads/system/uploads/attachment_data/file/710553/LSBS_2017_cross-
sectional_SME_Employer_report.pdf.
2 This has now been revised to a threshold of 10% growth per annum for a three year period.
                                                                                                                                                                                                6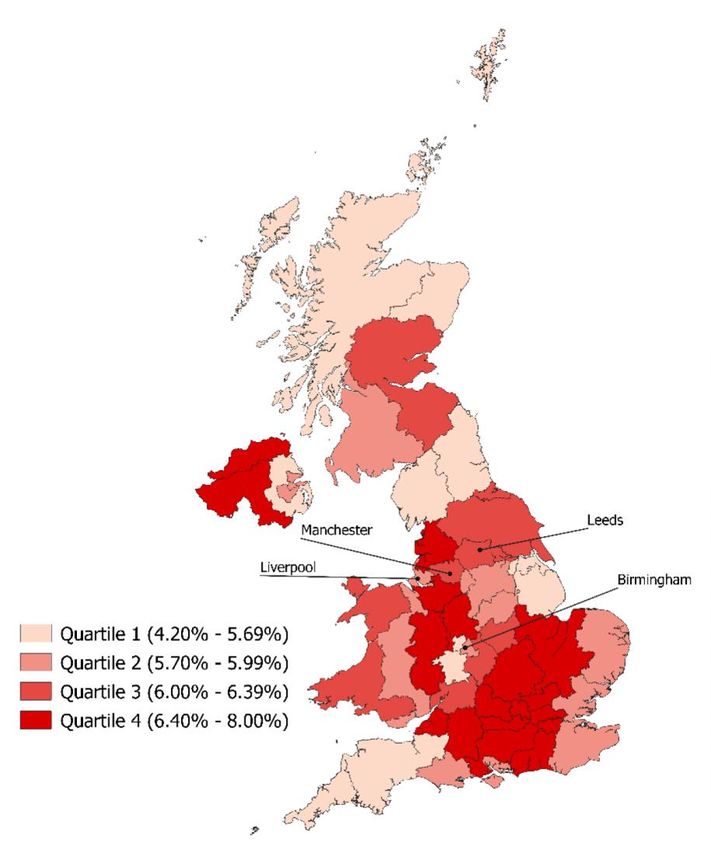
In terms of early-stage enterprise, data from the Global Entrepreneurship Monitor (GEM) indicated that in 2017
     (the most recent data available) the proportion of the adult population in the UK engaged in early-stage enterprise
     (the GEM Total Early-Stage Entrepreneurial Activity or TEA rate) was 8.7 per cent. This was markedly higher
     than the long run rate of around 6 per cent observed before 2010, notably higher than France or Germany, but
     lower than the US. The GEM UK report, in association with the Royal Bank of Scotland, will be published in July
     2018.

     The LSBS suggests some underlying concerns, however, about future levels of ambition and SMEs’ willingness to
     borrow and invest for future growth. In the 2017 survey, 62 per cent of SME employers indicated that they planned
     to growth the turnover of their business over the next three years, the lowest figure since the survey began in
     2007/8. At the same time SME’s willingness to seek external finance has also fallen consistently since 2010.

     SMEs’ willingness to invest has also softened. In 2017, the LSBS suggests that 49 per cent of SME employers had
     arranged or funded training in the previous year. This was a fall of 6 percentage points on 2016 and the lowest level
     since 2010. There is also consistent evidence of some retrenchment in terms of other intangible investment and
     innovation activity among SMEs. The LSBS has identified a fall in levels of product and service innovation activity
     among SMEs since 2015. This pattern is supported by data from the UK Innovation Survey 2017, published in May
     this year, which suggested that the proportion of ‘innovation active’ SMEs fell from 53 per cent in 2012-14 to 49 per
     cent in 2014-16. Over the same period the proportions of firms investing in aspects of their innovation activity also
     fell: computer software (27% to 19%), computer hardware (24% to 13%), new marketing methods (12% to 4%) and
     launch advertising (8% to 3%).

     Trends in start-up, growth and retrenchment all play an important role in shaping job creation in both gross and
     net terms and together form a measure of business dynamism in the economy. The number of start-ups in an
     economy is often seen as the headline metric of ‘enterprise’ and ‘entrepreneurial ability’. Start-ups have been rising
     steadily in the UK in recent years but seems to have stagnated in 2017. Many start-ups fail within a few years, so
     start-ups contribute to both job creation and job destruction. A small subset of start-ups, however, grow quickly,
     and contribute disproportionally to net job growth and to improvements in industry productivity.

     Workers also move among firms at tremendous rates which means that gross job creation and destruction are much
     larger than net job creation. As workers reallocate, it is argued that productivity increases, knowledge diffuses, and
     the structure of production changes. There is a standard methodology to undertake this analysis of job reallocation
     rates which we have just completed for the UK (Figure 1.2). Based on ERC analysis of the Business Structure
     Database (BSD) net job creation rose slightly from 2016 to 2017 due to a reduction in job losses in contractions and
     a slight rise in jobs created in new firms.

     We can see that there was very little variation in these rates of job creation and destruction over the period –
     summing all the components together we arrive at the job reallocation rate which at 22% in 2017 is only slightly
     lower than what it was 20 years ago due to the strong rise in start-up rates. This contrasts with the US where
     there is growing evidence that business dynamism and entrepreneurial activity are declining as over the last 30
     years the number of start-ups and the scale of job reallocation rates have been in decline.3

3Goldschlag, N and Tabarrok, A (2018) “Is regulation to blame for the decline in American entrepreneurship”, Economic Policy, 33 Issue 93
pp 5-44.
                                                                                                                                            7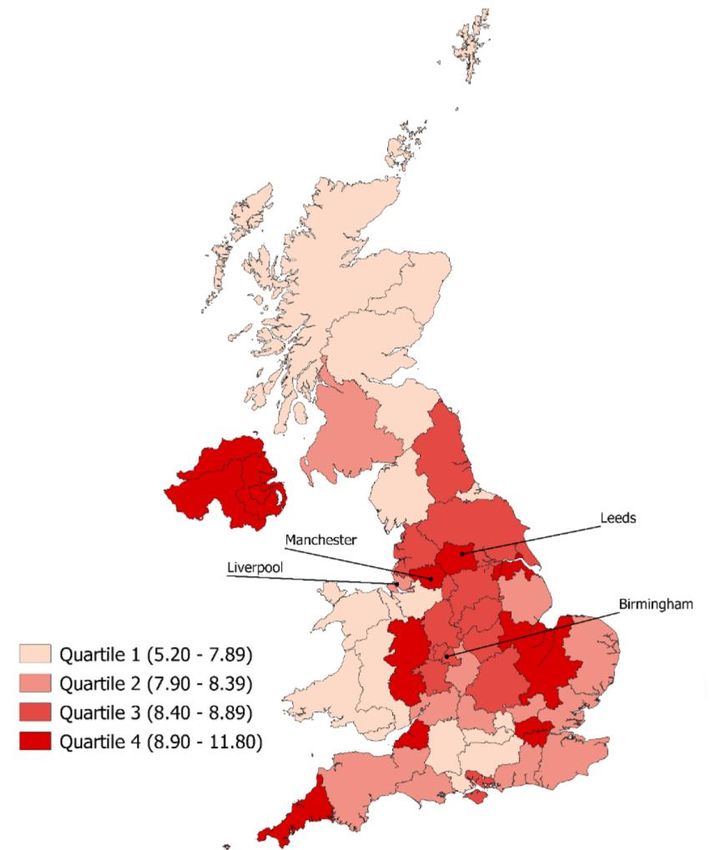
Figure 1.2: Job creation and destruction by component, 1998-2017

  15

  10

   5

   0

  -5

 -10

 -15
       1998

              1999

                     2000

                            2001

                                     2002

                                            2003

                                                   2004

                                                          2005

                                                                 2006

                                                                        2007

                                                                               2008

                                                                                      2009

                                                                                             2010

                                                                                                    2011

                                                                                                           2012

                                                                                                                  2013

                                                                                                                         2014

                                                                                                                                2015

                                                                                                                                       2016

                                                                                                                                              2017
                        net change                  start-up              expansion                 exit           contraction
                                   Source: ERC analysis of the Business Structure Database (BSD)

2 SME Challenges and opportunities

Brexit dominates current public debate and will impact on some SMEs. LSBS data (collected in 2017 Q4) suggests
that 54 per cent of SMEs thought Brexit would have no impact on their business with 27 per cent anticipating a
detrimental effect and 8 per cent a positive benefit. (The other 11 per cent of SMEs were uncertain). Perhaps more
telling in the long-term, however, will be the impact of Brexit uncertainty on investments which might drive future
growth. The LSBS again suggests that 28 per cent of firms intending to increase export sales had scaled down this
activity due to Brexit. Similarly, 10 per cent of SMEs had scaled back plans to develop new products/services and 9
per cent had reduced capital and R&D spend. Conversely, 1-4 per cent of firms were scaling up export activity,
innovation etc. in response to Brexit.

Aside from Brexit, more perennial concerns remain important with competition, red tape and regulation most
commonly cited by SMEs as obstacles to their success (Figure 2.1). Notably over the last two years only around 1:6
SMEs have seen access to finance as a particular issue. Among those firms which did cite Brexit as an obstacle to the
success of their business uncertainty about regulatory changes (81 per cent), future access to EU markets (63 per
cent) and potential increases in input costs (56 per cent) were the dominant issues.

                                                                                                                                                     8
Figure 2.1: Proportion of SME employers citing each major obstacle to success

                                                                                                                                51%
               Competition in the market                                                                                  47%

                                                                                                                         46%
                     Regulations/red tape                                                                          42%

                                                                                                                  41%
       Taxation, VAT, PAYE, NI, rates                                                                      36%

                                                                                                            37%
              Staff recruitment and skills                                                     30%

                                                                                                     33%
                               Late payment                                                    30%
                                                                                                                                            2017
                                                                                         27%
                     UK exit from the EU                                           21%                                                      2016
                                                                                21%
                      Workplace pensions                                       20%

                                                                               20%
                    National Living Wage                                     18%

                                                                           18%
            Availability/cose of premises                                 17%

                                                                             18%
                          Obtaining finance                            15%

                                                0%       10%      20%     30%      40%                                   50%          60%
                                              Source: LSBS 2017, SME Employers Report, p. 24.

     3 Benchmarking local growth

     The ERC UK Local Growth Dashboard has been published annually since 2014. Its purpose is to present a set of
     growth metrics for start-ups and existing firms across a range of subnational geographies in the UK with a specific
     focus on each of the 38 English Local Enterprise Partnership (LEP) areas. Due to the lags in the ONS datasets we
     use these metrics all refer to data in 2016 and do not yet reflect any effect of the Brexit uncertainty. They do,
     however, provide a crucial set of baseline metrics against which to monitor any such effects going forward.

     The growth metrics which are used in the Dashboard are:
             • 3-year survival rates of start-ups (2014-17)
             • Proportion of 2014 start-ups that reach £1m+ T/O (2014-17)
             • Proportion of £1-2m T/O businesses born before 2013 which grow to £3m+ T/O (2014-17)
             • High-Growth Firm (OECD Definition) Incidence Rate (2014-17) – using both the traditional 20%
             threshold and the revised 10% threshold
             • Small High-Growth Incidence Rate 4 (2014-17) – a metric adopting a methodology advocated to avoid
             the exclusion of firms with less than 10 employees from the OECD definition
             • Productivity Growth metric (2014-17) – a new metric this year looking at firms who growth both in
             terms of jobs and revenues but have a faster rate of growth in revenues

4 However, the US Bureau of Labor Statistics (BLS) has argued that the OECD measure was too narrow and were concerned with the
exclusion of firms with less than ten employees in the first year of the three year growth period. The BLS alternative measure extended
the definition of a high-growth firm to include firms with less than ten employees if the firm added eight or more employees during the three
year growth period. Here we refer to these as Small High Growth Firms (SHGFs). The ‘eight or more’ figure in the BLS definition was arrived
 at by multiplying the lower threshold of the OECD measure, ten employees, by the compound growth ratio, 1.728: if a firm with less than
10 employees added eight jobs, it would have contributed about the same amount to job creation as would a firm with ten jobs which grew
by a factor of 1.728 and therefore satisfied the OECD criterion [Clayton, Sadeghi, Spletzer and Talan, “High-employment-growth firms:
defining and counting them”, Monthly Labor Review, June 2013].
                                                                                                                                                   9
The new productivity metric reveals that only 8.4% of all employer enterprises in the UK achieved positive
     productivity gains (revenue per employee) while still increasing jobs over the period 2014-17. We devised this
     metric as a result of our previous research which showed that there was a very poor correlation between jobs
     growth, increases in revenues and productivity gains. Indeed, we found that only 5% of the OECD’s high-growth
     firms (employment definition) recorded productivity growth in the period 2008-2015.5

     Perhaps surprisingly, Northern Ireland had the highest proportion in the UK at 11% while the proportion in Wales
     and Scotland was 7.4% for both home nations which was below the average of 8.5% for England (Figure 3.1).
     Across the English LEPs the pattern is complex with the West of England, the North (Leeds City Region and
     Greater Manchester) and London having the highest proportions of firms with productivity growth measured in
     this way. Only Greater Cambridgeshire and Greater Peterborough LEP in the ‘south’ had above average
     proportions of firms with productivity growth. Indeed, many of the LEPs in the south of England (Bucks; Swindon
     and Wiltshire; Thames Valley Berkshire and Enterprise M3 had below average proportion of these firms.

     Alongside productivity, the other Dashboard growth metrics we present later in this report will also show that
     there are a minority of firms engaged in growth whether it be increasing jobs or revenues. Critically, we can now
     see that there are many areas of the UK where, irrespective of the growth metric used, there has been a persistent
     absence of firms that grow rapidly. This is a matter of some concern as the next 12 months provide some acute
     economic challenges for the UK’s small business leaders to negotiate.

5British Business Bank (2018) “Small Business Finance Markets Report”, February 2018.
https://www.britishbusiness-bank.co.uk/research/small-business-finance-markets-report-2018/
                                                                                                                          10
Figure 3.1: Proportion of job-creating firms with positive productivity growth 2014-17 (where turnover and
employment both increased but turnover grew at a faster rate)
Source: ERC analysis of the Business Structure Database (BSD)
4 Micro-business Britain
In later sections of this report we provide an overview of the Micro-business Britain project focussing on ambition,
innovation and digital adoption among micro-businesses. In 2017 there were 1.11m micro-businesses (with 1-9
employees) in the UK, employing around 4.09m people (17.6 per cent of the workforce). This group of firms
accounted for £552bn in sales, 14.7 per cent of that by all UK firms.
The picture that emerges is that most micro-businesses are mature, and many are homebased. They are closely
related to the families which own and run them, and that in most cases the founder is still involved. Reflecting the
wider LSBS results, growth in sales has been modest for most firms over the last year. Nearly two-thirds of micro-
businesses rely solely on internal funding, with around a third using external funding sources.
Previous studies have strongly linked owner-managers’ growth ambition to the subsequent growth and performance
of the firm. In the Micro-business Britain survey, we use a new set of ambition questions which reflect individuals’
aspirations for their own future and for the future of their business. Notable contrasts are evident in terms of
ambition with 73.7 per cent of all respondents aiming to ‘keep their business similar to how it operates now’, and a
more ambitious 22.1 per cent of respondents aim to build a ‘national or international business’. Little difference is
evident between male and female business owners (Figure 4.1). Individuals’ personal ambitions suggest a rather
different set of priorities, with a marked emphasis on ‘freedom’ and ‘flexibility’
11Figure 4.1: Business objectives: By gender of business owner
72.1%
76.6%
To keep my business similar to how it operates now
52.8%
54.6%
To create a culture of employee engagment
46.1%
50.1%
To increase the social and environmental benefits of the business
29.7%
32.8%
To grow my business rapidly and profitably with the view to exit
21.5%
25.6%
To develp more professional HR practices in the business
23.5%
19.6%
To build national/or international business
0.0% 10.0% 20.0% 30.0% 40.0% 50.0% 60.0% 70.0% 80.0% 90.0%
Male Female
Source: Micro-business Britain Survey, 2018.
While gender differences in levels of ambition are relatively small we see larger regional differences in the
proportions of micro-business owners aiming to grow their business. In terms of this metric London stands out with
35.9 per cent of business owners aiming to achieve national and/or international recognition. Levels of growth
ambition among micro-businesses are markedly lower in other regions
One novel aspect of the Micro-business Britain survey is the focus on digital adoption. This has increased sharply in
recent years (Figure 4.2) with web-based accounting software and cloud computing used by more than 40 per cent of
micro-businesses. E-Commerce is used by 30 per cent of firms, with 25 and 18 per cent of firms using CAD and
CRM software respectively. 9 per cent of firms use Machine Learning technologies, and only 3 per cent of micro-
businesses are using AI. Almost one in four firms (25.3 per cent) use none of these digital technologies
12Figure 4.2: Digital Adoption in UK Micro-businesses 2012-2018
50
45
40
35
30
25
20
15
10
5
0
2012 2015 2018
CRM E-Comm Web A/C CAD Cloud Comp AI M Learn
Source: Micro-business Britain Survey, 2018.
Adoption of these digital technologies is strongly linked to sales per employee, a measure of productivity. Use of
cloud-based computing leads to an increase of 13.5 per cent in sales per employee after three or more years while
using a CRM adds 18.4 per cent to sales per employee over three years. E-commerce adds 7.5 per cent to sales per
employee over three years while web-based accounting software leads to an increase in sales per employee of 11.8
per cent over three years. Computer aided design has a slightly smaller impact, increasing sales per employee by 7.1
per cent.
5. Research round-up
In this section we provide a brief review of insights from recent ERC and related SME research. A number of recent
studies have been based on the first two waves of the LSBS with the third wave of this longitudinal survey due to be
available to researchers over the next couple of months.
Andrew Henley and Meng Song (2018)6, for example, focus on the sub-sample of sole-proprietorships and micro-
businesses in the LSBS (3,882 businesses) to examine the effects of business support. They find evidence that
innovating micro-businesses are most likely to have formal business plans, use external advice or information and be
aware of business support available from the government. However, these factors have no direct impact on
exporting but may have an indirect on exporting through innovation. They also find evidence of a learning-by-
exporting effect.
6 Henley,
A and Song, M (2018) ‘Management Capability, Business Support and the Performance of Microbusinesses in the UK’,
ERC Research Paper 68.
13In a related analysis7, based on LSBS data for all SMEs, Areti Gkypali, Jim Love and Stephen Roper consider
learning-to-export and learning-by-exporting effects. They identify a significant group of firms which while having
products/services which are suitable for exporting make a strategic choice not to export. These ‘domestically -
focused firms’ (DFFs) typically have higher productivity than other non-exporters – the learning-to-export effect –
but lower productivity than exporting SMEs which also benefit from the learning-byexporting effect. As in the
paper by Henley and Song, Gkypali et al. (2018) also identify a strong link from innovation to exporting with the
effect working primarily through export capability. That is, innovation shapes export capability but not necessarily
firms’ subsequent decision to enter export markets.
The link between exporting and productivity (sales per employee) is also reflected in another LSBS study by
Rowena Barrett and colleagues 8. Exploiting the time lag between Year 1 and Year 2 of the LSBS they consider the
drivers of labour productivity. Among their key findings are:
• The trade coefficient is positive and significant, which means that firms with higher export intensity
show better productivity performance.
• A significant and positive link between labour productivity and measures of strategic management,
business capability, business networking, training and the technology intensity of firms.
• Strategic Management Practices, Training and Management Capability have a positive and significant
influence on labour productivity.
• Strategic planning, as measured by a plan to improve leadership capability and a plan to sell goods to
new overseas markets (a measure of innovation), significantly affects labour productivity.
• Management capability to access external finance and training to improve IT skills has significant and
positive effects on productivity.
• Having their own website significantly affects productivity in firms positively as compared to firms
without a website.
These papers suggest the important contribution of innovation to firm performance. Maximising the value of
innovation depends on the effective management and organisation of the innovation process and another ERC
Research Paper considers how firms can best balance the different resource and organisational requirements of
‘exploration’ and ‘exploitation’ in the innovation process 9. Based on survey data on UK services Roper et al. (2018)
find some strong contrasts, with more ‘organic’ practices associated with exploration and more ‘mechanistic’
practices better supporting exploration. The results suggest very different organisational strategies for services
firms adopting business models which emphasise exploration, exploitation or both.
7 Gkypali, A Love, J H and Roper, S (2018) ‘Export status and SME productivity: Learning-to-export versus learning-by-exporting’,
ERC Research Paper 71.
8 Barrett, R Shahiduzzaman, M and Kowalkiewicz, M (2018) ‘Productivity of the UK’s small and medium sized enterprises: insights from
the Longitudinal Small Business Survey’, ERC Research Paper 67.
9 Roper, S Bourke, J and Love, J H (2018) ‘Organisational capital, exploration and exploitation: Econometric evidence for UK services
firms’, ERC Research Paper 65. 14Finance, leadership and management and business support provide the focus for three other recent ERC research
papers. Ross Brown and colleagues return to the theme of discouraged borrowers using the LSBS data 10. They
estimate that around one-in-ten SMEs across the UK (perhaps around half a million in total) are discouraged
borrowers with potential implications for firms’ ability to invest for growth. Discouragement appears greatest in
London (15.7 per cent of firms) and, outside the capital, in more peripheral regions. Fear of rejection is one reason
for discouragement but risk aversion – an unwillingness to borrow – proves a more important driver of
discouragement. Another – forthcoming – ERC research paper suggests that financial rationing due to
discouragement can have particularly detrimental growth impacts.
Business support and its effects on performance is the focus of a paper by Geoff Gregson and colleagues 11. This
emphasises the importance of context and ambition in shaping the probability that firms engage with business
support and the subsequent impact. Younger firms are less likely to seek business advice but where they do this is
likely to relate to finance. Loss making firms are more likely to seek advice on cost reduction though efficiency
improvement and financial management. Profitability is positively related to business advice about training and
business growth, particularly where advice is paid for by the firm. The importance of context is also a key theme in
the paper by Jonathan Levie and Enrico Vanino looking at the relationship between performance and the size and
diversity of firms’ leadership teams12. Team diversity – defined in terms of ethnicity, gender and experience – and
size are positively linked to innovation, export and growth performance. Effect sizes often vary, however, depending
on the nature of the firm.
10 Brown, R Liñares-Zegarra, J and Wilson, J (2018) ‘An empirical examination of discouraged borrowers in the UK. Research’, ERC
Research Paper 69.
11 Gregson, G Mahdavi, H Raby, S and Saunders, C (2018) Business support and SME performance: exploratory analysis of the
Longitudinal Small Business Survey 2015 and 2016, ERC Research Paper 70.
12 Levie, J Vanino, E (2018) ‘Team size, diversity and performance of new ventures and SMEs: a meta-analysis’, ERC Research Paper 64.
15The State of Small Business Britain
Part B: Micro-business Britain
Pathways to productivity – ambition, innovation, adoption
Stephen Roper, Mark Hart, Jane Bourke and Katherine Hathaway
Acknowledgements
We are grateful to the many businesses who contributed responses to the Micro-business Britain Survey. The
project was supported by the Economic and Social Research Council (ESRC) through an additional funding stream
related to the Industrial Strategy. i.e., the Industrial Strategy Challenge Fund.
16Micro-business Britain - Executive Summary
In 2017 there were 1.11m micro-businesses (with 1-9 employees) in the UK, employing around 4.09m people (17.6
per cent of the workforce). This group of firms accounted for £552bn in sales, 14.7 per cent of that by all UK firms.
The Micro-business Britain Survey sheds new light on this diverse segment of the SME population in the UK and
addresses important gaps in our understanding relating to innovation, technology adoption, ambition and
productivity.
Understanding the UK’s micro-businesses
The Micro-business Britain survey enables us to paint a distinct and vivid portrait of UK micro-businesses and their
links to the households from which their owners originate. On average micro-businesses have median employment
of 4.00 (mean, 3.34) and median turnover of £250,000 (mean £664,000). Around 85.6 per cent of firms reported
generating a profit or surplus in the year prior to the survey. Micro-businesses in each UK region reported positive
turnover growth, with growth across the UK averaging 2.8 per cent. This varied significantly both within and
between regions, however, with the highest average turnover growth rate in the East of England.
On average businesses in the survey had been established for more than 22.8 years, with only 26.4 per cent either 10
years old or newer13. More than half of all micro-businesses (53.8 per cent) are home-based, having the same
business and residential address. 70.1 per cent of them are family-owned and 59.0 per cent were both family owned
and managed. In the vast majority of micro-businesses (81.9 per cent) the founder was still involved.
34.8 per cent of micro-businesses are led by a single person, with 45.1 per cent of micro-businesses have a leadership
team of two. In the remaining businesses, where there are three or more members of the leadership team, 37.2 per
cent are women and 9.8 per cent from ethnic minority backgrounds.
Around a third of micro-businesses are selling to either businesses or consumers outside the UK (33.3 per cent) and,
on average, micro-businesses derive around 8.7 per cent of sales from outside the UK. The proportion of firms
exporting differs significantly between regions with London and the North East having the largest proportions of
exporting firms (Figure 2.3).
External finance was being used by 39.4 per cent of micro-businesses on average with use highest in Northern
Ireland. (46.1 per cent) and lowest in Yorkshire and Humber (32.6 per cent).
A story of ambition – for the individual, for the business
Previous studies have strongly linked owner-managers growth ambition to the subsequent growth and performance
of the firm. In the Micro-business Britain survey, we use a new set of ambition questions which reflect individuals’
aspirations for their own future and for the future of their business.
73.7 per cent of all respondents aim to ‘keep their business similar to how it operates now’, and a more ambitious
22.1 per cent of respondents aim to build a ‘national or international business’. Individuals’ personal ambitions
suggest a rather different set of priorities, with a marked emphasis on ‘freedom’ and ‘flexibility’
While gender differences in levels of ambition are relatively small we see larger regional differences in the
proportions of micro-business owners aiming to grow their business. In terms of this metric London stands out with
35.9 per cent of business owners aiming to achieve national and/or international recognition. Levels of growth
ambition among micro-businesses are markedly lower in other regions
13 Thisis not representative of all micro-businesses in the UK as the sample was designed to exclude those micro-businesses aged
three years or less.
17Innovation – investments and outcomes
Across the whole sample of micro-businesses 32.4 per cent introduced a new or significantly improved product or
service over the previous three years. This proportion varied significantly by region, however, from a high of 38.7
per cent in the North West to a low of 26.9 per cent in Northern Ireland. A lower proportion of firms (23.0 per cent)
reported organisational changes or changes in business processes, again with strong regional variation.
10.6 per cent of micro-businesses reported new to the market innovation in products or services in the three years
prior to the survey. This varied from a high of 13.0 per cent in the West Midlands to 7.7 per cent in Northern
Ireland.
Only around 1:4 micro-firms reporting innovation were actually undertaking R&D. In other words, most micro-
business innovation is not linked to R&D but other types of intangible or knowledge investments. Most common
among these investments were computer hardware or software (64 per cent of innovators) and advanced machinery
(33.4 per cent of innovators).
Collaboration with innovation partners provides another route through which micro-businesses can access new
knowledge for innovation and share costs and risks. Around 38.4 per cent of innovating micro-businesses had
collaborated for innovation during the three years prior to the survey.
Adoption of digital technologies
Web-based accounting software and cloud computing are the most commonly used digital technologies among UK
micro-businesses, with more than 40 per cent of firms using these technologies. E-Commerce is used by 30 per cent
of firms, with 25 and 18 per cent of firms using CAD and CRM respectively. 9 per cent of firms use Machine
Learning technologies, and only 3 per cent of micro-businesses are using AI.
Almost one in four firms (25.3 per cent) use no digital technology at all. Almost the same number of firms (24.7 per
cent) use only one digital technology. Over one in five firms (21.3 per cent) use two digital technologies, with 17 and
8 per cent of firms using three and four digital technologies respectively.
Prior to 2012, the diffusion of digital technologies among micro-businesses was relatively low. For instance, web-
based accounting software, CAD and E-Commerce were the most commonly used digital technologies, with
approximately one in seven micro-businesses using these technologies in 2012. Fewer than one in ten firms were
using cloud computing, and even fewer firms were using CRM, Machine Learning and AI.
Pathways to productivity
We consider how the business characteristics, innovation and adoption behaviour of micro-businesses are linked to
their sales per employee, our proxy for labour productivity. Given the cross-sectional nature of our survey data there
are limits to this analysis and results in terms of business characteristics and innovation should be interpreted as
indicative rather than causal relationships.
As we can establish a clear temporal difference between the date of technology adoption and current turnover per
employee, however, these relationships can be regarded as causal. Key results are as follows:
• Being a home-based business, having a larger leadership team, being an exporter and being an
organisational innovator are all positively associated with significantly higher levels of sales per
employee.
• Within the group of micro-businesses, larger levels of employment, being familyowned and having the
founder involved are all associated with significantly lower levels of sales per employee.
Our modelling provides strong causal evidence of the impact of digital adoption on the productivity (sales per
employee) of micro-businesses when productivity is measured three years after adoption:
Use of cloud-based computing leads to an increase of 13.5 per cent in sales per employee after three or more years;
• CRM use adds 18.4 per cent to sales per employee over three years;
• E-commerce adds 7.5 per cent to sales per employee over three years;
• Web-based accounting software leads to an increase in sales per employee of 11.8 per cent over three
years; and,
• Computer aided design leads to a 7.1 per cent increase in sales per employee.
18Micro-business Britain
1. Introduction
Micro-businesses (with 1-9 employees) play an important role in all of our lives. They are our plumbers, our
builders, our hairdressers and our mechanics. They are also our architects, designers, artists, lawyers and
accountants. In 2017, there were 1.11m microbusinesses in the UK, employing around 4.09m people (17.6 per cent of
the workforce). This group of firms accounted for £552bn in sales, 14.7 per cent of that by all UK firms. 14
Many micro-businesses start small and stay small. For other entrepreneurs their micro-business is the launchpad for
scaling-up. Or, at least, the test-bed for a new business idea or innovation. The Micro-business Britain Survey (Box
1) was designed to shed new light on this diverse segment of the SME population in the UK. This is important
because micro-businesses are often excluded from other national and international surveys which might help us
understand what drives their growth and productivity. For example, we know very little about the nature of
innovation activity in micro-businesses as firms with less than 10 employees are excluded from the flagship UK
Innovation Survey. Similarly, micro-businesses are also excluded from the OECD Digital Adoption survey so – until
now – we have known very little about the adoption of new technologies by micro-businesses.
The Micro-business Britain project therefore addresses important gaps in our understanding relating to innovation,
technology adoption and productivity. It also focuses attention on the individuals – or more correctly the households
– which are closely linked to many micro-businesses. What shapes their level of ambition for growth or productivity
improvement? How does this influence their investment or engagement with external finance providers? To enrich
this insight, the UK survey – which covered 6,200 firms in all parts of the UK – was accompanied by smaller
benchmark surveys of micro-businesses in Ireland (1,500) and the US (2,000).
This report provides a preliminary account of the Micro-business Britain survey focussing on regional contrasts in
business ambition, innovation and new technology adoption. The report is organised as follows:
• Section 2 profiles the micro-business population highlighting the role of family, home-based businesses
and regional diversity within this segment of the SME population.
• Section 3 focuses on ambition: What aspirations do micro-business leaders have for their business? For
themselves?
• Section 4 relates to innovation. Schumpeterian arguments related to creative destruction give micro-
firms a specific role in the innovation process. Is this justified? How does innovation in micro-firms
actually work?
• Section 5 brings in technology adoption. Here, we focus on the adoption of a range of digital
technologies. How extensive is their adoption in micro-businesses? How is this changing? What are the
enablers and barriers to adoption?
• Section 6 explores pathways to productivity in micro-businesses linking firm characteristics, innovation
and digital adoption.
14 Business Population Estimates for the UK and regions 2017, BEIS Table A, page 3. Available at: https://assets.publishing
.service.gov.uk/government/uploads/system/uploads/attachment_data/file/663235/ bpe_2017_statistical_release.pdf.
19Box 1: The Micro-business Britain Survey
The survey aimed to build a representative picture of established micro-businesses in the UK and
collect comparative data on representative groups of micro-businesses in the US and Ireland
(Annex 1). The UK survey was undertaken by telephone using a CATI system between 10th
January and 21st April 2018 based on a commercially sourced sampling frame. Firms in the 5-9
size-band were oversampled as were firms in Northern Ireland and Wales to prevent particularly
small sample sizes in these groups. The focus was on established micro-businesses, i.e., firms with
1-9 employees that have been established for three years or more. Firms were also excluded from
the survey if they were branches, divisions or subsidiaries of larger companies, if they were
charities or if they were part of the public sector. In the analysis responses are weighted to obtain
representative results.
2. Understanding the UK’s micro-businesses
The Micro-business Britain survey enables us to paint a distinct and vivid portrait of UK micro-businesses and their
links to the households from which their owners originate. On average micro-businesses have mean employment of
3.34 (median, 4.00) and mean turnover of £664,000 (median, £250,000). Around 85.6 per cent of firms reported
generating a profit or surplus in the year prior to the survey. Mean turnover differs significantly by region (Figure
2.1).
Figure 2.1: Mean turnover of micro-businesses: by region
London 1098
South East 729
East Midlands 696
Northern Ireland 673
North West 667
East of England 619
Wales 592
& Humberside 587
South West 534
West Midlands 521
North East 494
Scotland 482
0 200 400 600 800 1000 1200
Mean turnover £000
Micro-businesses in each UK region reported positive turnover growth with growth across the UK averaging 2.8
per cent. This varied significantly both within and between regions, however, with the highest average turnover
growth rate in the East of England (Figure 2.2).
20Figure 2.2: Average turnover growth: By region
East of England 7.8
East Midlands 4.6
West Midlands 3.2
North East 3.1
South West 2.9
Northern Ireland 2.6
York & Humber 2.2
South West 1.8
North West 1.4
Wales 1.3
London 1.0
Scotland 0.8
0.0 1.0 2.0 3.0 4.0 5.0 6.0 7.0 8.0
Turnover growth (mean%)
On average businesses in the survey had been established for more than 22.8 years, with only 26.4 per cent either 10
years old or newer. This age distribution may have significant impacts on technology adoption and innovation with
a number of studies suggesting that innovation levels fall as businesses mature. 15
More than half of all micro-businesses (53.8 per cent) are home-based, having the same business and residential
address. 70.1 per cent of them were family-owned and 59.0 per cent were both family owned and managed. Recent
evidence suggests that while family ownership has little performance impact, family management of businesses
reduces the sophistication of management practice within firms with significant negative productivity impacts. 16
In the vast majority of micro-businesses (81.9 per cent) the founder was still involved. This may have positive and
negative effects. The founder may have deep understanding of a sector and extensive social networks which may
have positive performance benefits. In other cases ‘founders disease’ may limit the vision or strategic scope of a
business with negative performance implications. 17
34.8 per cent of micro-businesses are led by a single person, while 45.1 per cent of microbusinesses have a leadership
team of two. In the remaining businesses where there are three or more members of the leadership team, 37.2 per
cent are women and 9.8 per cent from ethnic minority backgrounds.
15 Mazzarol, T., Reboud, S., & Volery, T. (2010). The influence of size, age and growth on innovation management in small firms.
International Journal Of Technology Management, 52(1-2), 98-117. Balasubramanian, N., & Lee, J. (2008). Firm age and innovation.
Industrial and Corporate Change, 17(5), 1019-1047.
16 Awano, G., Heffernan, A., & Robinson., H. (2017). Management practices and productivity among manufacturing businesses in
Great Britain: Experimental estimates for 2015.
17 Willard, G. E., Krueger, D. A., & Feeser, H. R. (1992). In order to grow, must the founder go - a comparison of performance between
founder and non-founder managed high-growth manufacturing firms. Journal of Business Venturing, 7(3), 181-194.
21Around a third of micro-businesses are selling to either businesses or consumers outside the UK (33.3 per cent) and
on average micro-businesses derive around 8.7 per cent of sales from exports. The proportion of firms exporting
differs significantly between regions with London and the North East having the largest proportions of exporting
firms (Figure 2.3).
Figure 2.3: Percentage of micro-businesses exporting: By region
London 46.8
North East 36.1
Northern Ireland 35.8
Scotland 34.6
South East 34.5
Wales 33.3
East of England 32
South West 32.0
North West 29.8
& Humberside 28.8
West Midlands 27.7
East Midlands 26.5
0.0 5.0 10.0 15.0 20.0 25.0 30.0 35.0 40.0 45.0 50.0
% firms exporting
External finance was being used by 39.4 per cent of micro-businesses on average with use highest in Northern
Ireland. (46.1 per cent) and lowest in Yorkshire and Humber (32.6 per cent) (Figure 2.4).
Figure 2.4: Percentage of micro-businesses using external finance: By region
Northern Ireland 46.1
South West 45.9
Scotland 45.3
North West 42.9
Wales 41.0
South East 38.9
East of England 38.7
West Midlands 37.2
East Midlands 37.2
North East 36.8
London 33.5
York & Humber 32.6
0.0 5.0 10.0 15.0 20.0 25.0 30.0 35.0 40.0 45.0 50.0
% firms exporting
The picture that emerges is that most micro-businesses are mature, and many are homebased. They are closely
related to the families which own and run them, and that in most cases the founder is still involved. Growth in sales
has been modest for most firms over the last year with around a third of firms exporting. Nearly two-thirds of firms
rely solely on internal funding, with around a third using external funding sources. In the next section we consider
the business and personal ambitions of the owner-managers of micro-businesses. 223. A story of ambition – for the individual, for the business
Previous studies have strongly linked owner-managers growth ambition to the subsequent growth and performance
of the firm 18. In the Micro-business Britain survey we use a new set of ambition questions which reflect the dual
structure adopted in some business development programmes. In the Dutch Growth Accelerator programme, for
example, attendees are asked to reflect on their own individual aspirations for the future and separately on their
aspirations for the future of their business 19. Given the nature of micro-businesses these two sets of aspirations are
often strongly interlinked but for many ownermanagers their aspirations for the business will be a means towards a
more personal endpoint.
Looking first at respondents’ aspirations for their micro-business we consider the proportion of respondents ranking
each aspiration as ‘important’ or ‘very important’. This suggests a sharp distinction between 73.7 per cent of all
respondents who aim to ‘keep their business similar to how it operates now’, and a more ambitious 22.1 per cent of
all respondents who aim to build a ‘national or international business’ (Figure 3.1). Other more operational
aspirations – employee engagement, HR practices, social benefits - fall between these two extremes. 30.9 per cent of
all micro-business owners aim ‘to grow their business rapidly and profitably with view to exit’. As Figure 3.1 shows
we also see very similar profiles of business objectives for male and female micro-business owners.
Individuals’ personal ambitions suggest a rather different set of priorities, with a marked emphasis on ‘freedom’ and
‘flexibility’ (Figure 3.2). This is consistent with much of the research literature on self-employment and
entrepreneurship which stresses the financial as well as the non-financial benefits of being your own boss. The
financial aspect of running a business proves important for some however with 41.3 per cent of all business owners
regarding it as important ‘to build great wealth or a very high income’. Again, in terms of individual’s personal
ambitions we see a marked similarity between male and female micro-business owners.
18 Hermans, J., Vanderstraaeten, J., Van Witteloostuijn, A., Dejardin, M., Ramdani, D., & Stam, E. (2015). Ambitious entrepreneurship:
a review of growth aspirations, intentions and expectations. In Entrepreneurial growth: individual, firm and region (Vol. 17, pp. 127-160).
19 OECD. (2012). An International Benchmark analysis of public programmes for high growth firms’. Paris.
23Figure 3.1: Business objectives: By gender of business owner
72.1
To keep my business similar to how it operates now
76.6
52.8
To create a culture of employee engagment
54.6
To increase the social and 46.1
environmental benefits of the business 50.1
To grow my business rapidly and 29.7
profitably with the view to exit 32.8
21.5
To develp more professional HR practices in the business
25.6
23.5
To build national/or international business
19.6
0.0 10.0 20.0 30.0 40.0 50.0 60.0 70.0 80.0 90.0
Male Female
Figure 3.2: Personal ambition: By gender of business owner
80.6
To have greater flexibility for my personal and family life
81.9
To have considerable freedom to 82.1
adapt my own approach to work 79.5
62.4
To be able to retire
67.9
To fulfil a personal vision of becoming a 42.6
successful business leader in my community 47.6
41.7
To build a business to hand on to my family
43.2
To have a chance to build great 40.5
wealth or a very high income 42.7
0.0 10.0 20.0 30.0 40.0 50.0 60.0 70.0 80.0 90.0
Male Female
While gender differences in levels of ambition are relatively small we see larger regional differences in the
proportions of micro-business owners aiming to grow their business (Figure 3.3). In terms of this metric London
stands out with 35.9 per cent of business owners aiming to achieve national and/or international recognition. Levels
of growth ambition among micro-businesses are markedly lower in other regions
24Figure 3.3: Proportion of micro-businesses aiming ‘to build a national or international business’: By region
London 35.9
East Midlands 25.2
West Midlands 24.2
South East 22.5
North West 21.7
York & Humber 20.8
Wales 18.9
North East 18.5
Northern Ireland 18.2
South West 17.4
East of England 17.3
Scotland 13.9
0.0 5.0 10.0 15.0 20.0 25.0 30.0 35.0 40.0
% firms
4. Innovation – investments and outcomes
Innovation is a process through which firms’ investments in R&D and other intangibles such as design are
integrated with externally sourced knowledge to generate new products, services or business models. In the Micro-
business Britain Survey, we follow the approach taken in the UK Innovation Survey (and EU Community
Innovation Survey) and focus on firms’ innovation activity over the last three years. This reflects the time taken for
intangible investments and externally sourced knowledge to feed through into new products or services and have a
discernible impact on firms’ bottom line. Here we focus on two main questions: How active are micro-businesses
across the UK in terms of innovation? And, secondly, how are businesses innovating? Does this involve R&D, or
collaboration with other organisations? In each case we consider the regional geography of micro-business
innovation across the UK.
Across the whole sample of micro-businesses 32.4 per cent reported introducing a new or significantly improved
product or service over the previous three years. This proportion varied significantly by region, however, from a
high of 38.7 per cent in the North West to a low of 26.9 per cent in Northern Ireland. A lower proportion of firms
(23.0 per cent) reported organisational changes or changes in business processes, again with strong regional
variation (Figure 4.1). 20
20 Interestingly the correlation between product/service and organisational innovation is relatively weak at 0.188. 25Figure 4.1: Percentage of innovating micro-businesses: By region
North West 38.7
21.1
North East 36.3
21.4
East of England 34.8
25.9
London 34.7
25.5
East Midlands 34.2
24.6
West Midlands 32.1
23.6
South West 31.3
21.8
South East 30.5
25.0
York & Humber 30.3
22.9
Wales 29.3
18.5
Scotland 29.0
18.2
Northern Ireland 26.9
12.5
0.0 5.0 10.0 15.0 20.0 25.0 30.0 35.0 40.0 45.0
Product Organisation
The nature of the innovations made by firms varied significantly, however, with some firms introducing new and
improved products:
‘We increased the range of stock and improved customer service and have additional staff’.
‘We implemented new product design adding new applications to products and services: the company is starting to operate
outside of the EU’.
Or, developing new service offerings:
‘Our magazines are now digital, this helps attract customer due to the embedded video advertising’.
‘We developed gamification - the application of game theory to a business environment’.
Other firms were innovating by adopting new approaches to the products and services they trade:
‘We are buying more ethically produced and fair trade stock’.
The nature of organisational change among micro-businesses also varied widely with changes in internal practices,
external relationships and new technology adoption. In terms of changes in management practices and external
relationships firms highlighted:
‘… job sheets. More streamlined. Every job that goes through now has a worksheet put to it so we can table the jobs up to
make sure correct price is met and there is quality and traceability which customers like. Streamlining is the process where from
coming through the door it's traceable and more organised on the shop floor’.
‘Changing the way we work with suppliers. We couldn't rely on partners. Now we are more independent an to have more
control and provide better customer service’.
‘We've gained an association with a world leading academic in our subject’.
26In terms of new technology adoption, many firms reported:
‘Going digital in everything that we do’:
‘We looked at how to digitalise the business. Using digital technology and introducing new products
to new markets’.
‘We are using the cloud internet’.
‘The most appropriate change I made is computerising everything such as stocks and accounts’.
Another aspect of firms’ innovation is whether they were developing new to the market innovation (i.e. introduced
before their competitors). New to the market innovation may give firms first mover advantage in the market place
and deliver higher returns than more incremental product or service improvement. However, the risks can be
greater and product and service development more difficult 21. Overall, around 10.6 per cent of micro-businesses
reported new to the market innovation in products or services in the three-years prior to the survey. This varied
from a high of 13.0 per cent in the West Midlands to 7.7 per cent in Northern Ireland (Figure 4.2).
Figure 4.2: Percentage of micro-businesses reporting new to the market innovation
West Midlands 13.0
London 12.3
South West 11.2
North East 10.5
South East 10.4
East of England 10.4
North West 10.1
East Midlands 9.8
Scotland 9.1
York & Humber 9.1
Wales 9.0
Northern Ireland 7.7
0.0 2.0 4.0 6.0 8.0 10.0 12.0 14.0
% firms
Innovations, whether new to the market or incremental, are the end of a business process which may involve R&D,
other intangible investment and knowledge sourced from partners or collaborators. Next, we consider the
investments micro-businesses are making to drive their innovation activity and who they are collaborating with.
Only around 1:4 microbusinesses reporting innovation were actually undertaking R&D (Figure 4.3). In other words,
most micro-business innovation is not linked to R&D but other types of intangible or knowledge investments. Most
common among these investments were computer hardware or software (64 per cent of innovators) and advanced
machinery (33.4 per cent of innovators) (Figure 4.3).
Collaboration with innovation partners provides another route through which microbusinesses can access new
knowledge for innovation and share costs and risks 22. Despite the potential advantages only around 38.4 per cent of
innovating micro-businesses had collaborated for innovation during the three years prior to the survey.
21 Ulhoi,J. P. (2012). Modes and orders of market entry: revisiting innovation and imitation strategies. Technology Analysis & Strategic
Management, 24(1), 37-50.
22 Roper, S., & Hewitt-Dundas, N. (2017). Investigating a neglected part of Schumpeter’s creative army: what drives new-to-the-market
innovation in micro-enterprises? Small Business Economics, 49(3), 559-577. 27Figure 4.3: Intangibles investment to support innovation: % innovating micro-businesses
Collaboration with external partners 38.4
Product/ Service Launch advertising 33.8
Changes to marketing methods 37.9
Market Research 23.9
Any type of design 24.4
Training related specifcally to developing new… 32.1
Licenses fortechnology or products/services 34.0
Computer hardware or software 64.1
Advanced machinery equipment 33.4
R&D undertaken by someone else 13.8
R&D within your firm 25.5
0.0 10.0 20.0 30.0 40.0 50.0 60.0 70.0
% innovating firms
Collaborative micro-business innovators are most likely to be working with suppliers or customers as part of their
innovation activity (Figure 4.4). 1:3 micro-businesses which were collaborating for innovation were working with
consultants and 1:5 with universities. This pattern is widely observed in other surveys of open innovation where
collaboration up and down supply chains are typically most common.
Figure 4.4: Collaboration for innovation: % of innovators collaborating
Suppliers of equipment, materials, services or software 72.5
Clients or customers 49.4
Competitors or other businesses in your industry 38.0
Other businesses not in your industry 32.7
Consultants, commercial labs or private R&D institutes 28.1
Universities or other higher education institutions 18.4
Government or public research institutes 8.0
0.0 10.0 20.0 30.0 40.0 50.0 60.0 70.0 80.0
% collaborators
28One other measure of collaboration which is often used in innovation surveys is an indicator of the ‘breadth’ of firms’
innovation collaboration 23. This measure counts the number of different partner types with which a firm is working
as part of its innovation activity. In the Micro-business Britain survey, we identify seven partner types so this
breadth measure takes values from 0 to 7 (Figure 4.5). As indicated previously the majority of innovating micro-
businesses are solo innovators with no innovation partners. Having one or two types of innovation partner was most
common with relatively few innovating micro-businesses have more than two types of partner.
Figure 4.5: Breadth of collaboration among innovating micro-businesses
70.00
61.64
60.00
50.00
40.00
30.00
20.00
10.28 10.87
8.96
10.00 4.88
1.93 1.15 0.28
0.00
0 1 2 3 4 5 6 7
Number of types of innovation partners
5. Adoption of digital technologies
5.1 Adoption
We investigated the adoption of seven digital technologies by micro-businesses: Customer relationship management
(CRM), E-Commerce, Web-based Accounting Software, Computer-Aided Design (CAD), Cloud computing,
Artificial Intelligence (AI) and Machine Learning (Box 2).
23
Laursen, K., & Salter, A. (2006). Open for Innovation: The role of openness in explaining innovation performance among UK
manufacturing firms. Strategic Management Journal, 27, 131-150.
29You can also read