STATE OF THE CLIMATE IN 2020 - THE TROPICS H. J. Diamond and C. J. Schreck, Eds - American ...
←
→
Page content transcription
If your browser does not render page correctly, please read the page content below
STATE OF THE CLIMATE IN 2020
                THE TROPICS
                H. J. Diamond and C. J. Schreck, Eds.

Special Online Supplement to the Bulletin of the American Meteorological Society Vol.102, No. 8, August, 2021

https://doi.org/10.1175/BAMS-D-21-0080.1
Corresponding author: Howard J. Diamond / howard.diamond@noaa.gov
©2021 American Meteorological Society
For information regarding reuse of this content and general copyright information, consult the AMS Copyright Policy.

                AU G U S T 2 0 2 1 | S t a t e o f t h e C l i m a t e i n 2 0 2 0                                     4. THE TROPICS   S199
STATE OF THE CLIMATE IN 2020
                            THE TROPICS

                                                                         Editors

                                                                     Jessica Blunden
                                                                        Tim Boyer

                                                                     Chapter Editors

                                                                 Freya Aldred
                                                                 Peter Bissolli
                                                             Howard J. Diamond
                                                           Matthew L. Druckenmiller
                                                              Robert J. H. Dunn
                                                              Catherine Ganter
                                                               Nadine Gobron
                                                             Gregory C. Johnson
                                                                     Tim Li
                                                                 Rick Lumpkin
                                                              Ademe Mekonnen
                                                                John B. Miller
                                                                Twila A. Moon
                                                             Ahira Sánchez-Lugo
                                                               Ted A. Scambos
                                                              Carl J. Schreck III
                                                            Sharon Stammerjohn
                                                             Richard L. Thoman
                                                               Kate M. Willett

                                                                     Technical Editor

                                                                     Andrea Andersen

                                                   BAMS Special Editor for Climate

                                                               Michael A. Alexander

                                                 American Meteorological Society

AU G U S T 2 0 2 1 | S t a t e o f t h e C l i m a t e i n 2 0 2 0                      4. THE TROPICS   S200
Cover credit:
Sea surface temperature (SST) anomalies along the equatorial Pacific in November 2020 compared
to the long-term 30-year average from 1981–2010; the blue colors across the equatorial Pacific
Ocean indicate below-normal SSTs that are a key and canonical feature associated with the La Niña
conditions in place at the time.

The Tropics is one chapter from the State of the Climate in 2020 annual report and is available
from https://doi.org/10.1175/BAMS-D-21-0080.1. Compiled by NOAA’s National Centers for
Environmental Information, State of the Climate in 2020 is based on contributions from
scientists from around the world. It provides a detailed update on global climate indicators,
notable weather events, and other data collected by environmental monitoring stations and
instruments located on land, water, ice, and in space. The full report is available from
https://doi.org/10.1175/2021BAMSStateoftheClimate.1.

How to cite this document:

Citing the complete report:
Blunden, J. and T. Boyer, Eds., 2021: “State of the Climate in 2020”. Bull. Amer. Meteor. Soc.,
102 (8), Si–S475, https://doi.org/10.1175/2021BAMSStateoftheClimate.1.

Citing this chapter:
Diamond, H.J. and C. J. Schreck, Eds., 2021: The Tropics [in “State of the Climate in 2020”].
Bull. Amer. Meteor. Soc., 102 (8), S199–S261, https://doi.org/10.1175/BAMS-D-21-0080.1.

Citing a section (example):
Domingues, R., G. J. Goni, J. A. Knaff, I-I Lin, and F. Bringas, 2021: Tropical cyclone heat
potential [in “State of the Climate in 2020”]. Bull. Amer. Meteor. Soc., 102 (8), S252–S255,
https://doi.org/10.1175/BAMS-D-21-0080.1.

 AU G U S T 2 0 2 1 | S t a t e o f t h e C l i m a t e i n 2 0 2 0                   4. THE TROPICS   S201
Editor and Author Affiliations (alphabetical by name)

Becker, Emily, J., University of Miami Rosenstiel School of Marine &                 Landsea, Chris W., NOAA/NWS National Hurricane Center, Miami, Florida
    Atmospheric Science, Miami, Florida                                              Lin, I.-I., National Taiwan University, Taipei, Taiwan
Bell, Gerald D., NOAA/NWS Climate Prediction Center, College Park, Maryland          Lorrey, Andrew M., National Institute of Water and Atmospheric Research,
Blake, Eric S., NOAA/NWS National Hurricane Center, Miami, Florida                        Ltd., Auckland, New Zealand
Bond, Stephanie, Australian Bureau of Meteorology, Perth, Australia                  Luo, Jing-Jia, Institute for Climate and Application Research (ICAR)/KLME/
Bringas, Francis G., NOAA/OAR Atlantic Oceanographic and Meteorological                   ILCEC/CIC-FEMD, Nanjing University of Information Science and Technology,
    Laboratory, Miami, Florida                                                            Nanjing, China
Camargo, Suzana J., Lamont-Doherty Earth Observatory, Columbia University,           MacRitchie, Kyle, NOAA/NWS Climate Prediction Center, College Park,
    Palisades, New York                                                                   Maryland
Chen, Lin, Institute for Climate and Application Research (ICAR)/KLME/ILCEC/         Magee, Andrew D., Centre for Water, Climate and Land, School of
    CIC-FEMD, Nanjing University of Information Science and Technology,                   Environmental and Life Sciences, University of Newcastle, Callaghan, NSW,
    Nanjing, China                                                                        Australia
Coelho, Caio A. S., CPTEC/INPE Center for Weather Forecast and Climate               Noll, Ben, National Institute of Water and Atmospheric Research, Ltd.,
    Studies, National Institute for Space Research, Cachoeira Paulista, Brazil            Auckland, New Zealand
Diamond, Howard J., NOAA/OAR Air Resources Laboratory, College Park,                 Pasch, Richard J., NOAA/NWS National Hurricane Center, Miami, Florida
    Maryland                                                                         Pezza, Alexandre B., Greater Wellington Regional Council, Wellington, New
Domingues, Ricardo, Cooperative Institute for Marine and Atmospheric                      Zealand
    Studies, University of Miami, Miami, Florida                                     Rosencrans, Matthew, NOAA/NWS Climate Prediction Center, College Park,
Goldenberg, Stanley B., NOAA/OAR/AOML Hurricane Research Division,                        Maryland
    Miami, Florida                                                                   Schreck III, Carl J., North Carolina State University, Cooperative Institute for
Goni, Gustavo, NOAA/OAR/AOML Hurricane Research Division, Miami, Florida                  Climate and Satellites–North Carolina (CICS-NC), Asheville, North Carolina
Fauchereau, Nicolas, National Institute of Water and Atmospheric Research,           Tippet, Michael K., Department of Applied Physics and Applied Mathematics,
    Ltd., Auckland, New Zealand                                                           Columbia University, New York, New York
Halpert, Michael S., NOAA/NWS Climate Prediction Center, College Park,               Trewin, Blair C., Australian Bureau of Meteorology, Melbourne, Victoria,
    Maryland                                                                              Australia
He, Qiong, Earth System Modeling Center, Nanjing University of Information           Truchelut, Ryan E., “WeatherTiger,” Tallahassee, Florida
    Science and Technology, Nanjing, China                                           Wang, Bin, Department of Atmospheric Science and IPRC, University of Hawaii,
Klotzbach, Philip J., Department of Atmospheric Science, Colorado State                   Honolulu, Hawaii
    University, Fort Collins, Colorado                                               Wang, Hui, NOAA/NWS Climate Prediction Center, College Park, Maryland
Knaff, John A., NOAA/NESDIS Center for Satellite Applications and Research,          Wood, Kimberly M., Department of Geosciences, Mississippi State University,
    Fort Collins, Colorado                                                                Mississippi State, Mississippi
L'Heureux, Michelle, NOAA/NWS Climate Prediction Center, College Park,               Woolley, John-Mark, National Institute of Water and Atmospheric Research,
    Maryland                                                                              Ltd., Auckland, New Zealand
                                                                                     Young, Steven, H., Independent Researcher, Long Beach, California

  Editoral and Production Team

Allen, Jessicca, Graphics Support, Cooperative Institute for Satellite Earth         Misch, Deborah J., Graphics Support, Innovative Consulting and Management
    System Studies, North Carolina State University, Asheville, North Carolina           Services, LLC, NOAA/NESDIS National Centers for Environmental
Andersen, Andrea, Technical Editor, Innovative Consulting and Management                 Information, Asheville, North Carolina
    Services, LLC, NOAA/NESDIS National Centers for Environmental                    Riddle, Deborah B., Graphics Support, NOAA/NESDIS National Centers for
    Information, Asheville, North Carolina                                               Environmental Information, Asheville, North Carolina
Hammer, Gregory, Content Team Lead, Communications and Outreach,                     Veasey, Sara W., Visual Communications Team Lead, Communications and
    NOAA/NESDIS National Centers for Environmental Information, Asheville,               Outreach, NOAA/NESDIS National Centers for Environmental Information,
    North Carolina                                                                       Asheville, North Carolina
Love-Brotak, S. Elizabeth, Lead Graphics Production, NOAA/NESDIS National
    Centers for Environmental Information, Asheville, North Carolina

                AU G U S T 2 0 2 1 | S t a t e o f t h e C l i m a t e i n 2 0 2 0                                                    4. THE TROPICS           S202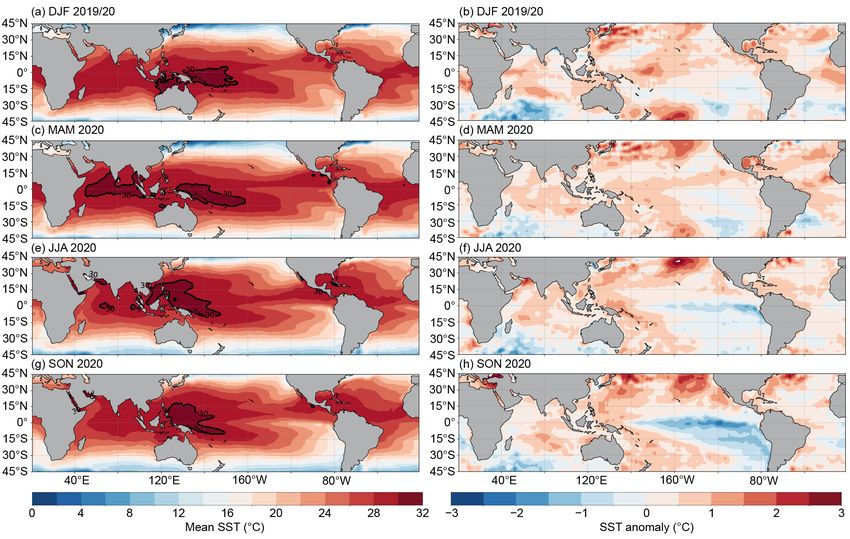
4. Table of Contents
List of authors and affiliations...............................................................................................S202
a. Overview .............................................................................................................................S204
b. ENSO and the tropical Pacific.............................................................................................S205
		 1. Oceanic conditions.......................................................................................................S205
		 2. Atmospheric circulation and precipitation anomalies from
			 December–February 2019/20 to June–August 2020................................................... .S207
		 3. Atmospheric circulation, and precipitation anomalies during La Niña
			 (September–November 2020)...................................................................................... .S208
c. Tropical intraseasonal activity............................................................................................. .S210
d. Intertropical convergence zones......................................................................................... .S213
		 1. Pacific............................................................................................................................. .S213
		 2. Atlantic.......................................................................................................................... .S215
e. Global monsoon summary................................................................................................... .S217
f. Indian Ocean dipole and unique Indian Ocean basin warming in 2020........................... .S220
g. Tropical cyclones................................................................................................................... .S222
		 1. Overview....................................................................................................................... .S222
		 2. Atlantic basin................................................................................................................ .S224
Sidebar 4.1: Hurricane Laura: A record-setting hurricane for southwest Louisiana............. .S231
		 3. Eastern North Pacific and central North Pacific basins.............................................. .S233
		 4. Western North Pacific basin......................................................................................... .S236
		 5. North Indian Ocean basin............................................................................................ .S241
		 6. South Indian Ocean basin............................................................................................ .S244
		 7. Australian basin............................................................................................................ .S247
		 8. Southwest Pacific basin................................................................................................ .S248
Sidebar 4.2: "Medicanes" (Mediterranean tropical-like cyclones) in 2020........................... .S251
h. Tropical cyclone heat potential........................................................................................... .S252
Appendix 1: Chapter - 4 Acronyms.......................................................................................... .S256
References ............................................................................................................................... .S258

*Please refer to Chapter 8 (Relevant datasets and sources) for a list of all climate variables
and datasets used in this chapter for analyses, along with their websites for more informa-
tion and access to the data.

AU G U S T 2 0 2 1 | S t a t e o f t h e C l i m a t e i n 2 0 2 0                                                              4. THE TROPICS     S203
4. THE TROPICS
H. J. Diamond and C. J. Schreck, Eds.

a. Overview—H. J. Diamond and C. J. Schreck
   The tropics in 2020 reflected El Niño–Southern Oscillation neutral conditions through June–
August, with the index decreasing from positive values during boreal spring to negative values
during boreal summer. Starting in July–September (JAS), La Niña thresholds were met, with
Oceanic Niño Index (ONI) values decreasing through October–December (OND). In OND 2020,
the ONI reached a minimum of −1.3°C, which is considered informally to be a La Niña of moder-
ate strength (ONI values between −1.0°C and −1.4°C). The ONI reached and slightly exceeded the
+0.5°C threshold in several seasons during the Northern Hemisphere (NH) winter of 2019/20,
but the anomalies were weak and did not last long enough to be considered an El Niño episode.
   For the global tropics, combined land and ocean surface temperatures (measured at 20°S–
20°N) registered +0.43°C above the 1981–2010 average. This makes 2020 the fourth-warmest year
for the tropics since records began in 1880. The five warmest years have all occurred since 2015.
Data from the Global Precipitation Climatology Project indicate a mean annual total precipitation
value of 1317 mm across the 20°S–20°N latitude band over land. This is 11 mm above the 1981–2010
average and ranks 11th in the 1979–2020 period of record.
   Globally, 102 named tropical cyclones (TCs; ≥34 kt; or ≥17 m s−1) were observed during the 2020
NH season (January–December 2020) and the 2019/20 Southern Hemisphere season (July–June
2019/20; Table 4.2), as documented in IBTrACSv4 (Knapp et al. 2010). Overall, this number was
well above the 1981–2010 global average of 85 TCs, slightly greater than the 96 TCs reported dur-
ing 2019 (Diamond and Schreck 2020), and was three storms shy of the record 104 named storms
in 1992. The 30 named storms in the North Atlantic during 2020 surpassed the previous record
of 28 set in 2005. For the North Atlantic, the 14 hurricanes during 2020 were the second most on
record behind the 15 observed in 2005, and the seven major hurricanes were the most on record,
tying the seven observed in 2005.
   In terms of Accumulated Cyclone Energy (ACE; Bell et al. 2000), all basins were below their
1981–2010 averages except for the North Atlantic and North Indian Ocean basins. The 2020 sea-
sonal ACE value in the North Atlantic was 191.5% of the 1981–2010 median. This value is the sixth
highest since 1970 and is above NOAA’s threshold (Bell et al 2011) for both an above-normal (120%)
and an extremely active (165%) season. There have now been a record five consecutive above-
normal seasons, which surpasses the previous record of four set in 1998–2001. In the western
North Pacific, Super Typhoons Goni and Haishen and Typhoon Maisak contributed 45% of the
seasonal ACE for that basin. The Australian and South Indian Ocean basins were comparatively
quiet; each had an ACE that was below normal. The global total ACE was below the average for
1981–2010 at 574 × 104 kt 2 and well below the 795 × 104 kt 2 value recorded in 2019. Three TCs across
the globe reached Saffir–Simpson Hurricane Wind Scale (https://www.nhc.noaa.gov/aboutsshws
.php) Category 5 intensity level, one in the western North Pacific (Goni), one in the North Indian
Ocean (Amphan), and one in the southwest Pacific (Harold).

 AU G U S T 2 0 2 1 | S t a t e o f t h e C l i m a t e i n 2 0 2 0                      4. THE TROPICS   S204

b. ENSO and the tropical Pacific—M. L’Heureux, E. Becker, M. S. Halpert, Z.-Z. Hu, K. MacRitchie, and M. Tippett
   The El Niño–Southern Oscillation (ENSO) is a coupled ocean–atmosphere climate phenomenon
across the tropical Pacific Ocean, with opposite phases called El Niño and La Niña. For histori-
cal purposes, NOAA’s Climate Prediction Center (CPC) classifies and assesses the strength and
duration of El Niño and La Niña events using the Oceanic Niño Index (ONI, shown for mid-2019
through 2020 in Fig. 4.1). The ONI is the 3-month (seasonal) running average of sea surface tem-
perature (SST) anomalies in the Niño-3.4 region (5°S–5°N, 170°–120°W), currently calculated as
the departure from the 1991–2020 base period mean.1 El Niño is classified when the ONI is at or
greater than +0.5°C for at least five consecutive and overlapping seasons, while La Niña occurs
when the ONI is at or less than −0.5°C for at least five consecutive and overlapping seasons.
   The ONI reached and slightly exceeded the +0.5°C threshold in several seasons during the
Northern Hemisphere winter of 2019/20, but the anomalies were weak and did not last long
enough to be considered an El Niño episode. Consequently, NOAA CPC and other agencies (e.g.,
Australian Bureau of Meteorology and
World Meteorological Organization)
did not post El Niño advisories or alerts
during the boreal winter of 2019/20. At
times, intraseasonal variability also
contributed to El Niño-like atmospheric
anomalies across the tropical Pacific
Ocean, especially during mid-January
and mid-February (see section 4c).
   The ONI reflected ENSO-neutral condi-
tions through June–August (JJA) 2020,
with the index decreasing from positive
values during boreal spring to negative
values during boreal summer. Starting
in July–September (JAS), La Niña thresh-
olds were met, with ONI values decreas- Fig. 4.1. Time series of the ONI (°C) from mid-2019 through 2020.
                                             Overlapping 3-month seasons are labeled on the x-axis, with
ing through October–December.2 During
                                             initials indicating the first letter of each month in the season.
this period, the ONI reached a minimum Blue bars indicate negative values that are below −0.5°C. The
of −1.3°C, which is considered informally ONI values are derived from the ERSSTv5 dataset and are based
to be a La Niña of moderate strength (ONI on departures from the 1991–2020 period monthly means (Huang
values between −1.0°C and −1.4°C).           et al. 2017).

1) Oceanic conditions
   Figure 4.2 displays the mean SST (left column) and SST anomalies (right column) for four,
3-month periods from December–February (DJF) 2019/20 through September–November (SON)
2020. SST anomalies on the equator during DJF (Fig. 4.2, top row) exceeded +1.0°C near the date
line, extending from 170°W to 160°E. The western Pacific warm pool extended farther east than
its mean position, with the 30°C isotherm reaching the date line. However, the east-central and
eastern equatorial Pacific remained near average during DJF 2019/20.
1
    The ONI is an index measuring a climate phenomenon, ENSO, and for that reason, the base period is updated every 5 years with
    a rolling 30-year climatology. The rolling climatology is used in part to remove those secular SST trends and focus on the state
    of ENSO. The 1986–2015 normal was used operationally for 2020, but it was updated to 1991–2020 at the completion of the year.
2
    While the season November 2020–January 2021 (NDJ) is not covered by this review, the NDJ value of the ONI was −1.2°C. Therefore,
    the period beginning in JAS 2020 is part of an official La Niña episode.

     AU G U S T 2 0 2 1 | S t a t e o f t h e C l i m a t e i n 2 0 2 0                                            4. THE TROPICS      S205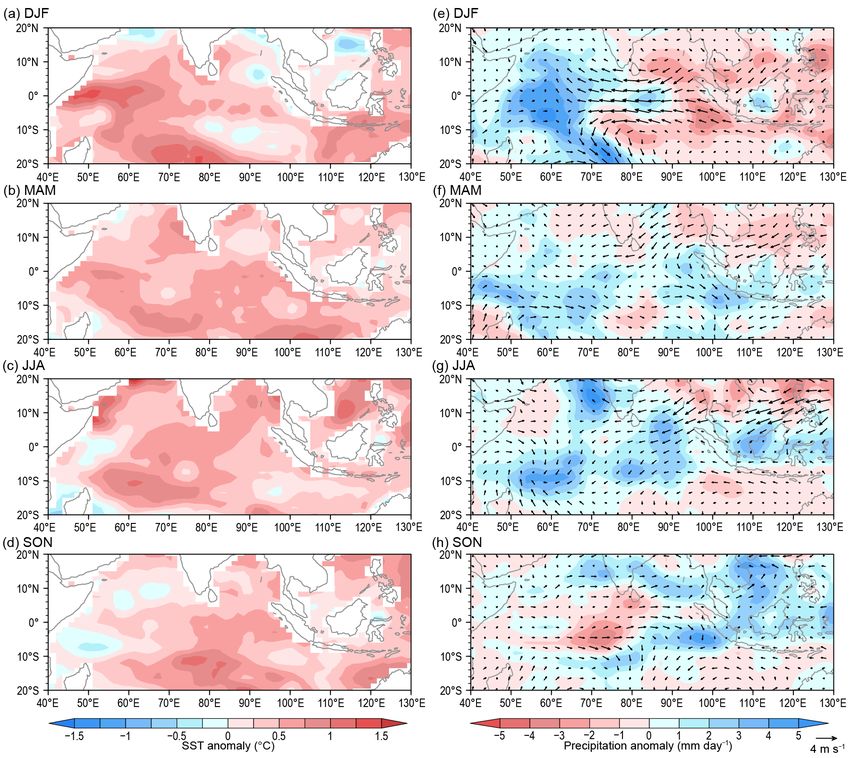
Fig. 4.2. (left) Mean SST and (right) SST anomaly for (°C) (a), (b) DJF 2019/20, (c), (d) MAM 2020, (e), (f) JJA 2020, and (g),
(h) SON 2020. The bold contour for total SST is located at 30°C. Anomalies are departures from the 1981–2010 seasonal
adjusted OI climatology (Reynolds et al. 2002).

             The duration of positive SST anomalies was too short to be considered an El Niño episode,
          and by March–May (MAM) 2020, anomalies weakened across the equatorial Pacific Ocean
          (Figs. 4.2a–d). However, SSTs remained elevated in the western equatorial Pacific and extended
          east-northeast to coastal Central America. While this band of positive SST anomalies projects onto
          the optimal SST growth pattern that can precede the development of El Niño the following winter
          (Penland and Sardeshmukh 1995), by SON 2020 the Pacific had instead transitioned to La Niña.
             By JJA 2020 (Figs. 4.2e,f), the western Pacific warm pool had retracted farther west and the
          cold tongue was stronger than average. Negative SST anomalies became more prominent on the
          equator from ~160°W to the South American coast. During SON 2020 (Figs. 4.2g,h), these negative
          SST anomalies strengthened and expanded even farther west to the date line. By this season, SST
          anomalies exceeded −1.0°C across the east-central and eastern equatorial Pacific Ocean. Below-
          average SSTs were also quite prominent in the southeastern Pacific Ocean, reaching coastal Chile.
          These subtropical SST anomalies were asymmetric across the hemispheres. Below-average SSTs
          did not extend into the northeastern Pacific Ocean, which was instead above average.
             Consistent with the SST evolution, subsurface temperatures during DJF 2019/20 were above
          average in the central and eastern equatorial Pacific Ocean (Fig. 4.3a). Near the date line, tem-
          perature anomalies in excess of +1.5°C extended from ~150-m depth to the surface. Like those at
          the surface, the positive subsurface temperature anomalies weakened by MAM (Fig. 4.3b), and,
          by JJA, negative subsurface temperature anomalies dominated the eastern equatorial Pacific
          Ocean (Fig. 4.3c). This cooling reflected the shallower oceanic thermocline and increased up-
          welling that accompanies a developing La Niña. During SON 2020 (Fig. 4.3b), the shoaling of the
          equatorial thermocline in the eastern Pacific was most apparent relative to earlier in the year,
          and subsurface temperature anomalies were −4.5°C or cooler at a depth of ~50–100 m. Late in
          the year, positive temperature anomalies remained weak and confined at depth near the date
          line and in the western Pacific. The east–west contrast in subsurface temperature anomalies is
          consistent with the tilt mode of ENSO (Clarke 2010; Kumar and Hu 2014).

            AU G U S T 2 0 2 1 | S t a t e o f t h e C l i m a t e i n 2 0 2 0                         4. THE TROPICS    S206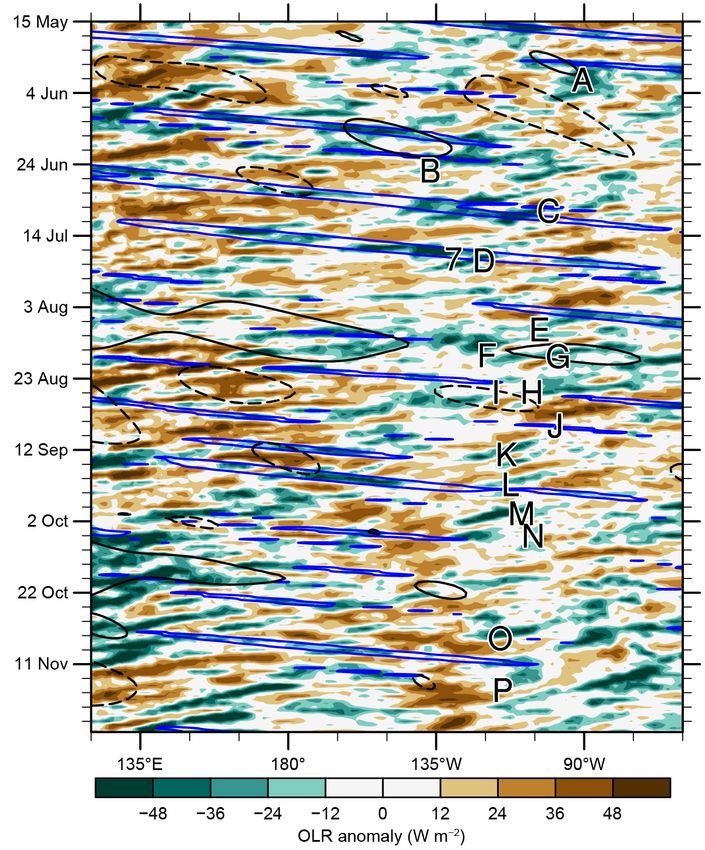
Fig. 4.3. Equatorial depth–longitude section of Pacific Ocean temperature anomalies (°C) averaged between 5°S and 5°N
during (a) DJF 2019/20, (b) MAM 2020, (c) JJA 2020, and (d) SON 2020. The 20°C isotherm (thick solid line) approximates the
center of the oceanic thermocline. The gray, dashed line shows the climatology of the 20°C isotherm based on 1982–2010.
The data are derived from a reanalysis system that assimilates oceanic observations into an oceanic general circulation
model (Behringer et al. 1998). Anomalies are departures from the 1982–2010 period monthly means.

          2) Atmospheric circulation and precipitation anomalies from December–February 2019/20
             to June–August 2020
             The pattern of tropical convection and low-level winds during DJF 2019/20 was associated
          with weak warm SST anomalies (Figs. 4.4–4.6). Specifically, tropical convection (as measured
          by outgoing longwave radiation [OLR]) was enhanced around the date line (green shading) and
          suppressed over Indonesia (brown shading; Fig. 4.4a). Low-level (850-hPa) tropical wind anoma-
          lies were westerly over the western Pacific Ocean during DJF (Fig. 4.5a). Upper-level (200-hPa)
          tropical winds were westerly across the central to eastern Pacific Ocean, and were strongest
          over the eastern Pacific (Fig. 4.6a). Despite the enhanced convection around the date line, the
          upper-level zonal wind anomalies were not divergent on the equator (though meridional wind
          anomalies were divergent over the western Pacific, highlighting the lack of a robust circulation
          response through the entire atmosphere to the underlying SST anomaly pattern). Because the
          climatological 200-hPa winds are westerly from ~160°W to coastal South America during this
          season, the upper-branch of the Pacific Walker circulation was stronger than average. The lack
          of a weak Walker circulation at upper levels, the mild, westward shifted SST anomalies, and the
          short duration of warming precluded the designation of El Niño conditions during DJF 2019/20.
          Furthermore, several pulses of enhanced convection occurred near the date line, concurrent with
          the passage of eastward-propagating intraseasonal disturbances that can be seen in the 200-hPa
          velocity potential anomalies in early 2020 (see Fig. 4.7).

            AU G U S T 2 0 2 1 | S t a t e o f t h e C l i m a t e i n 2 0 2 0                      4. THE TROPICS   S207
Fig. 4.4. OLR anomalies (shaded, W m−2), during (a) DJF 2019/20, (b) MAM 2020, (c) JJA 2020, and (d) SON 2020. Anomalies
are departures from the 1981–2010 period monthly means. Data are from the NCEP/NCAR Reanalysis (Kalnay et al. 1996).

             ENSO-neutral conditions continued through JJA though signs of a developing La Niña were
          evident in anomalies of OLR and winds during the boreal spring and summer. In particular, below-
          average convection was observed near the date line starting in MAM (Fig. 4.4b). These suppressed
          OLR anomalies were initially focused south of the equator and became more equatorially confined
          to the western and central Pacific during JJA (Fig. 4.4c). Low-level trade winds were enhanced,
          with easterly wind anomalies observed on the equator starting in MAM and continuing through
          the remainder of 2020 (Figs. 4.5b–d). The strengthening of the upper-level branch of the Walker
          circulation, first seen in the 200-hPa wind anomalies in DJF 2019/20, also persisted throughout
          the remainder of the year, with the brief exception of near-average winds in the central Pacific
          during JJA 2020 (Fig. 4.6c). The upper-level branch of the Walker Circulation became stronger
          again with the onset of La Niña in SON (Fig. 4.6d).

          3) Atmospheric circulation and precipitation anomalies during La Niña (September–
             November 2020)
             As La Niña formed in JAS 2020, its signal increasingly dominated the atmospheric circulation
          over the tropical Pacific Ocean. A convective anomaly dipole became evident as the Pacific Walker
          circulation strengthened. Suppressed convection became even more noticeable in the western
          and central equatorial Pacific during SON (Fig. 4.4d). Enhanced convection appeared around
          Indonesia, extending northwestward into Southeast Asia and India. Anomalous low-level easter-
          lies were prominent across most of the equatorial Pacific Ocean (Fig. 4.5d) along with anomalous
          upper-level westerlies overlying them (Fig. 4.6d). These wind anomalies also reflect the further
          strengthening of the Walker circulation as per Bjerknes (1969).

            AU G U S T 2 0 2 1 | S t a t e o f t h e C l i m a t e i n 2 0 2 0                   4. THE TROPICS   S208
While global teleconnections are typically strongest following the peak of La Niña in the
boreal winter, there were extratropical circulation anomalies that resembled La Niña during
SON 2020. In particular, over the North Pacific Ocean, the retraction of the East Asia–North
Pacific jet stream was evident in the easterly wind anomalies from ~20°N to 40°N (Fig. 4.6d).
This signal was hemispherically symmetric, with a weakened jet stream also apparent across the
middle latitudes of the South Pacific Ocean. A wave train with positive height anomalies around
New Zealand, negative height anomalies near West Antarctica, and positive height anomalies
east of Argentina is reminiscent of the Pacific–South America pattern (Mo and Higgins 1998).
In addition to suppressed precipitation over Indonesia and Southeast Asia, La Niña is typically
associated with below-average precipitation anomalies over parts of the southwestern United
States and coastal southern Alaska, which indeed emerged during SON. Southern Brazil, Chile,
and Argentina, experienced below-average precipitation in SON, which has been shown to be
influenced by La Niña conditions (Ropelewski and Halpert 1989).
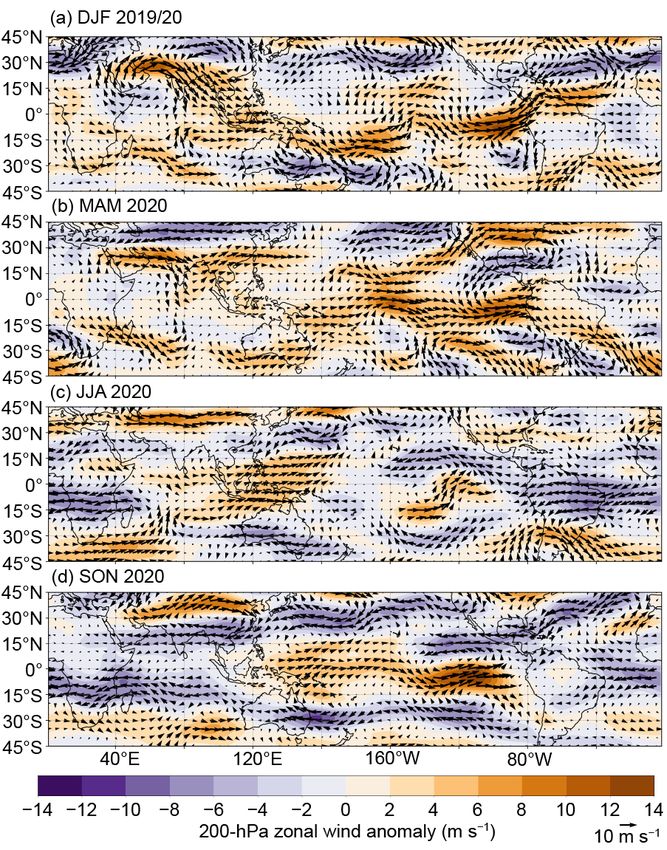
Fig. 4.5. Anomalous 850-hPa wind vectors and zonal wind speed during (a) DJF 2019/20, (b) MAM 2020, (c) JJA 2020, and
(d) SON 2020. The reference wind vector is located at the bottom right. Anomalies are departures from the 1981–2010
period monthly means. Data are from the NCEP/NCAR Reanalysis (Kalnay et al. 1996).
AU G U S T 2 0 2 1 | S t a t e o f t h e C l i m a t e i n 2 0 2 0 4. THE TROPICS S209Fig. 4.6. Anomalous 200-hPa wind vectors and zonal wind speed during (a) DJF 2019/20, (b) MAM 2020, (c) JJA 2020, and
(d) SON 2020. The reference wind vector is located at the bottom right. Anomalies are departures from the 1981–2010
period monthly means. Data are from the NCEP/NCAR Reanalysis (Kalnay et al. 1996).
c. Tropical intraseasonal activity—K. MacRitchie and C. Schreck
The Madden-Julian Oscillation (MJO; Madden and Julian 1971, 1972, 1994; Zhang 2005) and
convectively coupled equatorial wave activity (Wheeler and Kiladis 1999; Kiladis et al. 2009) are
the primary modes of tropical intraseasonal variability. The MJO is the leading mode of intra-
seasonal variability in the tropics and is characterized by an eastward-propagating convective
envelope generally traverses the globe in 30–60 days. Other convectively coupled equatorial
waves, such as atmospheric Kelvin and equatorial Rossby waves, are typically zonally narrower
and faster than the MJO. All of these waves affect weather patterns around the globe, though
the MJO has the most robust connections with midlatitude synoptic circulations (Knutson and
Weickmann 1987; Kiladis and Weickmann 1992; Mo and Kousky 1993; Kousky and Kayano 1994;
Kayano and Kousky 1999; Cassou 2008; Lin et al. 2009; Riddle et al. 2012; Schreck et al. 2013;
Baxter et al. 2014) and can impact monsoons (Krishnamurti and Subrahmanyam 1982; Lau and
Waliser 2012) and tropical cyclones (Mo 2000; Frank and Roundy 2006; Camargo et al. 2009;
Schreck et al. 2012; Diamond and Renwick 2015).
The MJO is often episodic, with periods of moderate-to-strong activity followed by little or no ac-
tivity (e.g., Matthews 2008). Common metrics for identifying the MJO include time–longitude plots
of anomalous 200-hPa velocity potential and outgoing longwave radiation (OLR; Fig. 4.7) and the
Wheeler-Hendon (2004) Real-time Multivariate MJO (RMM) index (Fig. 4.8). In the time–longitude
AU G U S T 2 0 2 1 | S t a t e o f t h e C l i m a t e i n 2 0 2 0 4. THE TROPICS S210Fig. 4.7. Time–longitude section of (a) OLR (Schreck et al. 2018) anomalies (W m−2) and (b) 200-hPa velocity potential
anomalies (× 10 6 m2 s −1) from the CFSR (Saha et al. 2014). Both variables are averaged over 10°S–10°N. Time increases
downward on this graph, beginning with Jan 2020 at the top and ending with Jan 2021 at the bottom. Negative anoma-
lies (green) indicate enhanced convection, and positive anomalies (brown) indicate suppressed convection. Contours
identify anomalies filtered for the MJO (black) and atmospheric Kelvin waves (red). Contours are drawn at ±12 W m−2 and
±4 × 10 6 m2 s−1 with the enhanced (suppressed) convective phase of these phenomena indicated by solid (dashed) contours.
Anomalies are departures from the 1981–2010 base period daily means.
plots, the MJO exhibits eastward propagation from upper-left to lower-right. In the RMM plots, the
MJO propagation and intensity are seen as large, counter-clockwise circles around the origin.
The MJO was more active during the first 5 months of 2020 than it was during the remain-
der of the year (Fig. 4.7, black contours). The strongest MJO activity occurred during January
(Fig. 4.8), with a zonal wave number 1 pattern across the tropical strip. The RMM index showed
an especially prominent signal over the Maritime Continent during mid-January (Fig. 4.8a),
which then weakened during February before strengthening again over the Indian Ocean
during March. This period of MJO activity projected more strongly onto the 200-hPa velocity
potential anomaly field (Fig. 4.7b) than the OLR anomaly field (Fig. 4.7a) or the 850-hPa zonal
wind anomaly field (Fig. 4.9a), which is a common characteristic of MJO events (Straub 2013).
The high-amplitude MJO activity coincided with a period of anomalously high sea surface
temperatures (SSTs) in the central and eastern Pacific (Fig. 4.2), resulting in positive Oceanic
Nino Index values (Fig. 4.1) and El Niño-like OLR anomalies (Fig. 4.7a). Strong MJO activity often
precedes El Niño events, but is often weak during La Niña events (Hendon et al. 1999; Zhang and
Gottschalck 2002; Zhang 2005). Zonal wind anomalies at 850-hPa were also enhanced during
this period (Fig. 4.9a), with westerly wind bursts (WWBs) evident in January and April across
the western and central Pacific. The WWB activity likely aided development of an oceanic Kelvin
wave, which began in January and continued through the April (Fig. 4.9a).
SST anomalies trended negative beginning in April (Fig. 4.1) and eventually developed La Niña
criteria during the July–September period. MJO activity also weakened substantially around this
time (Fig. 4.7). The primary intraseasonal convective variability during this period was a series of
prominent atmospheric Kelvin waves (Fig. 4.7, red contours), which move eastward with a smaller
scale and faster phase speed than the MJO.
AU G U S T 2 0 2 1 | S t a t e o f t h e C l i m a t e i n 2 0 2 0 4. THE TROPICS S211There were only two distinct MJO events in the second half of 2020: one in mid-July to early
September and one in late October through November. These types of events have been shown
to be particularly impactful for modulating tropical cyclone (TC) activity (Klotzbach 2010). They
likely contributed to the most active periods for TC activity over the North Pacific and North
Atlantic. The suppressed phase in late September–early October also contributed to a relative
lack of TC activity in the North Atlantic during that time.
The typical MJO structure features anomalous easterlies throughout the low levels of the
suppressed region of the convective envelope (Rui and Wang 1990), resulting in a surge of trade
winds throughout the Pacific. Indeed, trade wind surges are evident in the 850-hPa zonal wind
anomaly plot (Fig. 4.9a) during late August and November. Such trade wind surges are consistent
with La Niña conditions (see section 4b).
Fig. 4.8. Wheeler and Hendon (2004) RMM index for (a) Jan–Mar, (b) Apr–Jun, (c) Jul–Sep, and (d) Oct–Dec 2020. Each
point represents the MJO amplitude and location on a given day, and the connecting lines illustrate its propagation.
Amplitude is indicated by distance from the origin, with points inside the circle representing weak or no MJO. The eight
phases around the origin identify the region experiencing enhanced convection, and counter-clockwise movement is
consistent with eastward propagation.
AU G U S T 2 0 2 1 | S t a t e o f t h e C l i m a t e i n 2 0 2 0 4. THE TROPICS S212Fig. 4.9. (a) Time–longitude section for 2020 of anomalous 850-hPa zonal wind (m s−1) averaged for 10°N to 10°S. Contours
identify anomalies filtered for the MJO (black), atmospheric Kelvin waves (red), and equatorial Rossby waves (blue).
Significant WWBS and trade wind surges over the equatorial Pacific that resulted in notable downwelling and upwelling
oceanic Kelvin waves are dashed and dotted respectively. (b) Time–longitude section for 2020 of the anomalous equato-
rial Pacific Ocean heat content (°C), calculated as the mean temperature anomaly between 0–300-m depth. Yellow/red
(blue) shading indicates above- (below-) average heat content. Relative warming (dashed lines) and cooling (dotted lines)
due to downwelling and upwelling equatorial oceanic Kelvin waves are indicated. Anomalies are departures from the
1981–2010 base period pentad means. Data in (b) are derived from an analysis system that assimilates oceanic observa-
tions into an oceanic general circulation model (Behringer et al. 1998).
d. Intertropical convergence zones
1) Pacific—N. Fauchereau and B. Noll
Tropical Pacific rainfall patterns are dominated by two convergence zones, the Intertropical
Convergence Zone (ITCZ; Schneider et al. 2014) north of the equator and the South Pacific Con-
vergence Zone (SPCZ; Vincent 1994). Figure 4.10 summarizes the behavior for both convergence
zones during 2020 using rainfall estimated from satellite microwave and infrared data in a product
known as the Climate Prediction Center (CPC) Morphing Technique (CMORPH; Joyce et al. 2004).
Rainfall transects over 30°S to 20°N are presented for each quarter of the year, averaged across
successive 30-degree longitude bands, starting in the western Pacific at 150°E–180°. The 2020
seasonal variation is compared against the longer-term 1998–2019 CMORPH climatology.
Early in the year, the El Niño–Southern Oscillation (ENSO) phase was neutral, although an
area of above-average ocean temperatures was located in the west-central Pacific, with a spatial
signature somewhat similar to a weak, central Pacific El Niño (El Niño “Modoki”; see Ashok et al.
2007), although the Modoki condition is not a formal part of the ENSO section of this report (sec-
tion 4b). The transects for January–March (Fig. 4.10a) for the western and central Pacific (150°W–
150°E, especially 150°E to the date line) show that the SPCZ mean signature was shifted northeast
of its climatological position, while the ITCZ appears to have been displaced slightly equatorward
compared to normal. These anomalies were weak, but somewhat consistent with typical Modoki
patterns (Ashok et al. 2007).
AU G U S T 2 0 2 1 | S t a t e o f t h e C l i m a t e i n 2 0 2 0 4. THE TROPICS S213Fig. 4.10. Rainfall rate (mm day−1) from the CMORPH analysis for (a) Jan–Mar, (b) Apr–Jun, (c) Jul–Sep, and (d) Oct–Dec of
2020. The separate panels for each quarter show the rainfall cross-section between 30°S and 20°N (solid line) and the
1998−2019 climatology (dotted line), separately for four 30° sectors from 150°E–180° to 120°–90°W.
During boreal summer, an increase in
tropical trade winds contributed to cool-
ing ocean temperatures across the equa-
torial central and eastern Pacific. At the
end of 2020, it became more apparent that
the La Niña was of the non-traditional
central Pacific flavor, with the coolest
sea surface temperatures (SSTs) located
toward the central Pacific. Cooling SSTs
across the central and eastern Pacific
were accompanied with distinct shifts
in the ITCZ position and intensity: from
−1
Fig. 4.11. Rainfall anomalies (mm day ) from CMORPH analysis April to June, all sectors of the Pacific
for Dec 2020. The anomalies are calculated with respect to the (see Fig. 4.10b) showed an ITCZ shifted
1998–2019 climatology. north of its climatological position, with
rainfall rates within the convergence zone
exceeding climatological values. The ITCZ remained to the north of its usual position throughout
the remainder of 2020, a pattern broadly consistent with La Niña conditions.
Meanwhile, the position and intensity of the SPCZ showed large month-to-month variability.
During La Niña years, the SPCZ tends to be displaced to the southwest of its climatological posi-
tion and, conversely, the SPCZ northeast of its climatological position during El Niño years. The
SPCZ followed this pattern in the last quarter of 2020, as exemplified by anomalies recorded in
December (Fig. 4.11).
AU G U S T 2 0 2 1 | S t a t e o f t h e C l i m a t e i n 2 0 2 0 4. THE TROPICS S214Figure 4.12 shows a more detailed
comparison of the western Pacif ic
(150°E–180°) CMORPH rainfall tran-
sects for all years from 1998 to 2020.
In 2020, October–December (OND) has
a relatively clear La Niña signal. The
ITCZ intensified and was shifted north
of its climatological position, with the
strongest positive anomalous precipita-
tion rates on record between about 7°N
Fig. 4.12. CMORPH rainfall rate (mm day−1) for Oct–Dec, for and 9°N. Conversely, rainfall rates along
each year 1998 to 2019, averaged over the longitude sector the equator were among the lowest on
150°W–180°. The cross-sections are color-coded according to record, which was consistent with La
NOAA’s ONI, except 2020, which is shown in black. Dotted lines
Niña conditions (blue line on Fig. 4.12).
are individual years and solid lines are the average over all years
in each ENSO phase. Inset legend indicates how many years went
Farther south, the SPCZ position and
into each composite. intensity in OND 2020 was close to the
composite average during La Niña years.
2) Atlantic—A. B. Pezza and C. A. S. Coelho
The Atlantic ITCZ is a well-organized convective band that oscillates between approximately
5°–12°N during July–November and 5°S–5°N during January–May (Waliser and Gautier 1993;
Nobre and Shukla 1996). Equatorial atmospheric Kelvin waves can modulate ITCZ intraseasonal
variability (Guo et al. 2014). ENSO and the Southern Annular Mode (SAM) can also influence the
ITCZ on interannual time scales (Münnich and Neelin 2005). The SAM, also known as the Antarctic
Oscillation, describes the north–south movement of the westerly wind belt that encircles Antarctica.
A negative SAM event reflects an expansion of the westerly winds belt toward the equator, with
more abundant midlatitude precipitation in general (see Fig. 6.2c for monthly SAM values in 2020).
A relatively persistent pattern dominated the main South American climate signals for 2020.
For most of the year, the South Atlantic was warmer than normal, characterized by moist westerly
wind bursts near the equator, affecting the Atlantic ITCZ. Significant anomalies in low-pressure
systems dominated the 60°S latitude belt to the southwest of South America, with a corresponding
weak South Atlantic anticyclone (Fig. 4.13a). A mostly positive SAM pattern, later reinforced by a
rapid transition into La Niña from June onward, further reinforced the pattern above. As a result
of this persistence, a large portion of inland Brazil experienced severe precipitation deficits and
remarkable anomalous warmth, which escalated from September onward.
Fig. 4.13. Observed (a) tropical and SH MSLP anomaly (hPa) and (b) precipitation anomaly (mm day−1) for tropical and
subtropical South America and Africa for Jan–Dec 2020. MSLP anomalies are calculated with respect to a 1981–2010 cli-
matology derived from the NCEP/NCAR Reanalysis (Kalnay et al. 1996). Precipitation anomalies calculated with respect to
a 1998–2019 climatology are derived from CMORPH (Joyce et al. 2004).
AU G U S T 2 0 2 1 | S t a t e o f t h e C l i m a t e i n 2 0 2 0 4. THE TROPICS S215In contrast, the Atlantic ITCZ experienced mildly enhanced convective activity south of the
equator, with positive rainfall anomalies contrasting with the pattern for the tropics and subtrop-
ics (Fig. 4.13b). The ITCZ itself remained centered slightly north of its climatological position for
most of the southern rainy season. The Atlantic Index (Pezza and Coelho 2019), as defined by the
SST south of the equator minus the SST north of the equator over key areas of influence for the
ITCZ, reflected the role of the north–south gradient mechanism for 2020, with the ITCZ tending
to shift toward the warmer side of this gradient (Figs. 4.14a,b).
Fig. 4.14. (a) Atlantic ITCZ position inferred from OLR (Liebmann and Smith 1996) during Mar 2020. The colored thin lines
indicate the approximate position for the six pentads of the month. The black thick line indicates the Atlantic ITCZ climato-
logical position for Mar. The SST anomalies for Mar 2020 calculated with respect to the 1982–2019 climatology are shaded
(°C). The two boxes indicate the areas used for the calculation of the Atlantic index in panel (b), which shows monthly
OISST (Smith et al. 2008) anomaly time series averaged over the South Atlantic sector (SA region, 5°S–5°N, 10°–50°W)
minus the SST anomaly time series averaged over the North Atlantic sector (NA region, 5°–25°N, 20°–50°W) for the period
2016–20, forming the Atlantic index. The positive phase of the index indicates favorable conditions for enhanced Atlantic
ITCZ activity south of the equator.
AU G U S T 2 0 2 1 | S t a t e o f t h e C l i m a t e i n 2 0 2 0 4. THE TROPICS S216e. Global monsoon summary—B. Wang and Q. He
The global monsoon is the dominant mode of annual precipitation and circulation variability
and is a critical feature of Earth’s climate system. The tropical monsoon rainfall domain was first
defined by Wang (1994), who showed that a monsoon characterized by a rainy summer and dry
winter distinguishes an arid cli-
Table 4.1. Definition of the regional summer monsoon circulation indices mate (without a rainy season) from
and their Pearson correlation coefficients (r) with the corresponding equatorial regions where rainfall
regional summer monsoon precipitation indices for 1979/80–2019/20. All
circulation indices are defined by the meridional shear of the zonal wind
lacks a significant seasonal cycle.
at 850 hPa (or 700 hPa in highland southern Africa), which measures the The monsoon domain defined us-
intensity (relative vorticity) of the monsoon troughs except for northern ing precipitation characteristics
African (NAF) and East Asian (EA). The NAF monsoon circulation index is
defined by the westerly monsoon strength. The EASM circulation index
is shown in Fig. 4.15, and consists
is defined by the meridional wind strength, which reflects the east– of eight regional monsoons (Table
west thermal contrast between the Asian continent and the western 4.1). Figure 4.15 also shows global
North Pacific. The precipitation indices are defined by the areal mean
summer precipitation anomalies
precipitation over the blue box regions shown in Fig. 4.16. The correla-
tion coefficients were computed using monthly time series (164 summer in the Southern Hemisphere (SH)
months; June–September in NH [1980–2020] and December–March in SH during November 2019–April
[1979/80–2019/ 20]). Bolded numbers represent significance at the 99%
2020 and the Northern Hemi-
confidence level. (Adapted from Yim et al. 2014).
sphere (NH) during May–October
Regional monsoon Definition of the circulation index r 2020. Figure 4.16 shows temporal
U850 (5° –15°N, 40°–80°E) minus variations of summer monsoon
Indian (ISM) 0.70
U850 (25°–35°N, 70°–90°E) precipitation and low-level cir-
Western North Pacific (WNPSM)
U850 (5°–15°N, 100°–130°E) minus
0.82 culation indices for each of the
U850 (20°–35°N, 110°–140°E)
eight regional monsoons. The
East Asian (EASM) V850 (20°–40°N, 120°–140°E) 0.66
precipitation indices represent
North American (NASM)
U850 (5°–15°N, 130°–100°W) minus
0.85 the anomalous precipitation rate
U850 (20°–30°N, 110°–80°W)
averaged over the rectangular box
Northern African (NAFSM) U850 (0°–15°N, 60°–10°W) 0.68
regions, including both land and
U850 (20°–5°S, 70°–40°W) minus
South American (SASM) 0.81 ocean areas shown in Fig. 4.15.
U850 (35°–20°S, 70°–40°W)
Note that the precipitation aver-
U700 (15°S-0°, 10°–40°E) minus
Southern African (SAFSM)
U700 (25°–10°S, 40°–70°E)
0.63 aged in each box well represents
U850 (15°S–0°, 90°–130°E) minus
the precipitation averaged over
Australian (AUSSM) 0.89 the corresponding entire regional
U850 (30°–20°S, 100°–140°E)
monsoon domain (r > 0.90). The
Fig. 4.15. Seasonal mean precipitation anomalies (mm day−1) for (a) the SH summer monsoon season: Nov 2019–Apr 2020
and (b) the NH summer monsoon season: May–Oct 2020. Red lines outline the global monsoon precipitation domain. The
monsoon domain is defined by (1) the annual range (local summer minus winter) where precipitation exceeds 300 mm
and (2) the summer mean precipitation is >55% of the total annual precipitation amount, where summer is defined to be
May–Sep for the NH and Nov–Mar for the SH (Wang and Ding 2008). The dotted area represents the dry region where
the local summer precipitation rate is below 1 mm day−1. Precipitation indices for each regional monsoon are defined by
the areal mean precipitation in the corresponding rectangular regions (dashed blue), which are highly correlated with
the precipitation averaged over the corresponding real regional monsoon domains. Rainfall data were taken from the
GPCP (Huffman et al. 2009).
AU G U S T 2 0 2 1 | S t a t e o f t h e C l i m a t e i n 2 0 2 0 4. THE TROPICS S217Fig. 4.16. (a)–(h) Normalized summer mean precipitation (green) and circulation (red) indices for each of the eight regional
monsoons (Table 4.1). Indices were normalized by their corresponding standard deviation. Numbers shown in each panel’s
bottom right denote the correlation coefficient between the seasonal mean precipitation and circulation indices (sample
size: 41). Dashed lines indicate ±0.5 std. dev. The monsoon seasons are May–Oct for the NH and Nov–Apr for the SH. (Data
source: GPCP for precipitation and ERA-5 [Hersbach et al. 2020] for circulation.)
definitions of the circulation indices for each monsoon region are provided in Table 4.1. The pre-
cipitation and circulation indices are well-correlated in most regional monsoons, with correlation
coefficients ranging from 0.63 to 0.89 with a sample size of 164 summer months (Table 4.1). The
precipitation and circulation indices together provide consistent measurements of the strength
of each regional monsoon system.
Total seasonal rainfall over the NH monsoon region over land was the highest since the start
of the record in 1980 (Fig. 4.17). It was largely driven by the 2020 East Asian summer monsoon
(EASM), which was nearly 4 standard deviations above average (Fig. 4.16c). The Meiyu sea-
son (July–August), a typical rainy season over the Yangtze and Huaihe River Valleys (YHRV)
of China, doubled its climatological mean duration by 2 months in 2020. The May–October
AU G U S T 2 0 2 1 | S t a t e o f t h e C l i m a t e i n 2 0 2 0 4. THE TROPICS S218accumulated rainfall averaged over the
YHRV exceeded 750 mm, the most since
the start of the record in 1961 (Qiao et al.
2021). Associated severe flooding affected
about 45.5 million people and caused a
direct economic loss of more than 100
billion Chinese Yuan ($15.5 billion [U.S.
dollars]; Wei et al. 2020; see section 7g for
more details).
During the 2019/20 SH summer monsoon
season (November–April), precipitation
over the Maritime Continent–Australian
and South American monsoon regions
was substantially suppressed, while rain-
fall in the equatorial central Pacific and
the western Indian Ocean was markedly
enhanced (Fig. 4.15a). This contrast is due
to the anomalous Walker circulation as-
sociated with the warm Central Pacific sea
surface temperature (SST) anomalies even
though they did not reach the thresholds
Fig. 4.17. (a) NH summer (May–Oct) land monsoon precipitation for El Niño. The Indian Ocean rainfall
anomaly (green) normalized by its standard deviation. The clima-
anomalies were also driven by a positive
tological mean NH summer land monsoon precipitation (Mean)
phase of the Indian Ocean dipole (IOD;
and standard deviation (SD) are shown in the lower right panel
(mm day−1). Numbers shown in each panel’s top right denote the Saji et al. 1999) SST anomaly, which was
correlation coefficient between the seasonal mean precipitation +1.8°C during SH summer. The Australian
anomaly and the simultaneous Niño-3.4 index (red). Dashed lines summer monsoon produced precipitation
indicate ±0.5. (b) As in (a) except for the SH summer (Nov–Apr). 1.5 standard deviations below normal,
Note that the land monsoon precipitation excludes the monsoon with an associated reduced circulation
rainfall over the oceanic monsoon domain. (Data source: GPCP for
intensity (Fig. 4.16g). The South American
precipitation, HadISST and ERSSTv5 for SST.)
monsoon region also received precipita-
tion 1.5 standard deviations below normal, although the corresponding circulation’s strength was
near normal (Fig. 4.16h). Southern African summer monsoon precipitation and circulation intensity
were normal (Fig. 4.16f) due to a dipolar structure in eastern Africa (increased rainfall in equato-
rial East Africa and decreased rainfall near Madagascar). The increased eastern African rainfall
was largely caused by the positive phase of the IOD SST anomaly experienced from November
2019 to April 2020. During November 2019–April 2020, the IOD index is 1.82 standard deviations or
0.34°C (not shown). In fact, November 2019–April 2020 was the second-highest such period of the
IOD index. Overall, the SH summer monsoon showed a consistent reduction of precipitation and
weakening of the monsoon circulation, although there were various degrees of weakening in the
three SH regional monsoons.
During the 2020 NH summer monsoon season (May–October), precipitation over the Maritime
Continent was significantly above normal due to the rapidly developing La Niña, while there
was a noticeable reduction of precipitation in the equatorial Pacific Ocean and the Philippine
Sea (Fig. 4.15b). In addition to the unprecedented EASM strength, the summer precipitation over
both the Indian and northern African monsoon regions were also ~1.5 standard deviations above
normal, and the corresponding circulation intensity was >2 standard deviations above average
(Figs. 4.16a,b). The North American monsoon was characterized by near-normal precipitation and
circulation intensity (Fig. 4.16e), and the western North Pacific monsoon precipitation, which is
generally out of phase with the EASM, was about 1.5 standard deviations below normal (Fig. 4.16d).
AU G U S T 2 0 2 1 | S t a t e o f t h e C l i m a t e i n 2 0 2 0 4. THE TROPICS S219Monsoon rainfall over land has more significant socio-economic impacts than monsoon
rainfall over the ocean. Therefore, we specifically examine land monsoon rainfall. Global land
monsoon precipitation is strongly influenced by tropical SST anomalies, especially related to El
Niño–Southern Oscillation (ENSO; Wang et al. 2012). Figure 4.17 highlights that both NH and SH
land summer monsoon precipitation are well correlated with the simultaneous Niño-3.4, suggest-
ing that ENSO explains about 50% of their variance. Figure 4.17 shows that the total amount of
2020 NH land monsoon precipitation was the highest of any monsoon season in the record that
dates to 1980, whereas the 2019/20 SH land monsoon precipitation was below normal. However,
the 2020 La Niña cannot fully explain the record high NH land monsoon precipitation nor the
EASM extreme. Further study of the causes is warranted.
f. Indian Ocean dipole and unique Indian Ocean basin warming in 2020 —L. Chen and J.-J. Luo
Year-to-year climate variability in the tropical Indian Ocean (IO), which is largely driven by
local air–sea interactions and the El Niño–Southern Oscillation in the tropical Pacific, exerts
great influence on weather and climate in the regions surrounding the IO (e.g., Saji et al. 1999;
Luo et al. 2010; Xie et al. 2016). Among
them, the Indian Ocean dipole (IOD; Saji
et al. 1999) is an inherent air–sea coupled
mode in the tropical IO. The IOD usually
starts to grow in boreal summer, peaks in
autumn, and terminates rapidly in early
boreal winter in connection with the
reversal of monsoonal winds along the
west coast of Sumatra. As shown in Figs.
4.18a,b, a strong positive IOD event, with
anomalously warm waters to the west
and anomalously cool waters to the east,
occurred in 2019 and was of an extreme
intensity in the boreal fall of 2019 (Chen
et al. 2020).
Throughout 2020, the IOD index (also
known as the Dipole Mode Index) was
near zero, indicating a neutral IOD status
in 2020 (Fig. 4.18b). In the tropical IO, the
most remarkable feature was that sea
surface temperatures (SSTs) exhibited
warm anomalies over the entire tropi-
cal IO throughout 2020 (Fig. 4.18c, Figs.
4.19a–d). Following the early boreal win-
Fig. 4.18. (a) Monthly anomalies of SST (°C; solid lines) and pre-
ter of 2019/20, the extreme positive IOD
cipitation (mm day−1; dashed lines) for the eastern pole (IODE;
event rapidly terminated and then the 10°S−0°, 90°−110°E; blue lines) and the western pole (IODW;
tropical IO turned into an Indian Ocean 10°S−10°N, 50°−70°E; red lines) of the IOD. (b) As in (a), but for the
basin (IOB) mode (Figs. 4.18b,c). The IOB, IOD index (measured by the SST difference between the IODW
characterized by a basin-wide warming and IODE, green line) and surface zonal wind anomaly (m s ) in
−1
or cooling, is one of two dominant modes the central equatorial IO (Ucio; 5°S−5°N, 70°−90°E; black line). (c)
As in (a), but for SST anomalies in the Niño-3.4 region (5°S−5°N,
of SST anomalies in the tropical IO, and
170°−120°W; black line) and the tropical IO (IOB; 20°S−20°N,
the other is IOD. In March–May 2020, 40°−100°E; red line). Anomalies are relative to the 1982−2020 base
above-average SST anomalies were ob- period. (Sources: NOAA OISST [Reynolds et al. 2002]; monthly
served over the tropical IO, and positive GPCP precipitation analysis [available at http://precip.gsfc.nasa
precipitation anomalies dominated the .gov/ ]; and JRA-55 atmospheric reanalysis [Ebita et al. 2011].)
AU G U S T 2 0 2 1 | S t a t e o f t h e C l i m a t e i n 2 0 2 0 4. THE TROPICS S220You can also read