State of the Economy
               Housing Market Conditions

                                        for

Trafford Council (Local Planning Authority)

                          November 2018
←
→
Page content transcription
If your browser does not render page correctly, please read the page content below
State of the Economy
Housing Market Conditions
for
Trafford Council (Local Planning Authority)
November 2018
State of the Economy
Housing Market Conditions

Contents
Executive summary..................................................................................................................................................2
1. Introduction .........................................................................................................................................................3
   1.1 Scope & Purpose ............................................................................................................................................................ 3
   1.2 Methodology .................................................................................................................................................................. 3
   1.3 Background and Documents Supplied ........................................................................................................................... 4
       1.3.1 Housing Market Conditions and Affordable Housing Policy ..................................................................4
   1.4 Structure ......................................................................................................................................................................... 4
2. Housing Market Conditions .................................................................................................................................5
   2.1 Introduction.................................................................................................................................................................... 5
   2.2 Volume of Sales Methodology ....................................................................................................................................... 6
       2.2.1 Trafford ...................................................................................................................................................7
       2.2.2 Cold Market Areas ..................................................................................................................................8
       2.2.3 Moderate Market Areas .......................................................................................................................10
       2.2.4 Hot Market Areas .................................................................................................................................11
   2.3 House Price Change ...................................................................................................................................................... 12
       2.3.1 Trafford .................................................................................................................................................13
       2.3.2 Cold Market Areas ................................................................................................................................14
       2.3.3 Moderate Market Areas .......................................................................................................................15
       2.3.4 Hot Market Areas .................................................................................................................................16
   2.5 Findings ........................................................................................................................................................................ 17
3. New Build Housing Market Conditions..............................................................................................................17
   3.1 Introduction.................................................................................................................................................................. 17
   3.2 Development Activity ................................................................................................................................................... 18
   3.3 New Build Sale Values .................................................................................................................................................. 20
   3.4 Findings ........................................................................................................................................................................ 21
4. Development Costs............................................................................................................................................22
   4.1 Introduction.................................................................................................................................................................. 22
   4.2 Build Costs .................................................................................................................................................................... 22
5. Recommendation ..............................................................................................................................................23
Appendix ................................................................................................................................................................24
   1. Section 2 Prediction Methodology ................................................................................................................................. 24
   2. Affordable Housing Market Zones ................................................................................................................................. 25

                                                                                                                                                                                   Page 1
State of the Economy
Housing Market Conditions
EXECUTIVE SUMMARY
The Commission and Task
Trebbi Continuum have been instructed by Trafford Council to provide specialist advice in respect of the
current state of the borough’s housing development market. The purpose of this is to inform affordable
housing policy requirements which are variable depending on market conditions.
By tying planning policy to market conditions, a consideration of value and cost is required. What this report
seeks to ascertain is, based on the performance level of the market, determined through sales activity and
price achieved, are developers generating a higher level of return to permit the funding of greater affordable
housing commitments? If sales activity and values are looked at in isolation, it could be that an argument is
made that although values are increasing, costs are also increasing at a similar or high rate. The result being,
that there are not additional funds generated through the development process to permit the delivery of a
higher quantum of affordable housing.
We were instructed to follow a similar structure to Peter Brett Associates (PBA), in their 2015 State of the
Economy report, in their approach to determining market conditions. This was to analyse the housing market
condition for Trafford borough, with its three distinctive market areas (based on demand and development
activity) by looking at volume of sales and house price change. Land registry data was used for this analysis.
The conclusion of the PBA 2015 report was:
“The model suggests that for Trafford as a whole (where the size of the data set gives a more robust finding)
market conditions are returning to ‘normal’. However, it may be prudent to await for 2015 showing whether
this improvement has been sustained before any change in policy approach is made” (para. 2.6).
In addition to the information contained in the PBA report, there will be an analysis of new build sale values,
development activity (through planning application residential unit numbers) and build cost across the three
distinct market areas. Data that is available to the Local Authority will be used to help inform this analysis.
Following the analysis of all the above a model will be created that allows market conditions to be determined
on a regular basis with an associated output of identifying the impact on Affordable Housing provision based
on any change in market conditions.
In addition to the above outcome there will be a detailed assessment of whether prevailing housing market
conditions in the Trafford Borough housing market areas should be considered poor, normal or good and set
out our findings accordingly. The conclusion in the PBA 2015 report that “market conditions (in 2014) are
returning to normal” is the base line.
Findings and Recommendation
From the perspective of considering planning applications, the prognosis for Trafford Borough is now ‘good’.
Housing markets in areas such as Old Trafford are experiencing dynamic change. For new schemes being
promoted through the planning system, the comparators are now new and recently completed schemes.
Earlier in the decade the evidence base used for assessing the value of new housing (after an extended period
of low activity) was existing stock. This is no longer the case. Values for new and recently completed schemes
are appreciably higher than that of existing stock (pre-2005 construction).
For the purpose of considering planning applications, the level of development activity across the borough, is
at a high. Developers no longer consider any location as performing ‘poorly’. There is an expectation that new
build (apartments and housing) will achieve the required values to fund all costs, including profit. This, we
believe, is the best indicator of those pursuing planning applications and delivering development experiencing
‘good’ conditions. There is no longer a need for the Authority to intervene in the normal workings of the
market to incentivise developers.
Page 2State of the Economy
Housing Market Conditions
1. INTRODUCTION
1.1 Scope & Purpose
Trebbi Continuum has been instructed by Trafford Council to provide specialist advice in respect of the current
state of the borough’s housing development market. The purpose of this is to inform affordable housing policy
requirements which are variable depending on market conditions.
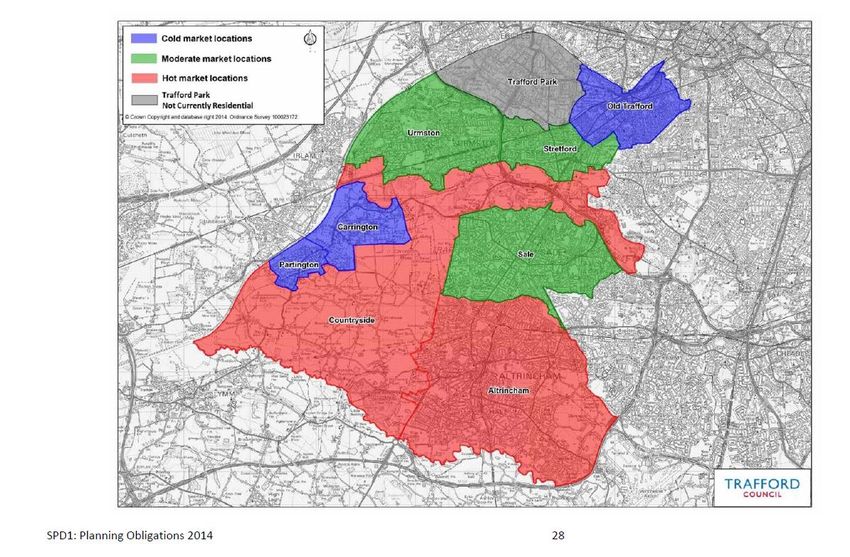
1.2 Methodology
Trafford Council’s affordable housing policy (Core Strategy Policy L2) is based on a special distinctions
approach where sub markets have been identified. The zones identified are Hot, Moderate and Cold (Appendix
1). These markets have different thresholds and percentage requirements for the provision of Affordable
Housing on development sites. The policy targets for each market area are also variable according to whether
housing market conditions are considered to be ‘poor’, ‘normal’ or ‘good’.
To identify the market area conditions, a previous report by Peter Brett Associate (PBA) in 2015, used two
major indicators to analyse the health of the housing markets, these were volume of sales and house price
change. The data used is freely available from the Land Registry, Zoopla and Rightmove. The analysis was at a
borough-wide level in respect of cold, moderate and hot market areas. This report uses updated data sets to
assess the housing markets across Trafford in 2017. The data set only goes up to the year 2017 as it is the only
latest full year data set for the submarkets.
The conclusion of the PBA 2015 report was:
“The model suggests that for Trafford as a whole (where the size of the data set gives a more robust finding)
market conditions are returning to ‘normal’. However, it may be prudent to await for 2015 showing whether
this improvement has been sustained before any change in policy approach is made” (para. 2.6).
The above conclusion reached by PBA was that the market had experienced positive change post 2011/12.
This report seeks to confirm that the changes identified from analysing 2014 data were “sustained” through
2015 and assess if the housing market post 2015 has continued this dynamic change. The update to the PBA
findings is essential to provide a robust, evidenced position from which the Authority can review its Policy
position. In addition to following the approach to data collection and analysis from the PBA 2015 report, we
have sourced new data to help identify change in market area conditions. The reason being that the data in
the research undertaken by PBA to determine Trafford Council’s affordable housing policy (Core Strategy
Policy L2) market conditions, was mainly made up of second-hand property market transactions. When
considering planning applications and the prognosis for the housing market in Trafford, we believe the best
indicators for deciding whether Trafford Borough is operating under poor, normal or good conditions is data
on new build properties. This is because affordable housing policy only affects new build product which usually
operates differently to the existing product in the market. We have therefore used two indicators in order to
assess the new build property market, which are development activity and new build house price change. This
data has been sourced from market knowledge of new build schemes that are currently under construction as
well as planning application data supplied by Trafford Council.
We have also analysed development costs across the borough in order to understand how much they have
increased since the previous PBA report in 2015 was written and have compared this increase to new build
sale value increase over the same period. Cost data has been analysed in order to examine whether the
increases in sale values have outstripped the increases in build costs. This is in order to assess the relationship
between cost and value for development projects when considering issues relating to Viability. If values are
growing at a stronger pace than costs, then for new projects, the market is performing better year on year.
Page 3State of the Economy
Housing Market Conditions
1.3 Background and Documents Supplied
The following documents have been provided by Trafford Council:
Trafford Council Revised SPD1 – Planning Obligations, 2014
Peter Brett Associates 2015 Report – State of the Economy
Developer Viability Appraisals Submitted to Trafford Council
Planning Application (validated) Data – Including Number of Residential Units
1.3.1 Housing Market Conditions and Affordable Housing Policy
Trafford Council’s affordable housing policy (Core Strategy Policy L2) is based on a special distinctions
approach where sub markets have been identified. The policy targets for each market area are also variable
according to whether housing market conditions are considered to be ‘poor’, ‘normal’ or ‘good’. Below is a
table which shows the affordable housing targets based on each identified sub market and market conditions:
Table 1: Trafford’s Affordable Housing Targets based on Sub Market’s and Market Conditions
Sub Market Poor Normal Good
Cold 0% 5% 10%
Moderate 10% 20% 25%
Hot 40% or decreased as is deemed 40% 45%
necessary on an individual site basis
There is also a 40% Affordable Housing provision required for where the nature of the development is such,
that in viability terms, it will perform differently to generic developments within a specific market location. The
affordable housing contribution will be determined via a site-specific viability study and will not normally
exceed 40%. This will apply in the case of most of the strategic locations.
The split between intermediate and social rented is 50/50 of the provision. The minimum threshold for
qualifying sites in Trafford’s SPD1 is 5 residential units in the borough’s Hot and Moderate market locations
and 15 within the borough’s Cold market locations. However, the PPG on Planning Obligations (2015) outlines
the circumstances in which contributions for affordable housing and tariff-style planning obligations should
not be sought from small scale and self-build development, as well as policy on vacant building credit. These
circumstances are as follows:
“Contributions should not be sought from developments of 10-units or less, and which have a
maximum combined gross floorspace of no more than 1,000 square metres (gross internal area)
In designated rural areas, local planning authorities may choose to apply a lower threshold of 5-units
or less. No affordable housing or tariff-style contributions should then be sought from these
developments. In addition, in a rural area where the lower 5-unit or less threshold is applied, affordable
housing and tariff style contributions should be sought from developments of between 6 and 10-units
in the form of cash payments which are commuted until after completion of units within the
development. This applies to rural areas described under section 157(1) of the Housing Act 1985, which
includes National Parks and Areas of Outstanding Natural Beauty.
Affordable housing and tariff-style contributions should not be sought from any development
consisting only of the construction of a residential annex or extension to an existing home.” (DCLG
(2016), PPG, Planning Obligations, para 31).
1.4 Structure
In order to meet the scope and purpose described above, the report has been divided into 3 main sections,
followed by our recommendation. These mains sections are:
Section 2: Uses the same approach as PBA to examine the market area conditions. This is based on
Land Registry data for volume of transactions and house price change.
Page 4State of the Economy
Housing Market Conditions
Section 3: Uses an approach designed to examine current and predicted market area conditions. This is
based on the new build property market. It uses two indicators; development activity as evidenced
through Planning Applications and new build sale value change.
Section 4: Analyses the development costs across the borough in order to understand how much they
have increased since the previous PBA report in 2015 was written. This is analysed in order to examine
whether the increases in sale values have outstripped the increases in build costs.
2. HOUSING MARKET CONDITIONS
2.1 Introduction
Trafford Council’s affordable housing policy (Core Strategy Policy L2) sets variable affordable housing targets
according to whether market conditions are poor, normal or good. Two indicators of Residential property
market conditions that PBA used in their previous report to inform Trafford Council’s affordable housing policy
were:
The volume of residential property transactions, indicating the level of activity in the market; and
House price change.
Our concern is that by using this method of analysing the performance of a market it immediately bases
conclusions in an historic context. Land Registry data will be for transactions one year before the date of
report publication (for sub markets). In addition, there is no differential between existing stock and new build.
The health of a market can best be assessed by the level of activity in the new build sector. Land buyers and
Developers become active in areas where change is occurring or is predicted. Entering the market at the
optimum time can result in high levels of return as profits are based on a percentage of sale value achieved. If
values are increasing year on year, developers will seek to fix costs; land, construction, at an early stage and
then benefit from the increase (generating an enhanced profit return) over a projects life. An increase in the
number of planning applications being made and units being built is the best indicator of the perception of
how a market is performing or will perform Historic data is useful to set context but if used in isolation can
lead to false conclusions.
As stated earlier, we have entered a dynamic phase in a number of Trafford’s housing sub markets. The
context of previous data collection and analysis was very different from a macro-economic context. The
number of average monthly house sales across the borough needed to be considered in relation to the
prevailing economic climate at the time. For example, following the economic crisis of 2008, there was a
dramatic reduction in all new build activity. Following 2012 there has been strong recovery in the housing
sector but there has been a limited supply of new homes and apartments, which has had an effect on the
number of annual transactions. The planning and development activity in Trafford through 2016 and 2017 will
result in a substantial number of new build properties coming to the market, which will have a big positive
impact on average yearly transactions over coming years. This new economic context is the key reason for the
Trafford housing market to be re-analysed.
Percentage change in annual house prices, as a criterion to assess the performance of a housing market, has
the potential to generate unintended conclusions. Dividing the total paid for all housing by the number of
houses sold, generates an average price. This average house price will cover all types and ages of property. A
year where there are a small number of transactions of large properties will generate a high average price per
property. If in the following year a greater number of properties are sold but smaller in size then the data
reports that there has been a drop in average prices. The conclusion reached is the average house prices have
fallen. This does not result in prices of housing falling, it is just the result of assessing a very large data set that
is identifying averages.
Page 5State of the Economy
Housing Market Conditions
The percentage change annually that is measured using the Land Registry data is the average house price of
the properties transacted that year. This should not be conflated with changes in house prices. For example,
house prices in good markets (2015 report) are not rising at over 10% per annum.
The two indicators above are easily measured through readily available data from the Land Registry. Land
Registry data dates back to 1995 and provides over 20 years of data to inform the analysis of the Residential
property market conditions.
We have analysed the data for Trafford as a whole, as well as for the individual sub market areas which is
outlined in the report below. Our data set ranges from 1995 to 2017 and allows us to analyse the most recent
year’s data against the 23-year average. This is then analysed, and we have then applied the PBA methodology
for determining whether the current market conditions in each sub market area should be considered poor,
normal or good. The PBA methodology establishes a long-term average for the two indicators and then
establishes parameters around the average that can be used to define what are broadly normal levels of
market activity and what would be considered poor or good.
2.2 Volume of Sales Methodology
The volume of sales, which is the number of houses transacted over a given period of time, is analysed as it
enables us to gauge the level of market activity within a given location. The level of market activity is one
measure that can be used to evaluate the health of the market. It is possible to define the long-term average
volume of sales over the 23-year period data set and then establish parameters around this long-term average
in order to represent ‘normal’ market conditions. This will mean that if the volume of sales in a given year is
below the normal level would indicate that market conditions are poor in this health indicator and similarly if
the volume of sales in a given year is above the normal level, it would indicate that market conditions are good
in this health indicator. As stated earlier, the predicted increase in the number of transactions based on
planning activity and developments currently under construction will result in activity being at good levels
during 2018/2019, from normal levels in 2014 to 2017.
The data set used is the Land Registry’s residential transaction data from 1995 to 2017. The Land Registry
provide records on every residential transaction that takes place, including the date, location and price. This
data set has been used to determine the average number of sales per month over each calendar year.
What the graphs are showing is the workings of the development cycle in the context of macro-economic
conditions. Average monthly transactions, as demonstrated in figure 2.1 below, were affected by the impact of
the recession beginning late 2007. Recovery has been a long process. As can be seen in figure 2.1, market
conditions between 2002 and 2007 consistently resulted in over 400 transactions per month (with the
anomaly of 2005), this is a strong indication of how the Trafford market operates when market conditions are
good, with demand and supply aligned. From 2008, the graph demonstrates that demand was curtailed as a
result of the economic crisis which impacted supply. The reduction in demand has an immediate impact on
supply as developers restrict the number of units brought forward and a future impact as developers severely
reduced the number of schemes being promoted through the planning system. The knock-on effect is that the
market takes a long time to recover from major economic shocks, as supply runs behind demand. Due to the
number of schemes under construction, consented and validated in the planning system, supply is set to meet
demand in 2018 and reflect the good market conditions experienced between 2002 and 2007.
The housing market both reflects and responds to the economic cycle. Due to the length of time involved in
acquiring land, pursing planning applications and then constructing homes (anecdotally 3 years from inception
to physical delivery), supply in a given year reflects predicted demand. From a Trafford context the level of
activity manifested by planning consents and validated planning applications (section 3.2), demonstrates a
greater level of supply over the next three years, which will result in a higher number of transactions.
Page 6State of the Economy
Housing Market Conditions
In order to define ‘normal’ market conditions in each location, the data has been used to establish a long-term
average of the transactions per month (over 23 years). We have then followed the same parameters
established by PBA regarding the average that is used to define what are normal levels of market activity and
what would be considered good or poor. This is at ±10% either side of the long-term average (PBA defined
parameter). The long-term average reflects the number of units transacted per month which based on the 23-
year data period is 325 for the Trafford market as a whole (figure 2.1). 10% increase reflects transaction per
month of circa. 357 (average), this is represented by the green line on the graph. 10% decrease reflects
transactions per month of circa. 292 (average), this is represented by the red line on the graph. We predict
that based on market activity and a substantial increase in supply that over the coming three years average
transactions per month will be greater than 357.
2.2.1 Trafford
Figure 2.1 shows the findings of the volume of sale analysis for the borough as a whole using the Land
Registry’s residential transaction data from 1995 to 2017.
Figure 2.1: Average Monthly Transactions - Trafford
450
400
350
300
250
200
150
100
50
0
Projected Data
Source: Land Registry.
Following the methodology set out in 2.2 above, the pattern shown in Figure 2.1 broadly follows the national
trend of the housing market over the last 23 years. The average number of transactions per month in Trafford
over the 23-year period is 325. 1995 has a relatively low number of transactions at 255, this is because the UK
economy was just beginning to emerge from the early 1990s recession and indicates a relatively poor market
condition at that time.
1996 to 2007 was an extended period of healthy market conditions. This can be seen by the average monthly
transactions situated between the moderate and good conditions of this market health indicator. The sudden
decrease in market transactions as a result of the 2008 global financial crisis is shown by the vast contrast
between activity levels in 2007 and 2008.
Page 7State of the Economy
Housing Market Conditions
The graph shows a marginal increase in activity from 2008 to 2013, however, the number of transactions
remained very low in comparison to the long-term average. This was a period of recovery in the Trafford
market.
The graph demonstrates that from 2014 to 2017 the Trafford housing market has recovered, with the number
of transactions per annum reflecting pre-2008 levels. Using the health indicator methodology, conditions
over the 4 year period were ‘normal’. This supports the conclusion of the 2015 PBA report.
PBA in their 2015 report, recommended that a further review be undertaken to confirm that improvement in
housing market conditions had been “sustained” through 2015. Rather than looking back to clarify pre-existing
market conditions, through a review of additional data relating to planning consents granted and planning
applications validated across Trafford, the data that populates the health indicator, market activity can be
predicted for 2018, 2019 and 2020. The parameters that have been set for determining how a housing sub
market can move from normal conditions (current) to good conditions can be informed by the number of new
units under construction, the level of pre-completion sales activity and the number of new units planned to be
constructed over the 3 year period identified. The estimate of units transacted year on year, 2018 – 2020 is
based on sound methodology (see appendix 1 which explains in detail how the evidenced has been sourced
and figures predicted regarding planning, construction and sale activity). A number of schemes consented in
2016 and 17 are now under construction. The level of pre-sales will mean that once the schemes are
completed, there will be a substantial increase in transactions in the month of that completion. This is in
addition to sales activity in the second hand market. The impact will be an increase in total transactions in a 12
month period. The level of construction activity is set to continue through 2019 and 2020. The number of
units currently consented or being promoted through the planning system is at a high level.
It is understood that there is no direct correlation between consents granted and units delivered. The
reasoned assumption is that should the macro economic position continue as at present then developers
benefitting from consents will begin implementation within three years. Should there be an economic shock
then this document will require a review.
2.2.2 Cold Market Areas
Figure 2.2 shows the findings of the volume of sale analysis for the cold market area in Trafford using the Land
Registry’s residential transaction data from 1995 to 2017.
Page 8State of the Economy
Housing Market Conditions
Figure 2.2: Average Monthly Transactions - Cold Market Area
120
100
80
60
40
20
0
Projected Data
Source: Land Registry.
The average number of transactions in the cold market area is substantially lower than the other sub market
areas at an average of 60 transactions per month over the 23 year period of the data.
Figure 2.2 shows the cold market area follows a similar pattern to that of the borough-wide assessment, with a
low base in 1995, a long period of good market conditions which is then followed by the sharp fall in 2008 due
to the financial crisis. The recovery from the early 1990s recession, however, took somewhat longer in the cold
market area than in the borough-wide data. It should also be noted that the subsequent ‘boom’ years
especially the period from 2002 to 2007 is considerably above the upper normal to good boundary.
The period between 2008 to 2013 fluctuated more than the borough wide-assessment, with some years
seeing an increase in the number of transactions and others a decrease. This was a period of recovery in the
Trafford market.
The graph shows that from 2014 to 2017 the cold market area has shown a similar pattern to the borough-
wide assessment in that the Trafford market recovered from the 2008 recession, with the number of sales
transactions demonstrating normal conditions being maintained in the market health indicator.. It should be
noted that the 2017 data demonstrates slightly lower than normal conditions on the market health indicator,
which is strongly linked to the lack of availability of new product. The trajectory of number of sales
transactions per annum is upward from 2012. Market conditions did not reverse in 2017. Values continued to
rise for existing and new stock. This anomaly is put down to supply not meeting demand due to a ‘lag’ in new
developments coming forward.
Based on the planning and development activity in Partington, Carrington and Old Trafford, we have predicted
the average annual transactions for 2018, 2019 and 2020 will be circa 1,400 because of the substantial
increase in planning and development activity in 2017 and 2018 (see section 3.2). Schemes such as Pomona
phase 1 and No1 Old Trafford are under construction (in Old Trafford). Both have received high levels of pre-
completion transactions (we have sourced the data based on estate agent websites). In Partington there are
Page 9State of the Economy
Housing Market Conditions
two validated planning applications that combined, will deliver in excess of 1,000 new homes and in Old
Trafford there are consented schemes and validated planning applications that will deliver circa. 3,000 new
homes. These new schemes will be added to annual activity in the second hand market. There is a strong
evidence base (units consented and under construction) to support our assertion that the identified cold
markets will again achieve their 2006 figure of 120 units sold per month circa 1,400 units per annum,
demonstrating good market conditions. The average over the 23 year period of the data is 720 units.
2.2.3 Moderate Market Areas
Figure 2.3 shows the findings of the volume of sale analysis for the moderate market area in Trafford using the
Land Registry’s residential transaction data from 1995 to 2017.
Figure 2.3: Average Monthly Transactions - Moderate Market Area
300
250
200
150
100
50
0
Projected Data
Page 10State of the Economy
Housing Market Conditions
Source: Land Registry.
The number of transactions in Trafford’s moderate market area is around 3 times higher than in the cold
market areas at an average of 193 per month, circa 2,300 per annum over the 23-year period.
Figure 2.3 shows that the pattern exhibited by the moderate market area is very similar to that for Trafford
borough as a whole and contrasts slightly with the cold market area. Transactional activity was relatively low
at the start of the period as the UK recovered from the 1990s recession. This was followed by a decade of high
activity levels in the market before the sharp fall in 2008 due to the financial crisis. Then from 2008 to 2013
there was a marginal increase in activity as the market recovered from the recession. From 2014 to 2017 the
moderate market area activity levels had recovered and are now operating at normal levels.
Based on the planning and development activity in Sale, Stretford and Urmston, we have predicted the
average monthly transactions for 2018, 2019 and 2020 will have returned to their pre-2008 levels. We have
estimated that the average monthly transactions during this three-year period will be circa 250 transactions,
the average for the period between 2002 and 2007, which reflects circa 3,000 transactions per annum. This is
based on the substantial increase in planning and development activity between 2014 and 2016/17 (see
section 3.2), resulting in a more new homes coming onto the market and the level of second transactions
being maintained. The data demonstrates that the moderate market area has been operating in normal
conditions since 2014. We predict that the Moderate market area, the area with the greatest amount of
transactional activity, has moved to good market conditions in 2018 and that will be maintained through to
2020.
2.2.4 Hot Market Areas
Figure 2.4 shows the findings of the volume of sale analysis for the hot market area in Trafford using the Land
Registry’s residential transaction data from 1995 to 2017.
Figure 2.4: Average Monthly Transactions - Hot Market Area
200
180
160
140
120
100
80
60
40
20
0
Projected Data
Source: Land Registry.
Page 11State of the Economy
Housing Market Conditions
The average number of transactions in the hot market area over the 23-year period is 132 per month, 1,584
per annum. This is substantially fewer than in the moderate market areas reflecting the wider area covered
under the moderate market as well as the more densely developed character of the moderate areas. The hot
market is two times higher than the cold market area.
Figure 2.4 shows that the hot market area follows a remarkably similar pattern to that of the moderate market
area and Trafford borough as a whole. Transactional activity was relatively low at the start of the period as the
UK recovered from the 1990s recession. This was followed by a decade of high activity levels in the market
before the sharp fall in 2008 due to the financial crisis. Then from 2008 to 2013 there were marginal increases
in activity as the market recovered from the recession. From 2014 to 2017 the hot market area activity levels
had recovered and are now operating at normal levels.
Based on the planning and development activity in the hot market area, we have predicted the average
monthly transactions for 2018, 2019 and 2020, will reflect the performance of the area from 2002 to 2007
where there was an average of circa 165 units sold per month, 1,980 per annum We have estimated that the
average monthly transactions during this three-year period will be circa 150 per month, 1,800 per annum due
to the substantial increase in planning and development activity from 2014 to 2016/17 (see section 3.2). ,
resulting in a more new homes coming onto the market and the level of second transactions being maintained.
The data demonstrates that the hot market area has been operating in normal conditions since 2014. We
predict that the hot market area has moved to good market conditions in 2018 and that will be maintained
through to 2020.
2.3 House Price Change
In order to assess house price changes in the PBA 2015 report, Land Registry data was also used for Trafford as
a whole and the three distinct market areas. Change in averages in relation to house prices was calculated year
on year in order to show the percentage uplift or drop each year.
The graphs below demonstrate the change in average house prices across the Trafford housing market over a
23-year period. The x axis (horizontal) demonstrates the average price (total sales receipts divided by number
of units sold) in the particular year. For example, 2006 figure is the change experienced in that year in
comparison to the average of the previous year. In monetary terms, the average price in 2005 was circa.
£223,000 and the average price in 2006 was circa. £227,500. The graph is demonstrating the change in average
year to year which is 1.98%. The data does not reflect a fall in the average, it is showing a smaller increase.
2009 does show a reversal in the average of circa. 9%, which can be explained by the reduction in the number
of transactions and those transactions being of properties with the value in the lower to median quartile.
What the graph is not saying is that house prices dropped by 9% across Trafford in 2009.
The prediction for the years 2018 to 2020, is that due to the increase in development activity of all types of
houses (see section 3.2), that sale values achieved will be greater for new than for existing second-hand stock
(see section 3.3). The balance between new and second-hand stock will continue to shift in favour of new,
resulting in a similar profile to that of 2000 to 2004.
In order to determine normal, poor and good market conditions, the same parameter as PBA used in their
2015 report was set alongside the long-term average as was achieved through the market activity assessment..
PBA set the parameter as the average percentage change calculated year on year over the 23-year period
which from 1996 to 2017 is +6.89% for Trafford market as a whole. They then determined the performance of
that market by setting the figure of +6.89% as normal. Then a +50% increase in the percentage average was
used to determine good market conditions (green line), which was +10.33% for Trafford market as a whole. As
well as a -50% decrease in the percentage average was used to determine poor market conditions (red line),
which was +3.44% for Trafford market as a whole.
Page 12State of the Economy
Housing Market Conditions
2.3.1 Trafford
The percentage change in annual house prices for Trafford as a whole is shown in figure 2.5 below.
Figure 2.5: Percentage Change in Averages in Relation to Annual
House Prices - Trafford
25.00%
20.00%
15.00%
10.00%
5.00%
0.00%
-5.00% Projected Data
-10.00%
-15.00%
Source: Land Registry.
The long-term change in averages in relation to annual house prices across Trafford borough is 6.89%. The
parameters of normal market conditions in relation to averages are between 3.44% and 10.33%. Change in
averages below 3.44% is considered to represent poor market conditions and change above 10.33%, good
market conditions.
The above figure demonstrates the relationship between number of sales and total capital receipts in a
twelve-month period. For the purposes of clarity, the above percentages do not reflect the workings of the
housing market. This report does not suggest that house prices are rising at 10% per annum when under
‘good’ market conditions. What it is identifying is the percentage change in the average. If the average value
based on dividing the number of transactions from the total money received is maintained at positive 10.33%
per annum then good conditions prevail.
As we have done with the volume of transactions, we have predicted percentage changes in averages for
2018, 2019 and 2020 based on planning and development activity. The average is created by dividing the total
receipts received by the number of transactions. The greater the number of transactions and the higher the
price for each transaction will drive up the change in the average. From market knowledge of schemes such as
Pomona Phase 1 and No1 Old Trafford, pre-sales values are at new market levels for their location. During
2019 when the schemes are completed, a large number of sales transactions will be reported at a price above
previous market expectation. This will drive up the average price in the Old Trafford sub market and across the
whole borough. The change in average will have the greatest impact in the cold market areas. These are the
areas with (historically) the lowest values and activity levels. High levels of activity in these previously
underperforming locations based on the delivery of new development, will have a marked impact on positive
changes in the average across the borough as a whole. The requirement, as demonstrated by the above graph
Page 13State of the Economy
Housing Market Conditions
to achieve an improvement in the average of 10.33% and above, which as can be seen, was achieved in every
year from 1999 to 2005, to demonstrate a market operating in good conditions is a well-argued assertion.
2.3.2 Cold Market Areas
Figure 2.6 shows the percentage change in annual house prices for the cold market area.
Figure 2.6: Precentage Change in Averages in Relation to Annual
House Prices - Cold Market Area
35.00%
30.00%
25.00%
20.00%
15.00%
10.00%
5.00%
0.00%
-5.00%
Projected Data
-10.00%
-15.00%
Source: Land Registry.
The long-term change in averages in relation to annual house prices across the cold market area is 7.03%. The
parameters of normal market conditions in relation to averages are between 3.52% and 10.55%. Change in
averages below 3.52% is considered to represent poor market conditions and change above 10.55%, good
market conditions.
The above figure demonstrates the relationship between number of sales and total receipts generated from
sales in a twelve-month period. For the purposes of clarity, the above percentages do not reflect the workings
of the housing market. This report does not suggest that house prices are rising at 10% per annum when under
‘good’ market conditions, the findings are in relation to changes in the average.
As we have done with the volume of transactions, we have predicted percentage changes in averages for
2018, 2019 and 2020 based on planning and development activity. We have predicted that due to the
changing nature of the cold market areas (as described earlier) and the quantum of new development that is
either consented or in the planning system, the number of transactions will rise and new market values will be
set. As a result, the change in the average will be above the 10.55% normal to good boundary over the
identified three year period. All the data points to the fact that the cold market area has moved from normal
to ‘good’ market conditions.
Page 14State of the Economy
Housing Market Conditions
2.3.3 Moderate Market Areas
Figure 2.7 shows the percentage change in annual house prices for the moderate market area.
Figure 2.7: Precentage Change in Averages in Relation to Annual
House Prices - Moderate Market Area
25.00%
20.00%
15.00%
10.00%
5.00%
0.00%
-5.00% Projected Data
-10.00%
Source: Land Registry.
The long-term change in averages in relation to annual house prices across the moderate market area is
7.03%. The parameters of normal market conditions in relation to averages are between 3.52% and 10.55%.
Change in averages below 3.52% is considered to represent poor market conditions and change above 10.55%,
good market conditions.
The above figure demonstrates the relationship between number of sales and total capital receipts in a
twelve-month period. For the purposes of clarity, the above percentages do not reflect the workings of the
housing market. This report does not suggest that house prices are rising at 10% per annum when under
‘good’ market conditions. The findings are in relation to changes in averages
As we have done with the volume of transactions, we have predicted percentage changes in averages for
2018, 2019 and 2020 based on planning and development activity. We have predicted that due to the
changing nature of the moderate market areas (as described earlier) and the quantum of new development
that is either consented or in the planning system, the number of transactions will rise and new market values
will be set. As a result the change in the average will be above the 10.55% normal to good boundary over the
identified three year period. All the data points to the fact that the cold market area has moved from normal
to ‘good’ market conditions.
Page 15State of the Economy
Housing Market Conditions
2.3.4 Hot Market Areas
Figure 2.8 shows the percentage change in annual house prices for the hot market area.
Figure 2.8: Precentage Change in Averages in Relation to Annual
House Prices - Hot Market Area
25.00%
20.00%
15.00%
10.00%
5.00%
0.00%
-5.00% Projected Data
-10.00%
Source: Land Registry.
The long-term change in averages in relation to annual house prices across the hot market area is 6.79%. The
parameters of normal market conditions in relation to averages are between 3.39% and 10.18%. Change in
averages below 3.39% is considered to represent poor market conditions and change above 10.18%, good
market conditions.
The above figure demonstrates the relationship between number of sales and total capital receipts in a
twelve-month period. For the purposes of clarity, the above percentages do not reflect the workings of the
housing market. This report does not suggest that house prices are rising at 10% per annum when under
‘good’ market conditions. The findings are in relation to changes in the average.
As we have done with the volume of transactions, we have predicted percentage changes in averages for
2018, 2019 and 2020 based on planning and development activity. The findings for hot markets help to make
the point about activity and averages. 2016 witnessed a big positive change in the average. This was based on
a lower number of transactions than in 2015 and 2017. The cause will be, although there were fewer
transactions the value of the properties transacted was higher resulting in an increase in the average house
price in that year. In 2017, although the number of transactions was higher than 2016 the value of the
properties transacted was less. For example, more 1 and 2 bedroom apartments and fewer large family
homes. What the 2017 data tells us is that the type of property sold in 2017 differed from previous years. It is
not saying that house prices fell in hot markets between 2016 and 2017. One of the key factors will be supply
of new properties of the type to meet demand. Based on planning and development activity it is expected that
in 2018 that the average change will reflect the upward trajectory seen between 2014 and 2016. 2017 is
regarded as an anomaly. We anticipate 2018, 19 and 20 will achieve a percentage improvement on the
average house price in hot markets of above the 10.18% threshold to demonstrate a market operating in good
conditions.
Page 16State of the Economy
Housing Market Conditions
2.5 Findings
PBA in their 2015 report concluded that the Trafford housing market (as a whole) was operating under normal
market conditions in 2014. A further review was recommended to ascertain if normal market conditions were
sustained through 2015. This report confirms that the improvement was sustained through 2015. The question
asked of the most recent available data is “have market conditions changed sufficiently to recommend a
change from normal market conditions (4 years in duration) in 2018”. As stated earlier in the report, rather
than fixing our analysis on pre-existing market conditions, we have sought to outline expectations for 2018
and the years ahead. The data sets used are based on supply, demand and average prices of homes in
Trafford. By looking at construction and planning activity it is clear that supply of new properties is set to
increase over the next three years and beyond (as demonstrated by section 3.2). This increase in supply is
based on good levels of demand for all types of property across the borough. Good levels of demand are
leading to an increase in average house prices. This can be regarded as a very strong indicator of the boroughs
housing market conditions being good. The level of construction and planning activity in the cold market areas
of Old Trafford, Carrington and Partington demonstrates that there has been a change in perception regarding
the appeal of these areas to developers and house buyers.
For those seeking to promote and deliver housing development within Trafford, all the indicators are positive,
including in the previously regarded underperforming areas. The analysis of the all available data points to the
Trafford Housing Market now operating in good conditions.
This report seeks to look forward and reach a reasoned conclusion on levels of activity and market appetite.
An annual review is recommended to provide confirmation that the predictions made reflect overall market
conditions.
The following section of the report adds to the PBA approach by considering the current market context in
relation to construction and planning activity.
3. NEW BUILD HOUSING MARKET CONDITIONS
3.1 Introduction
The data in the research undertaken above, which was the model used by PBA to determine Trafford
affordable housing policy (Core Strategy Policy L2) market conditions, is mainly made up of second-hand
property market transactions. However, from the perspective of considering planning applications and the
prognosis for market conditions, we believe the best indicators for deciding whether Trafford is operating
under poor, normal, or good conditions to be data on new build properties. This is because affordable housing
policy only affects new build product which usually operates differently to existing product in the market. We
have therefore used two indicators in order to assess the new build property market, these are:
Development Activity; through the number of consented schemes and planning applications for
residential development being progressed through the system; and
New build house price change from 2013 to 2017/18.
The two indicators can be clearly measured. We have acquired data on the number of planning applications
for residential development being progressed through Trafford’s planning system during the financial year of
2014/15 to the first 5 months of the 2018/19 calendar year. This data was supplied by Trafford Council. We
have analysed the number of residential units being progressed through the planning system each year. This
data set includes applications which have received planning permission (or prior approval) for new dwellings
and conversions to dwellings (the number of units applied to each planning application does not take into
account any demolition of existing dwellings or the number of dwelling units in existence prior to conversion.
This is very small percentage of the total). Where there is an outline application (or an outline element of a
hybrid application) which states the number of proposed units as “up to X dwellings” this figure has been used
in the data set. To summarise the data set includes:
Page 17State of the Economy
Housing Market Conditions
Detailed planning applications which have been granted planning permission.
Outline applications where no reserved matters have been received as of yet for that site.
Prior approval application for conversions for e.g. office to dwellings.
Validated Applications which have not yet received decisions (status is either “pending consideration”
or “pending decision”
It should be noted that pre-application schemes and their dwelling numbers have not been included in the
data set, though Trafford have circa. 1000 windfall units in the pre-application stage at the moment. This is
because these cases have a high degree of uncertainty as they are pre-applications. It should also be noted
that planning permissions are extant for three years which means that there can be a further lag from an
application receiving planning permission to the commencement of the development.
We have sourced new build sales value data by looking at estate agents web sites for scheme that we know
are in the planning and construction stage. From this we are able to calculate the average per square foot
value that estate agents/developers are estimating in the three sub-markets in Trafford for both apartment
and housing products. We can then compare this to PBA’s new build per square foot value that they estimated
in 2013 and 2015 in order to calculate the percentage increase in new build sales values. It should be noted
that the PBA average new build sales values are based on the CIL charging zone areas which have some slight
geographical differences. However, the only main difference is that Stretford is viewed as a cold market area in
terms of CIL rather than moderate. Overall, this would have had limited effect on the data, and if anything
would have slightly inflated the cold and moderate market average new build sales values stated by PBA in
2013 and 2015.
3.2 Development Activity
The graph below (figure 3.1), demonstrates the increasing level of planning and development activity. This is
achieved by sourcing the data for planning applications granted and validated planning applications currently
in the planning system from 2014 to 2018. What is clear from the graph is that year on year the number of
new dwellings being promoted through planning (as described in 3.1) is increasing. This, we believe to be, the
best barometer for assessing the strength of the Trafford housing market.
The graph shows the level of activity for each financial calendar year from 2014/15 to the projected amount in
2018/19. The 2018/19 projected amount was calculated by dividing the number units included in planning
applications since April 2018 to the end of August 2018 (1578 units) by 5 in order to get a monthly rate. This
was then multiplied by 12 to project the number of planning applications for this financial year.
Page 18State of the Economy
Housing Market Conditions
Figure 3.1: The Number of Residential Units in Planning Applications
4000
3500
3000
2500
2000
Projected Units
1500
1000
500
0
14-15 15-16 16-17 17-18 18-19 (projection)
Source: Trafford Council.
The planning and development activity is not concentrated in any particular part of the borough with all areas
experiencing an upturn in both delivery and planning applications (figure 3.2). Indeed, those areas with the
greatest level of activity are currently designated in the cold market areas.
Figure 3.2: The Number of Residential Units Pursued Through
Planning Applications by Each Market Area
2000
1800
1600
1400
1200
1000
800
600
400
200
0
14-15 15-16 16-17 17-18 18-19 (projection)
Cold Moderate Hot
Source: Trafford Council.
Page 19You can also read