STATUS OF THE SA STEEL INDUSTRY - Presentation to the Portfolio Committee on Trade and Industry 12 June 2018 - the DTi

Page created by Willie Duncan
 
CONTINUE READING
STATUS OF THE SA STEEL INDUSTRY - Presentation to the Portfolio Committee on Trade and Industry 12 June 2018 - the DTi
STATUS OF THE SA STEEL INDUSTRY

Presentation to the Portfolio Committee on
            Trade and Industry
               12 June 2018

                                         1
STATUS OF THE SA STEEL INDUSTRY - Presentation to the Portfolio Committee on Trade and Industry 12 June 2018 - the DTi
CONTENTS
1.   GLOBAL CONTEXT
2.   SA SITUATION
3.   DOMESTIC DATA
4.   REGIONAL DATA AND OUTLOOK
5.   STEEL INTERVENTIONS
6.   PRIMARY STEEL SUPPORT AND COMMITMENTS
7.   LOCAL PROCUREMENT
8.   DOWNSTREAM SUPPORT: TARIFFS AND REBATES
9.   STEEL TRADE: US SECTION 232
10. NEXT STEPS

                                               2
STATUS OF THE SA STEEL INDUSTRY - Presentation to the Portfolio Committee on Trade and Industry 12 June 2018 - the DTi
1. CONTEXT
• Global steel market is continually grappling with the challenges in the steel
  sector characterised by structural problems, persistent excess capacity,
  exacerbated by weak global economic recovery and market demand,
  causing a negative impact on trade and employment
• Indications of modest improvement - growth in steel demand and a
  recovery in prices from the historic lows recorded in 2015
• Sustained recovery uncertain due to megatrends associated with lower
  steel intensity i.e. move towards recycling (circular economy), climate
  change, ageing population and increased digitilisation

                                                                                  3
STATUS OF THE SA STEEL INDUSTRY - Presentation to the Portfolio Committee on Trade and Industry 12 June 2018 - the DTi
1. CONTEXT
       GLOBAL OVERSUPPLY
• The world is still grappling with the steel crisis due to structural
  problems, massive excess capacity, exacerbated by a weak global
  economic recovery and depressed market demand, causing a
  negative impact on trade and workers
• By late 2017 - indications of improvement and a return to growth in
  steel demand and a recovery in prices from the historic lows
  recorded in 2015
• Recovery is expected to come from growth in emerging and
  developing economies outside of China
• However, excess capacity remains a challenge and the move towards
  recycling (circular economy) and increased digitilisation point
  towards less steel use per economic growth in the long term
•   2004 – 2007 demand and supply were closely matched
•   Current global demand – 1.6 bn tons/annum
•   Plant utilization below 80% for past few years
•   Capacity unevenly distributed between regions

Source: OECD for capacity and World Steel for production.                4
STATUS OF THE SA STEEL INDUSTRY - Presentation to the Portfolio Committee on Trade and Industry 12 June 2018 - the DTi
1. CONTEXT
• Formation of G20 Global Forum on Excess Steel Capacity led by OECD
• Slight decrease in capacity to 2 268 million tons in 2017 (-1%) .
• 45 million tons of new capacity additions currently underway coming
  on stream by 2020 and 37 million tons in the planning stages - mainly
  in India, Vietnam and the Middle East
• Many developing countries/regions- have similar views on industry
  growth and increasing steel capacities for domestic consumption
  subject to demand
• A developing economy paper developed and presented to the G20 in
  June 2018 (SA, India and Indonesia)
• Large increase in trade remedy measures against unfair trade and
  localisation policies, contraction of global steel trade

                                                                          5
STATUS OF THE SA STEEL INDUSTRY - Presentation to the Portfolio Committee on Trade and Industry 12 June 2018 - the DTi
2. SA SITUATION
•   The effects of the steel crisis are evident across the value chain from mining, primary steel mills to domestic
    manufacturers struggling to compete, sustain jobs and invest.
    Challenges                                                 Result
    Low economic activity                                      Slow growth in apparent steel demand

    High cost of production, aged plants and inefficiencies    Less competitive
    - lack of investment, maintenance, upgrades
    Low capacity utilisation, lost economies of scale
    Increasing cost base (electricity, rail, logistics,        Escalating production costs
    inefficiencies and high tariffs on export vs domestic ),
    raw material costs (coking coal)
    Inconsistency of primary supply                            Supplier/customer distrust
    Reduced primary product range - mining, tooling and        Creating additional import opportunities
    automotive applications
    Downstream industry facing increasing competition          Erosion of manufacturing capacity and capability
    against low priced imports of finished goods

    Access to scrap metal                                      Threat to new and future mini-mill investments .
                                                               Global trends moving towards more profitable modern
                                                               mini-mills better placed to compete and reduce
                                                               dependency on iron-ore and coal)
    Increasing trade remedies (US Section232)                  Limited export markets and increased exposure to
                                                               imports                                                6
STATUS OF THE SA STEEL INDUSTRY - Presentation to the Portfolio Committee on Trade and Industry 12 June 2018 - the DTi
3. DOMESTIC DATA: SA CAPACITY

                               South Africa’s steel industry has been in a
   SA Capacity = 10 million
    tons /year
                               constant decline since 2010. Apart from weak
   60-65% low average         demand, a major cause of the decline is cheap
    capacity utilisation       steel imports which adversely affects the
   Cisco restarted            profitability and capacity utilization rates of the
                               domestic steel producers aggravated over the
                               years due to the situation of global excess
                               capacity and falling domestic primary steel
                                                                                     7
                               production competitiveness.
STATUS OF THE SA STEEL INDUSTRY - Presentation to the Portfolio Committee on Trade and Industry 12 June 2018 - the DTi
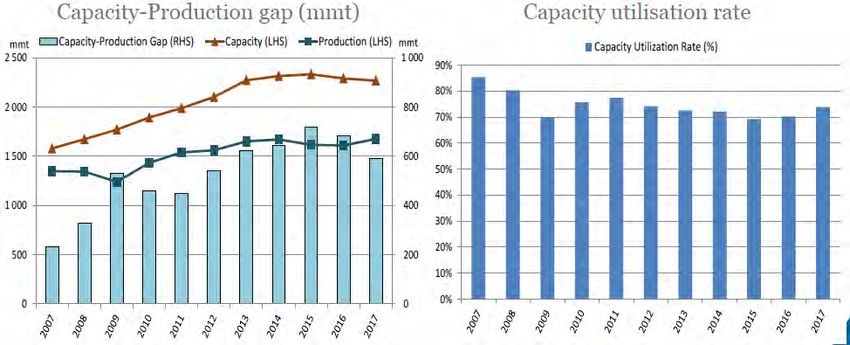
3. SA IMPORTS OF STEEL PRODUCTS

                                        Total imports of manufactured steel
                                         products gone up by >250% from 2000
                                         to 2016
                                        Imports from China increased from 12%
                                         in 2000 to 54% in 2016 of total imports
                                        Region imports 2/3 of steel
                                         consumption needs

                                                      Imports of articles of steel per region

                       700000                                                                                          6.00%
                       600000                                                                                          5.00%
                       500000
                                                                                                                       4.00%
                       400000
                                                                                                                       3.00%
                       300000
                                                                                                                       2.00%
                       200000
                       100000                                                                                          1.00%
                           0                                                                                           0.00%
                                2000 2001 2002 2003 2004 2005 2006 2007 2008 2009 2010 2011 2012 2013 2014 2015 2016

                                   Africa                                      Eastern Europe & FSU
                                   EU 27                                       Far East
                                   Islands (Africa)                            Middle East
                                   NAFTA                                       Other Western Europe
                                   South America (Incl Caribbean)              Unspecified
                                   Imports as % apparent steel consumption                                         8
3. EXPORTS
 Primary steel exports per region                 Unspecified
2500000                                                                                                     Africa overland exports of manufactured products
                                                  South America                                   500 000
                                                  (Incl Caribbean)
                                                                                                  450 000
2000000                                           Other Western
                                                                                                  400 000
                                                  Europe

                                                                     Value Added Exports Tonnes
                                                                                                  350 000
                                                  NAFTA
1500000                                                                                           300 000

                                                  Middle East                                     250 000

                                                                                                  200 000
                                                  Islands (Africa)
1000000                                                                                           150 000

                                                  Far East                                        100 000

                                                                                                   50 000
500000
                                                  EU 28                                                0
                                                                                                            2010         2011      2012     2013     2014      2015   2016
                                                  Eastern Europe
     0                                            & FSU                                                        BOTSWANA         LESOTHO     MALAWI      MOZAMBIQUE
          2013   2014     2015      2016   2017   Africa                                                       NAMIBIA          SWAZILAND   ZAMBIA      ZIMBABWE

Source: SAISI SARS data

                                                                                                                                                                      9
4. REGIONAL PRIMARY STEEL USE AND PRODUCTION
   African Crude Steel Production
                                                                                                    •     Sub-Saharan Africa’s
                                                                                                          Steel use stagnated
                                                                                                          over the last few years
                                                                                                          (low commodity and oil
                                                                                                          prices)
                                                                                                    •     Demand in South Africa
                                                                                                          shrunk by about 10%
                                                                                                          since 2007
                                                                                                    •     2/3 of regional demand
                                                                                                          supplied by imports
                                                                                                    •     Africa steel use -
                                                                                                          39mtons /year with
                                                                                                          only 13.7 mtons
                                                                                                          supplied by region

    Steel Use    (Source: Worldsteel Organisation Steel Statistical Tables 2016)
Million Tons
                                2007        2008        2009         2010       2011      2012          2013      2014       2015
Egypt                           5.5         7.5         11.1        9.3        7.8        9.5           9.2       10.2      10.9
South Africa                    5.8         6.1         4.5         5.0        5.3        5.3           5.7       5.1       5.4
Other African Countries         11.4        14.6        16.4        14.1       16.3       18.2          21.5      22.1      22.8
Africa                          22.7        28.2        31.9        28.4       29.4       32.9          36.4      37.4      39.0
World                                                   1,151.7      1,310.5    1,415.4   1,443.7       1,534.2   1,546.9   1,500.1
                                                                                                                             10
4. SA & REGIONAL OUTLOOK
                                                                                                   Why do we need a steel industry?
Average Steel Use Per Capita                                                                           Steel is fundamental to manufacturing in SA -
                                                                                                        significant value add, representing 190 000
                          2009    2010     2011        2012    2013      2014      2015
European Union (28)       242.1   291.6 311.6          278.5   281.6     295.5     303.5
                                                                                                        jobs in the direct iron-ore, steel making and
Turkey                    253.0   325.9 366.3          380.3   410.6
                                                                2009     396.9
                                                                          2010     436.8
                                                                                     2011     2012
                                                                                                        fabrication
                                                                                                        2013     2014
                                                                                                                      industries.
                                                                                                                         2015
Russia                    173.5   256.7 Union
                                  European 289.7(28)   298.7   302.1
                                                                242.1    299.8
                                                                          291.6    274.6
                                                                                     311.6    278.5     281.6    295.5   303.5
NAFTA                     183.3   241.6
                                  Turkey   263.6       281.3   272.9
                                                                253.0    305.4
                                                                          325.9    277.4
                                                                                     366.3    380.3    Top
                                                                                                        410.6 steel  consuming
                                                                                                                  396.9     436.8    industries (mining,
Central    and    South   73.1    98.3
                                  Others   101.1       103.5   107.9
                                                                163.3    101.8
                                                                          167.4    93.5
                                                                                     183.7    177.0     construction,
                                                                                                        175.6      197.1 autos,
                                                                                                                            178.8 cables, structural steel)
America                           Other European Countries      225.5      277.8     311.4    319.8     341.3     338.6     362.0
Egypt                     137.4    113.7 92.9
                                  Russia              110.5    105.1
                                                                 173.5   113.7
                                                                           256.7   118.7
                                                                                     289.7    298.7
                                                                                                        contribute
                                                                                                        302.1     299.8
                                                                                                                        ~R600bn
                                                                                                                            274.6
                                                                                                                                    to SA’s GDP (~15%) and
South Africa              87.4    Ukraine
                                   96.9       102.1 99.7         84.6
                                                               106.5       119.9
                                                                         94.7        139.2
                                                                                   98.5       138.7     employ
                                                                                                        123.6      ~8m
                                                                                                                   94.8 people
                                                                                                                            74.7    (direct and indirect)
Other Africa              18.6    other
                                   15.6  CIS  17.6    19.1       102.7
                                                               22.0        102.0
                                                                         22.0        104.1
                                                                                   22.0       118.8     133.4     118.5     97.0
                                  CIS                            138.6     190.4     212.3    220.9    The
                                                                                                        224.1 primary
                                                                                                                   213.5 steel
                                                                                                                            190.0industry are the top users of
Africa                    31.5     27.4       27.6    30.1     32.5      32.5      33.1
Middle East               221.1   NAFTA
                                   228.3 235.2 228.2             183.3
                                                               228.1       241.6
                                                                         232.0       263.6
                                                                                   225.4      281.3     electricity
                                                                                                        272.9     305.4and logistics
                                                                                                                            277.4       (rail) – key customers
                                  Central and South America      73.1      98.3      101.1    103.5     107.9     101.8     93.5
China                     413.4    438.2 475.6 487.0
                                  Egypt
                                                               539.5
                                                                 137.4
                                                                         519.0
                                                                           113.7
                                                                                   488.6
                                                                                     92.9     110.5
                                                                                                        to  both 113.7
                                                                                                        105.1
                                                                                                                   Eskom and118.7
                                                                                                                                   Transnet
India                     47.7     52.8       55.9    57.3     57.6      58.7      60.6
Japan                     414.6
                                  South Africa
                                   499.3Africa503.7 503.0
                                                                 87.4
                                                               513.8
                                                                           96.9
                                                                         533.9
                                                                                     102.1
                                                                                   497.3
                                                                                              99.7     The
                                                                                                        106.5 loss94.7
                                                                                                                    of SA’s98.5
                                                                                                                             primary steel production
                                  Other                          18.6      15.6      17.6     19.1      22.0      22.0      22.0
South Korea               930.5    1,067 1,142 1,090
                                  Africa                       1,038
                                                                 31.5     1,10
                                                                           27.4     1,114
                                                                                     27.6     30.1      capacity
                                                                                                        32.5        - becoming
                                                                                                                  32.5      33.1    an exporter of iron ore
                                  Middle East                   221.1     9228.3     235.2    228.2     and
                                                                                                        228.1 an importer
                                                                                                                  232.0        of steel will preclude us from
                                                                                                                            225.4
Taiwan, China             487.7    766.8 778.0 762.8
                                  China                        795.8
                                                                413.4    837.2
                                                                           438.2    750.6
                                                                                    475.6     487.0     539.5     519.0     488.6
                                  India                         47.7       52.8      55.9     57.3
                                                                                                        using
                                                                                                        57.6
                                                                                                                our
                                                                                                                  58.7
                                                                                                                      comparative
                                                                                                                            60.6
                                                                                                                                        mineral resource
Asia                      209.0    226.7 242.9 247.5           266.4     261.3 250.5
                                  Japan                         414.6     499.3     503.7     503.0     endowment
                                                                                                        513.8     533.9 advantage
                                                                                                                            497.3
Oceania                   168.2    215.4 185.2 194.9
                                  South Korea
                                                               174.2
                                                                930.5
                                                                         191.5
                                                                          1,067.2
                                                                                  185.1
                                                                                    1,142.5   1,089.9   1,038.4    1,108.    1,113.
World                     171.4   192.8     205.7      207.4   217.8     217.1     208.2               Growth opportunities
                                                                                                                   8         6         - SA low steel
                                  Taiwan, China                 487.7      766.8     778.0    762.8     consumption, other African economies are
                                                                                                        795.8     837.2      750.6
                                  Other Asia                    54.8       60.6      65.7     72.7      77.1      80.8      87.9
                                  Asia                          209.0      226.7     242.9    247.5     even
                                                                                                        266.4 lower
                                                                                                                  261.3     250.5
                                  Oceania                       168.2      215.4     185.2    194.9     174.2    191.5   185.1
                                  World                         171.4      192.8     205.7    207.4     217.8    217.1    208.2

                                                                 Source: World steel association
                                                                                                                                                      11
4. SUB SAHARAN AFRICA
                         Africa’s steel demand is gaining momentum,
                          supported by relative better economic growth
                         SSA: 4% growth projected by 2025, primarily due
                          to:
                              Infrastructure investment; mining, oil and gas

                              Increased agricultural production; &

                              Growing services
                         Key growth countries (copper, coal and oil & gas) -
                          Mozambique, Tanzania, Zambia, Kenya, Uganda,
                          Namibia, the DRC, Ghana and Ethiopia
                         East Africa – forecast growth of >6%
                         Key products – pipe and tube, structures, wire
                         Strong supply competition

                                                                           12
5. STEEL INTERVENTIONS
Since onset of crisis in 2015, government established a task team (dti, EDD, NT, IDC) which intervened to
save the steel industry from threat of closure and loss of capacity
The list of short-medium term measures put in place to support the steel industry:
1. Increase in the general rate of customs duty on primary steel products to 10% and safeguard measures
    for a period of 3 years on hot rolled coil and plate products
2. Tariff increases on a range of downstream products and the deployment of rebates where products
    are not manufactured or additional value added before export
3. Agreement on a set of principles for flat steel pricing in SA that is priced appropriately to ensure that
    steel-dependent industries are competitive while at the same time ensuring that the upstream steel
    mills remain sustainable and that AMSA will not add duties to the prices
4. Local procurement by government
     – undeeming of primary steel in designated products (requiring the use of locally manufactured primary steel)
     – designation of downstream steel intensive construction steel products and components
5. Settlement of the Competition Commission issues with AMSA
6. Establishment of a R1.5 bn Steel Development Fund to support key downstream steel sectors/sub
    sectors
7. Development of a short term negotiated electricity pricing framework for energy intensive users to be
    implemented
8. Investment support through 12i tax incentives, Incubation support for SME development
9. Scrap metal export tax proposal submitted to National Treasury
10. SARS reference price system being developed for downstream products to address low priced imports13
6. SUPPORT WITH COMMITTMENTS
1. Integrated set of both policy and industry reform measures adopted taking into account the interests of the
   other players (mini mills) and downstream industry
2. Developed Principles for government support subject to reciprocal commitments from AMSA
3. Consultation – Nedlac, Downstream industry engagement with Minister dti, EDD

                  Reciprocal Commitments
                  - Investment and upgrading
                  - Pricing                                      Enforcement and Compliance
                  - Improving industrial output                  - ITAC tariff awards include
                                                                 commitments
                  - Job retention
                                                                 - CompCom settlement
                  - EBIT margin cap to ensure benefits are
                  passed further downstream
                  - Transformation and developing black
                  industrialists aligned to B-BBEE codes of
                  good practice

                                                                                                                 14
7. LOCAL PROCUREMENT
1.   Both primary and downstream have raised the need for increased local demand to drive
     economies of scale and relieve price and cost pressures
2.   Primary producers have requested government to reconsider public procurement of locally
     manufactured primary steel as input into current and future designated steel products.
3.   Steel crisis led to the review of the deeming of steel as one of the measures to support the
     industry and protect jobs
4.   Revised instruction notes for the ‘undeeming’ of primary steel published by National Treasury
     for 7 designated products in July 2016 (two way radio terminals , photovoltaic systems and
     components , solar water heaters, rail rolling stock , cables, conveyance pipes, working vessels, steel power
     pylons)
5.   Instruction Note issued in Jan 2017 - Additional designations of steel construction materials to
     support the downstream job intensive steel sectors:
     –   fabricated structural steel
     –   wire products
     –   roofing and cladding
     –   ducting and structural pipework, gutters, downpipes and launders
     –   frames
     –   fasteners, joining and connecting components

                                                                                                                     15
8. DOWNSTREAM INDUSTRY DEVELOPMENT FUND
• National Treasury approved R95 million for a Steel Development Fund
    R30 million for 2017/18
    R30 million for 2018/19
    R35 million for 2019/20

• The IDC, with its own funding leveraged the allocation to form an aggregate Steel
  Development Fund of approximately R 1.5 billion

• The key objective is to assist qualifying enterprises to improve competitiveness and assist
  companies in the sector that are in distress but have a turnaround plan

• Within the downstream steel intensive sector, the following industries will be targeted:.
    Foundries
    Fabricators
    parts and component manufacturers
    valve and pump manufacturers
    machining plants and capital equipment manufacturers

                                                                                                16
8. DOWNSTREAM SUPPORT MEASURES
     TARIFF REVIEW - the dti requested ITAC to lead a proactive investigation and review of
     downstream tariffs.
No Company/s Name                     Product        Tariff       Rate of Duty      WTO Bound rate Comments
                                      description    subheading

1.   -   Cape Gate Proprietary        Wire of iron   7217.10,     Free              10%            -   Commission supported the
         Limited                      or non-alloy   7217.20,                                          duty increase to the WTO
     -   Wire Supplies and            steel          7217.30,                                          Bound rate.
         Manufacturing Co.(Pty) Ltd                  7217.90                                       -   Implemented on 31 March
                                                                                                       2017.
2.   -   Tel-Screw Products (Pty) Ltd Fasteners      7318         Free,10% & 20%    10% & 20%      -   Commission supported the
     -   CBC Fasteners (Pty) Ltd                                                    15% & 30%          duty increase to the WTO
     -   Transvaal Pressed Nuts (Pty)                                                                  Bound rate
         Ltd                                                                                       -   Implemented on 31 March
     -   Impala (Pty) Ltd                                                                              2017.
     -   SA Bolt (Pty) Ltd
     -   Ebenhaeser Engineering
         (Pty) Ltd
     -   South African Fasteners
         Manufacturers’ Association

3.   -   Clyde Steel (Pty)Ltd         Roofing        7308,        Free, 10%, 20%,   15%, 30% & 20% -   Requested information from
                                      products       8302         5% & 20%                             Clyde Steel (Pty) Ltd.
                                                                                                   -   Information still
                                                                                                       outstanding.
                                                                                                                          17
8. DOWNSTREAM SUPPORT MEASURES
     PHASE 1 TARIFF REVIEW CONT.
No Company/s Name              Product         Tariff subheading    Rate of WTO   Comments
                               description                          Duty    Bound
                                                                            rate
4.   -   Kwikspace Modular     Prefabricated   9406                 Free    20%   -  Commission supported the duty increase to
         Buildings (Pty) Ltd   steel                                                 the WTO Bound rate.
                               buildings                                          -  Implemented on 17 November 2017.
5.   -   Scaw Metal Group      Steel ropes,    7312.10.10,          Free & 15%    -  Investigation finalised.
                               stranded        7312.10.15,          5%            -  Awaiting implementation
                               wire & cables   7312.10.20,
                                               7312.10.25,
                                               7312.10.40
6.   -   Whirlpool SA (Pty) Ltd Domestic       8418.10,             Free -   20-   -    Commission decided to maintain the customs
     -   Defy Appliances (Pty) appliances      8418.21,             25%      30%        duty at the current applied rates.
         Ltd                    Freezers &     8418.29, 8418.30.90,                -    Imports not increasing, domestic industry has
                                Fridges        8418.40.90                               price advantage
                                Washing        8451.21.10
                                Machines       8451.21.20
                                Drying         8451.21.90
                                Machines       8450.11, 8450.20.90

                                                                                                                             18
8. DOWNSTREAM SUPPORT MEASURES
No   Company Name                Product        Tariff       Rate of   WTO     Status
     PHASE 2 TARIFF REVIEW       description    subheading   Duty      Bound
                                                                       rate
1.   -   Gabion Baskets (Pty) Gabions of        7326.20.10   Free      30%     -   Commission supported the duty increase
         Ltd                  wire netting                                         to the WTO Bound rate.
     -   Macafferi (Pty) Ltd                                                   -   Implemented on 1 September 2017

2.   -   Scaw South Africa       Welded Link    7315.82.01   Free      15%     -   Commission supported the duty increase
         (Pty) Ltd- Steel Wire   Chain          7315.82.03                         to the WTO Bound rate.
         Rope and Wire and       Products       7315.82.05                     -   Implemented on 1 September 2017
         Strand Divisions                       7315.82.07
                                                7315.82.90
3.   -   Scaw South Africa       Grinding       7326.11      Free      15%     -   Commission supported the duty increase
         (Pty) Ltd- Grinding     balls/ media                                      to the WTO Bound rate.
         Media Division          and similar                                   -   Implemented on 1 September 2017
                                 articles for
                                 mills                                         -   .

4.   -   Fisher Stainless       Tubes and       7306         10%       15%     -   Commission decided to maintain the duty.
         Steel Tubing Pty Ltd. pipes                                               Investigation has been finalised.
     -   Robor (Pty) Ltd
     -   Macsteel Tubes and
         Pipes
     -   Bosal Afrika (Pty) Ltd
     -   Hall Longmore (Pty)
         Ltd
                                                                                                                     19
8. REBATES
No     Company name        Product description     Tariff    Rate of   Status
                                                   subhea    duty
                                                   ding
1      -   Defy            Flat rolled steel for   7210.61 Full        -   Rebate provision
           Appliances      appliances              7210.70 waiver of       implemented on 02
           (Pty) Ltd                                       duty            December 2016.
2.     -   SS Profiling    Flat rolled steel for   7210.49 Full        -   The Commission rejected the
           (Pty) Ltd       corrugated roofing              waiver of       application.
                                                           duty        -   Thin gauge - not compliant
                                                                           with compulsory specs
3.     -   SAISI - AvengStructural Steel in the    7228.70 Full        -   Implemented on 29
           Trident Steelform of U, I, H & L        &       waiver of       December 2017​
           (Pty) Ltd    sections of other alloy    7216.40 duty
                        steel, not further
                        worked than hot-rolled,
                        hot-drawn of extruded,
                        of a height of 80 mm or
                        more
4.     -   George Scott Other bars and rods,       7228.40 Full        -   Investigation on preliminary
           and Company not further worked                  waiver of       phase. Investigation
                        than hot-rolled, hot-              duty            withdrawn by the applicant
                        drawn or extruded                                                                 20
the dti requested ITAC to investigate the possibility of creating rebates provision for primary
steel products not manufactured locally. ITAC initiated the investigation on 20 October 2017 in
this regard. The following investigations has been conducted in this regard:

                                                                                             21
9. TRADE REMEDY MEASURES: US SECTION 232
  1. CONTEXT
• With
    Theeffect
         worldfromis23 March
                     still     2018, President
                           grappling      with Trump    imposed
                                                 the steel        25%due
                                                              crisis   duties
                                                                           toonstructural
                                                                                 imports of steel articles
  and 10% on imports of aluminium articles, following a US Section 232 report by the US Secretary of
    problems,
  Commerce    thatmassive
                   determinedexcess      capacity,
                                that imports  of theseexacerbated       bytoa impair
                                                        products threaten      weakUSglobalnational security.
    economic
  The             recoveryproducts
      steel and aluminium      and depressed         market
                                       impacted include         demand,
                                                          Chapter  72, 73 andcausing      a
                                                                               76 tariff lines.
    negative impact on trade and workers
  The Presidential Proclamation, giving effect to the imposition of the duties, also made country-
• based
    By late   2017from
        exclusions   - indications
                          these duties of   improvement
                                        in cases               and
                                                 where a country      a return
                                                                   reached        to growth
                                                                            a satisfactory        in
                                                                                            alternative
  means
    steelfordemand
             address such
                       andthreats   to US national
                              a recovery            security.
                                             in prices    from the historic lows
    recorded in 2015
  SA made two submissions to the US requesting exemption arguing that:
• 1.Recovery     is expected
       SA does not  pose a threattoto come    from
                                      US national     growth
                                                   security      inthe
                                                            and to   emerging      and
                                                                        US steel and  aluminium industries
       accounting for 1-2 % of total US imports
    developing      economies outside of China
  2. SA is a source of strategic primary and secondary products used in further value added
• However,        excess
       manufacturing       capacity
                       in the           remains
                              US contributing        a challenge
                                               to jobs               and the move towards
                                                       in both countries.
  3. Furthermore, SA offered to restrict exports to a quota based on 2017 exports level
    recycling (circular economy) and increased digitilisation point
  4. SA also assured the US that it has strict customs control measures to prevent circumvention
    towards     less steel from
       and trans-shipment    use third
                                  per countries.
                                         economic growth in the long term
  5.    Furthermore, SA has introduced trade remedy measures to protect capacity and capability and
        participate in the G20 global forum to address steel excess capacity

  However, despite these assurances, the US has decided not to exempt South Africa from the duties.

                                                                                                                22
9. TRADE REMEDY MEASURES: US SECTION 232
  1. CONTEXT
• Countries
    The world  thatishave
                       stillbeen  excluded
                             grappling      fromthe
                                          with    thesteel
                                                       dutiescrisis
                                                               include Argentina,
                                                                     due            Australia, Brazil, and
                                                                           to structural
  South    Korea. massive excess capacity, exacerbated by a weak global
    problems,
  Iteconomic       recovery and depressed market demand, causing a
     is reported that:
  • negative     impact
       Brazil agreed   to a on   trade
                             quota  of 70and  workers
                                          percent  of its average finished steel exports to the U.S
• Byover latethe last three
               2017           years, in addition
                       - indications             to a 100 percent
                                         of improvement         and quota   on semi-finished
                                                                     a return    to growth inexports.
       But on aluminium, Brazil opted for tariffs, rather than a quota
    steel   demand and a recovery in prices from the historic lows
  • recorded
       Argentinain    2015to a quota deal capping steel exports at 135 percent and aluminium
                   agreed
• Recovery
       exports atis100
                     expected
                         percent oftoaverage
                                       come from
                                               exportsgrowth     in over
                                                        to the U.S  emerging
                                                                          the lastand
                                                                                   three year.
    developing economies outside of China
  • South Korea would be limited to an annual quota for steel of about 2.68 million tons,
• However,        excess capacity
       which is equivalent     to about remains
                                         70 percentaofchallenge
                                                         the annualand     theexports
                                                                     average    move towards
                                                                                        between 2015
    recycling
       and 2017.(circular
                   Korea dideconomy)
                                not requestand    increased
                                             exemption    for itsdigitilisation   point
                                                                  imports of aluminium.
    towards less steel use per economic growth in the long term

                                                                                                         23
10. IMPACT OF US SECTION 232 ON SA INDUSTRY
  1. CONTEXT
• • The
      South  Africa’s
         world         exporters
                  is still         would
                           grappling       facethe
                                        with    competition
                                                   steel crisisfrom
                                                                  dueother
                                                                        to non-exempted
                                                                            structural countries,
      as well as current
    problems,     massive  andexcess
                               potential   US manufacturers.
                                        capacity,  exacerbated by a weak global
  • economic     recovery
      As per Commerce         and depressed
                            Department            market
                                          Report, the  tariffsdemand,
                                                               and quotascausing    a U.S. steel and
                                                                            will enable
    negative
      aluminiumimpact      on trade
                   production          andanworkers
                                to utilize    average of 80 percent of production capacity.
• By late 2017 - indications of improvement and a return to growth in
  • Therefore, it is expected that some US companies will increase their production and/or
    steel demand and a recovery in prices from the historic lows
      new US companies will also emerge.
    recorded in 2015
• • Recovery
      The SouthisAfrican
                    expected     to comewill
                             Government      from  growth
                                                keep  the linesin emerging     and open with the
                                                                  of communication
      United States
    developing        for any country-exemption
                   economies       outside of China discussions in future.

• • However,     excess capacity
      The SA Government       will alsoremains    a challenge
                                        use the 2018  AGOA Forum  andinthe   move towards
                                                                         Washington,    DC, scheduled
    recycling
      for 10-11(circular
                July 2018,economy)         and increased
                             to further engage                 digitilisation point
                                                 the US Government.
    towards less steel use per economic growth in the long term

                                                                                                    24
10. IMPACT OF US SECTION 232 ON SA INDUSTRY
  1. CONTEXT
• The
    Thecompanies
          world is still  that  will be with
                            grappling    impacted
                                                the steelare:crisis due to structural
  Steel
    problems, massive excess capacity, exacerbated by a weak global
  1.economic
      Durferco (exports
                   recovery 57%and
                                 of production
                                     depressed    to US)  - 400 demand,
                                                      market    direct jobs causing
                                                                            in Saldanha
                                                                                     a
  2.negative
      Hall Longmore
                 impact ( pipe
                            on and  tube
                                trade     for workers
                                        and   oil and gas industry) - 56 highly skilled direct jobs
  3. Columbus Stainless Steel (niche product for US coal and railcar and bus industries)
• 4.ByAMSA
        late (2017    - indications
               seamless    tube for oil of
                                        andimprovement         andcoil)
                                             gas, thin hot rolled    a return to growth in
  5.steel
      Capedemand
            Town Ironand      a recovery
                         and Steel  Works in prices from the historic lows
    recorded in 2015
  Aluminium
• Recovery is expected to come from growth in emerging and
  1. Hulamin (25% of sales to the US - plate, coil and sheet for automotive, construction and
    developing
  aerospace)        economies
                - 300  direct jobs outside of China
• 2.However,      excess(17%
      South 32 Hillside     capacity    remains
                                 of production    to aUSchallenge   and the
                                                         as well as supply     move towards
                                                                            to Hulamin - sustainability
  ofrecycling
     Hillside) (circular economy) and increased digitilisation point
    towards less steel use per economic growth in the long term

                                                                                                      25
10. MEASURES TAKEN TO MITIGATE IMPACT
Industry engagement –led by the dti Minister the following actions of support have been
identified:
    1.   Assist companies to explore other markets with a focus on SSA region (Hulamin
         has started this process)
    2.   The Mission in Washington is assisting SA companies to engage US buyers to apply
         for product exemptions in cases where the US does not have capacity and
         capability to supply. In many cases SA supplies unique products that have been
         perfected over time to meet US buyers needs. Several companies have started
         this process
    3.   Trade remedy measures to protect local industry – some aluminium products are
         currently not at the bound rate and applications will be made to ITAC
    4.   Countries exempted are subject to absolute quotas and hence there is still an
         opportunity for our companies to export at the higher price
    5.   We will also continue our advocacy efforts with the US counterparts focussing on:
    (trade and investment relations, SA share of US steel and aluminium imports,
    measures taken, national security relations, quotas)
    6.   Discussion led by Minister at 2018 AGOA Forum (NEDLAC Constituencies have
         expressed interest to participate)
                                                                                             26
11. DISCUSSIONS OF THE US SECTION 232 AT
    THE WTO
•    Several countries, in particular, India, China, and the EU opened cases at the WTO
     Dispute Settlement Body against the US for violating WTO trade rules for imposing
     additional tariffs on their aluminium and steel imports.
•    On the 232, the US argues that their new tariffs on steel and aluminium are covered by
     GATT article 21 - the exemption based on national security.
•    China, India and EU have argued that the US Section 232 actions are safeguard
     measures and on that basis they notified the Council for Trade in Goods that they
     would seek compensation (i.e. tariffs on US goods of an equivalent amount).
•    US has also launched Section 232 on autos.

                                                                                              27
12. NEXT STEPS
Focus will be on engaging and developing long term policy, programme and project
interventions
1.   Develop a long-term strategy and vision for the SA steel industry across the value
     chain with short- and medium-term goals with strong industry collaboration
2.   Engage SADC and African Development Bank (AFDB) on steel intensive
     infrastructure projects
3.   Designation and localisation monitoring and evaluation, Mining Charter localisation
4.   dti, EDD and ITAC engaging SARS on circumvention and developing a reference
     price system for steel products
5.   Continued participation in G20 - corrective measures do not limit the policy levers
     to preserve and grow our primary steelmaking capacity, access the growing
     regional market and develop our domestic capability and capacity
6.   Key focus must be on upgrading, innovation and higher value added steel products
     for export into the regional construction and mining sector to move towards a
     more sustainable path in the current situation of excess capacity

                                                                                           28
References:
1.     The Health and Growth Potential of the Steel Manufacturing Industries in SA, SAISI COSM Study
2.     World Steel Organisation Data and Statistics

                                             THANK YOU
                                             QUESTIONS?

                                                                                                       29
You can also read