STATUS UPDATE: COVID-19 EPIDEMIC TRENDS AND SCENARIO PROJECTIONS IN OREGON
←
→
Page content transcription
If your browser does not render page correctly, please read the page content below
STATUS UPDATE: COVID-19 EPIDEMIC
TRENDS AND SCENARIO PROJECTIONS IN
OREGON
Results as of 5-13-2021, 4:30pm

PURPOSE OF THIS STATUS UPDATE
This report uses numerous measures to create the most accurate picture of past
COVID-19 transmission and incidence of infection over time in Oregon, and it projects
possible trends over the next month assuming different scenarios. This report
complements the extensive epidemiologic data (e.g., demographic trends in cases,
testing patterns) for Oregon available at the Oregon Health Authority (OHA) COVID-19
webpage.

RESULTS UPDATED EVERY THREE WEEKS
Please note that the COVID-19 data used for the modeling are continually being
updated. (For daily up-to-date information, visit the OHA COVID-19 webpage.) The
results in this brief will be updated every three weeks as more data become available,
the science to inform the model assumptions expands, and modeling methods continue
to be refined. The model serves as a useful tool for summarizing trends in COVID-19
transmission in Oregon and for understanding the potential impact of different future
scenarios. Point estimates should be interpreted with caution, however, due to
considerable uncertainty behind COVID-19 model assumptions and limitations to the
methods.

ACKNOWLEDGEMENTS
OHA wishes to thank the Institute for Disease Modeling (IDM) for their support. For this
status update, Niket Thakkar at IDM provided the software, programming scripts, and
technical assistance. This report is based on aspects of IDM’s technical reports (IDM
COVID Reports) and Washington State Department of Health’s COVID-19 Situation
Reports (WA Situation Reports), adapted for Oregon.

                                                                                           1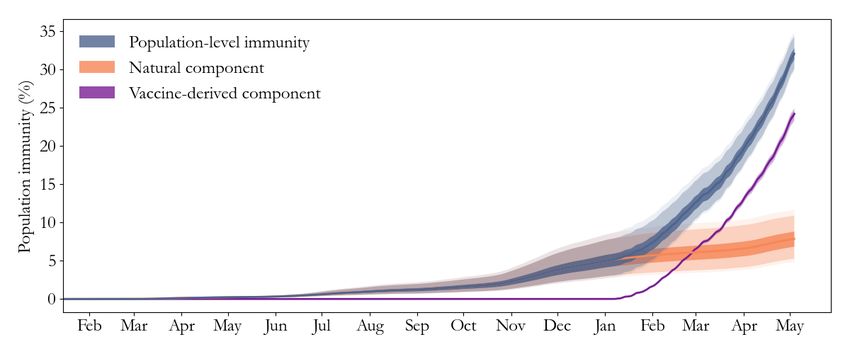
METHODS
For this status update, we used the COVID-19 modeling software Rainier. Rainier is
software designed by the Institute for Disease Modeling (IDM) to algorithmically
estimate the effective reproduction number (Re) over time based on local data and to
conduct simple projections. Rainier fits a stochastic SEIR (susceptible – exposed –
infectious – recovered) model to testing, hospitalization, and mortality time series. This
software has been used to generate regular situation updates for the State of
Washington overall and by two regions within Washington (Example WA Report).

Results are based on COVID-19 data compiled May 12 from the Oregon Pandemic
Emergency Response Application (Opera) on COVID-19 testing, total diagnosed
cases,1 hospitalized cases, and deaths among people living in Oregon. To account for
delays in reporting, diagnosed cases with a specimen collection date after May 4 were
not used; we used the same cutoff date for hospital admissions and deaths.2 In the
model, cases tested on May 4 reflect exposures that occurred around April 28.

RESULTS
Effective reproduction number

From the model results (Figure 1), it is clear the statewide Re -- the average number of
secondary cases that a single case generates -- has continued to fluctuate up and down
over time, with dramatic shifts sometimes happening quickly.

In mid-March, the Re increased above 1 and continued on a generally upward trend
until starting to decrease in mid-April. As of April 28, the statewide Re was likely
between 0.70 and 1.03, with a best estimate of 0.86. The best-estimate Re averaged
0.88 over the week ending on April 7, and averaged 1.04 over the two-week period
ending on that date.

1 Total diagnosed cases include confirmed (positive test) and presumptive cases (symptoms with epidemiologic link).
2This date reflects the cutoff through when individuals had a test specimen collected, were admitted to a hospital, or
died. Any of these events may have been reported to OHA at a later date.

                                                                                                                     2
Schools closed; indoor dining
and large gatherings banned
“Stay Home,
Save Lives”
Counties began
to reopen
2-week
“freeze”
New risk & safety
framework
Figure 1: Re estimates over time for Oregon, with shaded 95% confidence interval. 3 Graph
insert is the number of new hospitalizations over time in Oregon, a key input for the estimates.
Re = 1 is the threshold for declining transmission.
It is important to note that the changes in Re over time may be due to some combination
of changing behaviors, changes in opportunities for potential exposure as counties’
interventions become more or less stringent, viral infectivity, and/or immunity (either
from vaccination or recovering from infection). In addition, these Re estimates are based
on averages statewide, but the growth in cases in Oregon has varied by county (OHA
County Dashboard), race, ethnicity, and age (COVID-19 Weekly Report).
Our best estimate of the Re for April 28 (0.86) is lower than estimates for that date4 from
Harvard, Yale, and Stanford (1.03) and Covid Act Now (1.02), but similar to their
estimates for May 10 (0.89 and 0.90, respectively).
3 Our Re confidence interval may be narrower at times because of how we estimated specimen collection dates for
negative tests (and thus positive test rate for each day), as described in Appendix 1.
4 Model R estimates are dated April 28, 2021. All were accessed on May 12, 2021. R estimates from RT Live and
e e
covid19-projections.com have been discontinued. The exact point Re estimate from CMMID was not available for April
28, but was approximately 1.0.
3Recent case trends
Our Re estimates are based on a model that used data on diagnosed cases,
hospitalized cases, and deaths, while taking into account changes in testing volume and
practice. Examination of these outcomes (Figure 2) helps explain the recent trends in
the estimated Re. The 7-day rolling average of diagnosed cases had been increasing
since mid-March but began to decline in late April.
New hospitalizations also began to decline in late April; however, in comparing Opera
admissions data to hospital COVID-19 census data, this decline might be due in part to
longer-than-typical reporting delays of hospital admissions into Opera caused by a high
recent burden on case investigators.
The number of deaths had been long-declining but flattened out in April and has
recently started to increase.
Figure 2: Seven-day rolling average numbers of new diagnosed cases (left axis), new
hospitalizations (right axis), and new deaths (right axis) due to COVID-19. Dates reflect when
individuals had a test specimen collected (diagnosed cases), were admitted to the hospital, or
when they died.
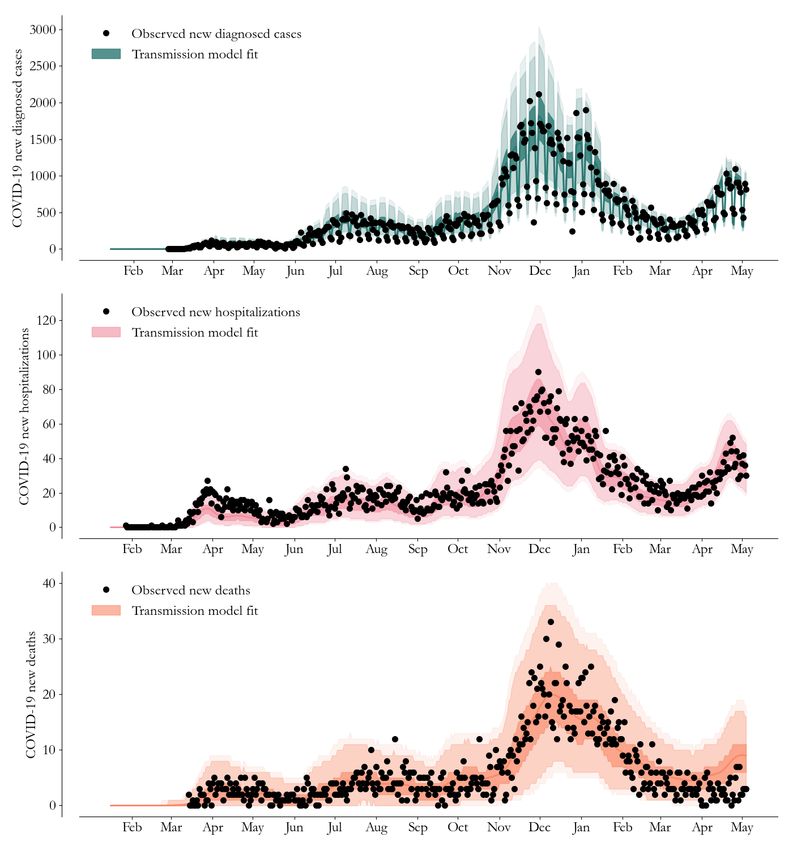
Model fit to Oregon COVID-19 data
Figure 3 shows how the transmission model captures trends in the daily Oregon
COVID-19 outcomes over time.
4Figure 3: Fitting the transmission model to Oregon’s COVID-19 data on diagnosed cases,
hospitalizations, and deaths. The lines represent the mean of 10,000 runs; the 25th-75th
percentiles are given in dark shaded areas, 2.5th-97.5th percentiles in the lighter shade, and
1st-99th percentiles the lightest shade. The black dots are observed data. Top panel: Modeled
cases (teal) capture the trend in observed, daily new diagnosed cases based on Re estimates
and a free number of importations on January 20, 2020 and February 1, 2020. Middle panel:
Simultaneously, the model (pink) captures the trend in observed daily new hospitalizations by
assuming hospitalizations are independent of testing volume. Bottom panel: With its time-
varying infection fatality ratio, the model (orange) captures the observed trend in daily deaths.
5Population-level immunity
Figure 4 shows population-level immunity from SARS-CoV-2 infection over time.
Figure 4: Population-level immunity to SARS-CoV-2 infection over time. The “natural
component” consists of people who developed and then recovered from COVID-19. The
“vaccine-derived component” consists of people who were not previously infected, but who
achieved immunity from a vaccination dose administered 21 days prior.
Rainier estimates that as of May 4, the population-level immunity to SARS-CoV-2 was
32.1% (95% confidence interval: 30.1% - 34.4%). The estimated immunity from
vaccination (24.2%) is triple the estimate for natural immunity (7.9%).
Vaccine immunity is helping prevent further spread of COVID-19. If we remove all of
those who have vaccine immunity from the model calculations and look at the rate of
infection, we see each infection spreading on average to 1.12 other people. That is to
say, without any vaccine immunity, our estimated population Re would be 1.12 instead
of 0.86, and new infections would still be increasing.
Other indicators of trends in transmission
Since we did not include COVID-19 outcome data occurring after May 4 in our modeling
dataset due to reporting delays, we examined other possible indicators to better
understand how transmission might be changing.
First, we examined counts of Oregon COVID-19 hospital occupancy to see if trends
have changed more recently. Data from HOSCAP, which is updated daily, indicate that
6hospital occupancy remained at the same level between May 4 and May 12. The trends
in hospitalization occupancy suggest the Re for late April may be at or even slightly
above 1. However, hospital census data are influenced by length of stay and include
patients from out of state (unlike Opera). We will continue to monitor the trend in both
datasets.
Second, the physical distancing composite index from the University of Maryland
COVID-19 Impact Analysis Platform is holding steady at the lowest average level of
physical distancing in our state since early March 2020. Indoor dining at restaurants,
bars, or cafes in Oregon appears to have decreased since late April levels, but other
indoor behaviors have held fairly steady, according to a Facebook survey by Carnegie
Mellon University (CMU Data) and summarized by Oregon Health Sciences University
(OHSU Summary).
Third, more infectious SARS-CoV-2 variants could increase transmission rates. As of
mid-April, most of the variants tested in Oregon were B117 (OHA Variant Dashboard),
which is estimated to be 50% more infectious than the earlier SARS-CoV-2 strains
(CDC Information on Variants). The presence of other variants of interest and concern
is being monitored.
Scenario Projections
With the fitted model, we can explore outcomes under future scenarios. That is, we do
short-term projections to compare what would happen if we assume different future
scenarios, rather than specific forecasting about what will happen. More about this
distinction is described here. Some forecasts of COVID-19 trends generated by others
are summarized in Appendix 2.
For the current report, we modeled what would happen to case and hospitalization
trends under two future scenarios having different transmission rates.5 These scenarios
assume recent vaccination levels will continue in the upcoming weeks.
Figures 5 and 6 illustrate what could happen over the next month:
• If the transmission rate as estimated for April 28 persisted.
5 On April 28, the estimated rate of transmission corresponded to an Re of 0.86. However, a given
transmission rate will result in slower growth in cases over time (and lower Re) as the population immunity
increases, because people who are infected becomes less and less likely over time to encounter someone
not immune. Hence, as a larger proportion of the population becomes vaccinated, the Re for Oregon will
begin to decrease even if the transmission rate stays the same.
7o We would see a continued decline in diagnosed cases. For the two-week
period between May 19 and June 1, the projected number of new diagnosed
cases would decline to 140 per 100,000 people. This rate translates to a daily
average of 420 cases.
o New hospitalizations would decrease to 17 per day by June 1.
• If the transmission rate increased by 20% after May 5, This scenario is intended to
illustrate what might happen over the next month if the transmission rate were to
increase due to more infectious variants and/or if protective behaviors were to
decline among those not vaccinated as local restrictions are relaxed.
o New diagnosed cases would decline more gradually, falling to 195 per
100,000 people for the two-week period between May 19 and June 1; this
rate translates to a daily average of 590 cases.
o New hospitalizations would decrease to 26 per day by June 1.
Figure 5: Observed diagnosed cases (per 100k population over the previous 14 days) for
Oregon and projected cases under two scenarios. The black line shows observed cases, while
the colored lines show diagnosed cases projected if the transmission rate estimated for April 28
persists (blue) or increases by 20% after May 4 (red). Shaded areas: 25th-75th percentile
ranges of the model fit. The risk levels of COVID activity (dashed horizontal lines) are defined by
the Oregon Framework for County Risk Levels.
8Figure 6: Observed hospitalized cases for Oregon and projections under two scenarios. Black
dots show observed daily counts, while the grey line shows model fit. The colored lines line
show hospitalizations projected if the transmission rate estimated for April 28 persists (green) or
increases by 20% after May 4 (red). Shaded areas: 2.5th-97.5th percentile ranges.
The people of Oregon have once again successfully stopped the rise in COVID-19
cases. Consistent with both of our scenario projections, forecasts compiled by the CDC
suggest that COVID-19 cases and hospitalizations in Oregon will continue to decrease
in the month ahead (Appendix 2). Our projections assume that people will continue to
get vaccinated at recent levels. With over 2 million Oregonians having received at least
one COVID-19 vaccine dose, we are on track to meeting Oregon’s goal to vaccinate
70% of those ages 16 and older by mid to late-June and removing the County Risk
Level Framework Restrictions. That is only four to six weeks from now. Until then,
Oregonians need to continue doing their part to stop COVID-19 hospitalizations –
wearing a mask and physically distance indoors, following local prevention policies, and
of course, getting vaccinated.
9Appendix 1: Additional assumptions and limitations
We used a COVID-specific transmission model fit to Oregon data on testing, confirmed
COVID-19 cases, hospitalized cases, and deaths to estimate the effective reproduction
number (Re) over time. The key modeling assumption is that individuals can be grouped
into one of four disease states: susceptible, exposed (latent) but non-infectious,
infectious, and recovered.
• For an in-depth description of our approach to estimating Re and its assumptions
and limitations, see IDM’s technical report for detailed methods information, as
well as the November 23 WA Situation Report for methodology updates.
• As described previously, estimates of Re are based on an adjusted epidemiologic
curve that accounts for changing test availability, test-positivity rates, and
weekend effects, but all biases may not be accounted for.
• We included only diagnosed cases, hospitalized cases, and deaths occurring at
least 8 days before our Opera data file extract to account for delays in reporting.
If reporting delays are longer than that, the last few days of our model input data
may undercount COVID-19 events.
• In calculating the proportion of the population with natural immunity, Rainier
assumes all people infected and recovered have remained immune.
• Estimates of Re describe average transmission occurring across Oregon. This
report does not separate case clusters associated with known super-spreading
events from diffuse community transmission. This report also does not estimate
Re separately for specific populations, who might have higher risk of exposure
because of their occupation, living arrangements, access to health care, etc.
• We assumed free / undefined numbers of importations occurring on 1/20/20 and
2/1/20, and specified changes in testing volumes occurring around dates in 2020
(4/1, 6/23, 9/29, 11/1, 11/28, 12/15, 12/27) and 2021 (1/15, 3/7, 4/10, 4/22).
• In contrast to recent reports for Washington State, we assumed a mean
exposure-to-hospitalized time of 12 days.
• Our age-specific infection fatality ratio (IFR) assumptions are based on those
referenced by CDC’s Planning Scenarios. We used population fatality rate data
from Opera to compute IFRs for the age groups used by Rainier.
• Our age-specific infection hospitalization ratio (IHR) assumptions were computed
by dividing each age-specific IFR by the corresponding death-to-hospitalization
ratio using data from Opera.
• We now assume that COVID-19 reported cases reflect a higher detection rate
among symptomatic infections, and that symptomatic infection rate increase with
age. We used age-specific % symptomatic assumptions as estimated here and
adjusted our weekly case distribution to reflect these detection assumptions
(without affecting the total number of cases detected).
10• We compared our estimates of immunity with CDC's latest commercial laboratory
seroprevalence estimate for Oregon, which was for February 2021. Their
estimate of seroprevalence (6.7%; confidence interval: 5.0% - 8.3%) was higher
than Rainier’s estimate of natural immunity (5.3%) and lower than Rainier’s
estimate of total immunity (i.e., either natural immunity or immunity from
vaccination) (9.3%) for February 2021.
• We use test specimen collection date for new cases but have only lab report date
for negative tests. To better align these two outcomes, we redistributed negative
test counts. These counts were reallocated among the laboratory report day and
the two days prior, according to distribution of positive cases (by specimen date)
occurring over those same three days. Because Rainier’s Re uncertainty is
partially based on variation in percent positive, this redistribution of negative
cases may cause the Re confidence intervals to narrow.
• Point estimates should be interpreted with caution due to considerable
uncertainty behind COVID-19 model assumptions and limitations to the methods.
Rainier now takes vaccination data into account -- both in estimating historical Re
and in scenarios projecting future counts of diagnosed and hospitalized cases
(assuming specified COVID-19 transmission rates). Detailed documentation of the
model’s vaccination component is currently being prepared by the Institute for
Disease Modeling. We describe those methods briefly here.
• For this report, Rainier assumed6 that a proportion of vaccinated individuals
would be protected from SARS-CoV-2 infection 21 days after each vaccine dose:
on average 58.0% of those vaccinated after the first dose, and an additional
24.4% after the second dose (for a total of 82.4%). Among vaccinated people not
protected from SARS-CoV-2 infection, Rainier assumes roughly 20% to be
protected from experiencing severe COVID-19 symptoms (i.e., hospitalization or
death) but still able to transmit the virus.
• Rainier’s estimate of immunity from vaccination may be conservative – that is,
slightly lower at any given point in time because it assumes no immunity
develops until three weeks following a dose.
• Another limitation is Rainier’s use of these same assumptions for all the
vaccines; hence, for this report the single-shot Johnson & Johnson vaccine was
considered equivalent to first-doses of the Pfizer or Moderna vaccines. This
limitation is not expected to have a large influence on results since the Johnson
and Johnson vaccines currently constitute only about 2% of total vaccine doses
administered to-date in Oregon. However, this vaccine may be modeled
separately in the future as it becomes more frequently administered.
6Dagan, Noa, et al. "BNT162b2 mRNA Covid-19 vaccine in a nationwide mass vaccination setting." New England
Journal of Medicine (2021). Available online at https://www.nejm.org/doi/pdf/10.1056/NEJMoa2101765
11Appendix 2: Summary of External COVID-19 Forecasts
CDC compiles state-level forecasts from numerous national modelers, and produces an
ensemble forecast. For Oregon, CDC’s ensemble forecast for diagnosed cases predicts
case counts will decrease through early June, from about 5,000 to 4,200 per week.
CDC’s ensemble forecast for hospitalizations predicts that Oregon daily admissions will
decrease through early June, though at a slower pace than either of our scenarios, from
about 44 to 38 per day.7
Institute for Health Metrics and Evaluation’s May 6 forecast for Oregon estimates that
daily new infections will most likely decline through mid-September.
Oregon Health and Science University produces a weekly COVID-19 forecast for
Oregon, available here. They present projections under various scenarios. Their
forecast (referred to as “primary scenario”) suggests hospital occupancy is currently
cresting and will decline in the coming weeks.
7 CDC ensemble forecasts are dated May 10, 2021; accessed on May 12, 2021.
12You can also read