STEEL MARKET DEVELOPMENTS - Q2 2019 - OECD.org
←
→
Page content transcription
If your browser does not render page correctly, please read the page content below
STEEL MARKET DEVELOPMENTS

          Q2 2019
2 │ STEEL MARKET DEVELOPMENTS – Q2 2019

This paper was authored by Fabien Mercier, Daichi Mabashi and Filipe Silva from the OECD
Directorate for Science, Technology and Innovation (STI). It was approved and declassified by written
procedure by the OECD Steel Committee on 26 March 2019 and prepared for publication by the OECD
Secretariat.

                                          Note to Delegations:
                   This document is also available on O.N.E under the reference code:
                                        DSTI/SC(2019)1/FINAL

This document, as well as any data and any map included herein, are without prejudice to the status of or
sovereignty over any territory, to the delimitation of international frontiers and boundaries and to the name
of any territory, city or area.

© OECD 2019

You can copy, download or print OECD content for your own use, and you can include excerpts from
OECD publications, databases and multimedia products in your own documents, presentations, blogs,
websites and teaching materials, provided that suitable acknowledgment of OECD as source and copyright
owner is given. All requests for commercial use and translation rights should be submitted to
rights@oecd.org.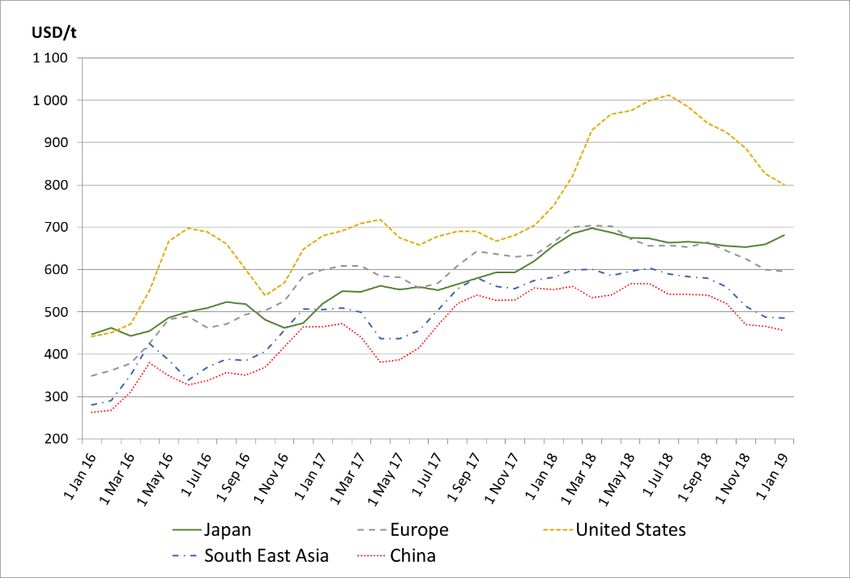
STEEL MARKET DEVELOPMENTS – Q2 2019                             │3

                                                            Table of contents

Recent market developments in the global steel industry .................................................................. 5
1. Summary ............................................................................................................................................ 6
2. The economic outlook........................................................................................................................ 7
   2.1. OECD economic outlook .............................................................................................................. 7
   2.2. Focus on specific risks to the outlook ........................................................................................... 9
     2.2.1. Deleveraging and adjustment in the Chinese economy .......................................................... 9
     2.2.2. Slowdown in global economy and trade .............................................................................. 14
   2.3. Steel consumption ....................................................................................................................... 17
     2.3.1. Americas............................................................................................................................... 18
     2.3.2. Asia ...................................................................................................................................... 18
     2.3.3. CIS........................................................................................................................................ 19
     2.3.4. European Union.................................................................................................................... 19
   2.4. Steel production .......................................................................................................................... 20
   2.5. World steel trade ......................................................................................................................... 21
   2.6. Steel and steelmaking raw material prices .................................................................................. 23
     2.6.1. Steel prices ........................................................................................................................... 23
     2.6.2. Steel futures prices ............................................................................................................... 26
     2.6.3. Steelmaking raw material prices .......................................................................................... 27
   2.7. The global capacity situation ...................................................................................................... 30
   2.8. Global steel market outlook ........................................................................................................ 31
   2.9. Regional steel market outlook .................................................................................................... 31
     2.9.1. Europe and CIS economies .................................................................................................. 31
     2.9.2. Americas............................................................................................................................... 32
     2.9.3. Middle East .......................................................................................................................... 33
     2.9.4. Asia and Oceania.................................................................................................................. 33
References ............................................................................................................................................ 38
Endnotes ............................................................................................................................................... 48

                                                                         Tables

Table 1. OECD Economic Projections, November 2018 ........................................................................ 9
Table 2. World crude steel production developments in 2018 .............................................................. 21
Table 3. Steel trade developments across major steel-producing economies ........................................ 23

                                                                        Figures

Figure 1. Total credit to non-financial corporations (core debt) ........................................................... 10
Figure 2. World industrial production ................................................................................................... 15
Figure 3. World trade and trade prices .................................................................................................. 16
Figure 4. Steel Purchasing Managers’ indices (PMIs) .......................................................................... 17
Figure 5. Consumption of hot-rolled steel products, major economies ................................................. 18
Figure 6. Aggregate flat and rebar steel prices (latest January 2019) ................................................... 24
4 │ STEEL MARKET DEVELOPMENTS – Q2 2019
Figure 7. Steel price for flat products, by region ................................................................................... 25
Figure 8. Steel price for rebar products, by region ................................................................................ 26
Figure 9. Steel future prices................................................................................................................... 27
Figure 10. Prices for key steel-making raw materials ........................................................................... 28
Figure 11. Chinese scrap prices continues on upward trend ................................................................. 29
Figure 12. Margin between steel and raw materials prices ................................................................... 29
Figure 13. Evolution of crude steelmaking capacity in OECD/EU economies and non OECD/EU
economies ...................................................................................................................................... 30
Figure 14. Global crude steelmaking capacity and crude steel production ........................................... 31
Figure 15. Car passenger vehicle sales in China ................................................................................... 34
Figure 16. Real estate price change and investments ............................................................................ 35
Boxes
Box 1. Debt for equity swaps ................................................................................................................ 11STEEL MARKET DEVELOPMENTS – Q2 2019 │5
Recent market developments in the global steel industry
This document is part of a regular monitoring exercise to provide the Steel Committee with
timely information on steel market developments. It provides a brief update on recent
developments in steel markets, based on information available until December 2018.6 │ STEEL MARKET DEVELOPMENTS – Q2 2019
1. Summary
Steel market fundamentals have weakened markedly over the second half of 2018.
Although steel production growth is still positive in most regions, steel prices have already
started to adjust, reversing their previous upward trend and eliminating most of their earlier
gains. Important headwinds include the weakening global outlook, the increase in trade
frictions, the pickup in new capacity investments, and the persistence of excess capacity
This document provides an overview of recent steel market developments, the latest
developments in global steelmaking capacity, and a brief overview and outlook for regional
markets, based on information available until December 2018. It also includes an overview
of the deleveraging and adjustment process in the Chinese economy and the slowdown of
the global economy and in global trade. To summarise, the following key developments
are discussed in this report.
The economic situation: The November 2018 OECD forecasts pointed to a world
GDP growth rate of 3.5% in 2019, with downside risks to growth including a
potential increase in trade frictions, the phasing out of non-conventional monetary
policies, and the financial risks stemming from high asset valuations and high
private and public indebtedness.
Steel demand: Market data suggest that steel consumption growth stalled in most
economies in 2018, and that the 2017 recovery may be losing momentum.
Downside risks to the outlook include increased trade frictions and a weakening
global economy, which suggests that without further action large structural
imbalances are likely to persist.
Steel exports: Global steel exports continued to decline in the first 10 months of
2018 (y-o-y), including exports from India (-29.3%), the United States (-13.4%),
the People’s Republic of China (-9.3%), the European Union (-6.4%) and Japan (-
3.1%).
Steel and raw material prices: After increasing during the first months of 2018,
steel prices reversed their earlier gains, falling back to their pre-2018 levels. Coking
coal and ferrous scrap prices have both fallen back to their pre-2018 levels, while
iron ore prices have remained roughly the same over the year.
Capacity: The latest available information (as of 31 December 2018) suggests that
global steelmaking capacity, in nominal crude terms, remained nearly unchanged
in 2018, following declines in 2016 and 2017. Global capacity remains well above
production and demand.
Steel demand outlook: Forecasts by the World Steel Association (worldsteel),
released in October 2018, suggest that global steel demand will continue to grow
in 2019, albeit at a slower pace (1.4%) than in 2018. A new worldsteel forecast will
be released in April 2019.STEEL MARKET DEVELOPMENTS – Q2 2019 │7
2. The economic outlook
2.1. OECD economic outlook
According to the November 2018 Economic Outlook, the OECD forecasts that world GDP
will grow by 3.7% in 2018 and 3.5% in 2019. Table 1 below indicates the latest available
OECD GDP growth forecasts. In many countries, unemployment is at record lows, and
labour shortages seems to be emerging, despite sluggish real wage growth. Monetary and
fiscal policy has begun to normalise, particularly in the United States (U.S.). Nevertheless,
a number of risks may materialise in the very near future. Trade growth and investment,
which are important contributors to global GDP growth, may continue to be hampered by
tariff hikes, according to the Economic Outlook. Higher US interest rates and an
appreciating US dollar have resulted in an outflow of capital from emerging economies,
which is weakening their currencies. Also, stock market prices and asset valuations in
general are still high by historical standards — if interest rates were to increase rapidly, this
could negatively impact stock market valuations and affect the real economy through
expectations and adverse wealth-effects.
In the euro area, real GDP growth should be about 1.8% in 2019, supported by private
consumption and business investment. GDP growth is projected to decrease slightly in
2020, to a rate of 1.6%, while domestic demand should continue to be supported by
accommodative monetary and fiscal policy. Favourable financing conditions should
support investment, and inflation should continue to rise as wage growth strengthens. The
fiscal stance is expected to continue to be accommodative.
In the U.S., the economy continues to benefit from the fiscal stimulus enacted in 2017 and
2018, and the impact of the accommodative fiscal stance is expected to continue being felt
until the end of 2019. The recent tax reforms and the supportive fiscal conditions should
continue to underpin private investment in 2019, but a weakened global outlook and trade
frictions will weigh on economic activity, according to the Economic Outlook.
Furthermore, risks to financial stability stem both from high asset valuations and from high
levels of non-financial corporate debt.
In Japan, economic growth is projected to be near 1% in 2018 and 2019, supported by
exports, business investment and private consumption. A number of factors might cushion
the negative impact on consumption of the increase of the consumption tax (from 8% to
10%), including the use of half of the generated revenues in new government spending
programmes, and the cut in taxes on cars and housing. There are two main risks to the
economic outlook for Japan: a loss of confidence in Japan's fiscal sustainability and the
escalation of trade actions. The Comprehensive and Progressive Agreement for Trans-
Pacific Partnership (TPP-11), where Japan assumed a leadership role, should help mitigate
the latter.
In the People’s Republic of China (hereafter “China”), economic growth is estimated to
have declined to 6.6% in 2018 and is projected to further decline to 6.3% in 2019. The
weakening of industrial production, corporate profits and revenues, are all signs of a
slowdown. Excess capacity still plagues a number of industrial sectors, and weighs on
business investment. Foreign trade flows, currently mitigated by the front-loading of
purchases from the U.S. to avoid tariffs, should continue to lose momentum in 2019. The
slowdown of activity also reflects reduced infrastructure investment and residential8 │ STEEL MARKET DEVELOPMENTS – Q2 2019
housing. Monetary and fiscal policies have eased to curtail the slowdown of growth. The
decrease of average import tariffs and tax cuts aimed at boosting consumption could also
help alleviate the impact of the global slowdown and of the reduction in trade activity on
the Chinese economy. A better pricing of risks and the removal of implicit government
guarantees for State-Owned Enterprises (SOE) would contribute to increase capital
efficiency, and thus bolster sustainable growth.
In India, economic growth will slow somewhat but remain robust, at close to 7.5% in 2019
and 2020. Higher oil prices and the rupee depreciation are putting pressure on demand,
inflation, the current account and public finances. However, both business investment and
exports are expected to remain strong, due to past structural reforms – including the new
Insolvency and Bankruptcy Code and the smoother implementation of the Goods and
Services Tax. Nevertheless, India has little room for manoeuvre in terms of fiscal and
monetary policies: its level of debt relative to GDP is elevated, and the rupee depreciation
underpins inflationary pressures. Those inflationary pressures have only been temporarily
contained by a good monsoon (which positively affected the supply of crops and lowered
food prices), lower excise taxes on oil products, and the government’s requirement that
public-sector oil marketing companies lower their margins.
In the Russian Federation (hereafter “Russia”), growth is projected to remain at around
1.6% in 2018, easing slightly to 1.5% in 2019. Private consumption and investment should
benefit from rising wages, household credit and employment, although the increase in the
value-added tax will partially offset these effects. Uncertainty remains about possible future
sanctions and counter-sanctions, which could continue to take their toll on the Russian
economy.
In Brazil, growth should gain momentum during 2019 and 2020 supported by private
consumption. Improvements in the labour market and the increase in business investment
possibly supported by greater policy certainty could contribute to economic activity.
Downside risks are a deteriorating fiscal position, should the newly elected government fail
to reach consensus on pension reform.STEEL MARKET DEVELOPMENTS – Q2 2019 │9
Table 1. OECD Economic Projections, November 2018
Real GDP growth (y-o-y).
2016 2017 2018 2019 2020
World 1 3.1 3.6 3.7 3.5 3.5
United States 1.6 2.2 2.9 2.7 2.1
Euro area 1.9 2.5 1.9 1.8 1.6
Germany 2.2 2.5 1.6 1.6 1.4
France 1.1 2.3 1.6 1.6 1.5
Italy 1.0 1.6 1.0 0.9 0.9
Spain 3.2 3.0 2.6 2.2 1.9
Japan 1.0 1.7 0.9 1.0 0.7
United Kingdom 1.8 1.7 1.3 1.4 1.1
Mexico 2.6 2.3 2.2 2.5 2.8
Korea 2.9 3.1 2.7 2.8 2.9
Canada 1.4 3.0 2.1 2.2 1.9
Turkey 3.2 7.4 3.3 -0.4 2.7
Australia 2.6 2.2 3.1 2.9 2.6
China 6.7 6.9 6.6 6.3 6.0
India 2 7.1 6.7 7.5 7.3 7.4
Russia -0.1 1.5 1.6 1.5 1.8
Brazil -3.4 1.0 1.2 2.1 2.4
Indonesia 5.0 5.1 5.2 5.2 5.1
South Africa 0.6 1.3 0.7 1.7 1.8
OECD 1 1.8 2.5 2.4 2.1 1.9
Non-OECD 1 4.2 4.6 4.7 4.7 4.7
World real trade growth 3.1 3.6 3.7 3.5 3.5
Note: 1. Moving nominal GDP weights using purchasing power parities.
2. Fiscal years starting in April
Source: OECD Economic Outlook, November 2018, http://www.oecd.org/eco/outlook/economic-outlook/.
2.2. Focus on specific risks to the outlook
2.2.1. Deleveraging and adjustment in the Chinese economy
The non-financial corporate debt to GDP ratio in China has increased from about 100% in
2008 to about 160% in the first quarter of 2018, and is considerably higher than in other
jurisdictions (Figure 1). The debt ratio had started to decrease in 2016, but rebounded in
the first quarter of 2018, as can be shown in Figure 1.10 │ STEEL MARKET DEVELOPMENTS – Q2 2019
Figure 1. Total credit to non-financial corporations (core debt)
As a percentage of GDP
Note: Total credit to non-financial corporations is defined as the sum of loans and debt securities.
Source: BIS, https://stats.bis.org/statx/srs/table/f4.1.
Monetary policy has loosened considerably in China since mid-2018. For example, on 1
June 2008 the People’s Bank of China (PBOC) expanded the scope of the collateral
accepted for its medium-term lending, to include all corporate bonds rated AA+ and AA
(Zhang and Lee, 2018[1]), whereas previously only higher-rated bonds (AAA) were
accepted.1 This certainly creates a greater availability of collateral that allows commercial
banks to refinance and provide more credit to the Chinese corporate sector.2 The PBOC
also uses the Reserve Requirement Ratio (RRR), which determines the regulatory
provisions that commercial banks must make when granting a loan, as a policy tool to adjust
credit flows. The RRR, which stood at 17% in the beginning of 2018, has been
progressively reduced, and reached 14.5% in January 2019. The PBOC will further reduce
the RRR by an additional 0.5 percentage point on January 15 and a further 0.5 percentage
point on January 25.3
Shadow banking is defined here as the non-bank financial institutions that are outside the
scope of banking regulators, as they do not take bank deposits from customers. This
includes insurance companies, asset managers, broker-dealers, money market funds,
private equity funds and hedge funds. Shadow banking has increased considerably in
China, particularly due to the growth of wealth management products (WMPs), which are
Single Purpose Vehicles (SPVs) managed by banks (OECD, 2017[2]). WMPs allow banks
to essentially shift assets and deposits off balance sheets and thus decrease banks’ capital
requirements. WMPs offer little transparency on the quality of their assets for their
investors, who instead rely on the implicit guarantee that comes with management by state-
owned banks (OECD, 2017[2]). Implicit guarantees from state-owned enterprise (SOE)STEEL MARKET DEVELOPMENTS – Q2 2019 │ 11
banks to their WMPs give rise to moral hazard and an ineffective pricing of risk that could
result in capital misallocation (OECD, 2017[2]).
An OECD study found that contagion risk4 in emerging markets between the banking sector
and the shadow banking sector, has increased and became significant after the 2008
financial crisis (OECD, 2017[2]). Chinese regulators have recognised the issue and made
efforts to curb excess shadow banking growth. In July 2018, the China Banking and
Insurance Regulatory Commission issued draft rules for the issuance of WMPs, in an
attempt to curb financial risks and to increase transparency (Liu, 2018[3]). In particular,
banks should limit leverage and strengthen liquidity management of their WMPs.
Moreover, WMPs act as a fund and can now invest directly in equity, rather than through
broker-dealers. The rules are due to take effect at the end of 2020 (Liu, 2018[3]).
Debt for equity swaps in China
The Chinese government has been making some efforts to deleverage the economy. 5 Debt
for equity swaps (Box 1) are seen by Chinese regulators and policy makers as an expedient
way to deleverage heavily indebted companies, particularly in the steel sector. China’s
regulators issued a number of guidelines to provide a framework for debt for equity swaps
(Wan, 2018[4]). This framework has been evolving over the years: Chinese debt for equity
swaps have moved away from government direct intervention to help banks and SOEs (e.g.
Sinosteel6) towards a more complicated scheme that diffuses risks inside and outside the
financial system (Pang and Herrero, 2016[5]).
According to Natixis, only RMB 165 billion out of the RMB 884 billion (15.7%) of
announced debt for equity swaps have been implemented as of February 2018 (Herrero and
Gary, 2018[6]). Nevertheless, the rhythm is likely to have accelerated and continue going
forward. Indeed, the People’s Bank of China announced in end of June 2018 that RMB 500
billion of the RMB 700 billion in liquidity obtained by cutting banks’ reserve requirement
ratio (RRR) would be used by the five state-owned banks and 12 national joint-stock
commercial lenders to support debt for equity swaps (Wan, 2018[4]).
Box 1. Debt for equity swaps
A debt for equity swap is a transaction in which the obligations of a company, usually loans
it was granted or bonds it issued, are exchanged by the obligors of the company against
equity. Debt for equity swaps can be voluntary or mandatary (or somewhere in-between),
and they may be explicitly or implicitly promoted by the government.
A mandatory exchange of debt against equity does not necessarily imply a government
intervention: mandatory exchanges can happen, for example, when bankruptcy laws clearly
define the conditions for debt for equity swaps to take place. Bankruptcy laws vary across
jurisdictions. For example, in the U.S. Bankruptcy Article 11 entails that the company does
not liquidate all its assets to repay bondholders (in contrast with Bankruptcy Article 7).
Instead, the company continues operating and focuses on reorganising and restructuring its
debt. Previous equity shares are cancelled, and replaced by new ones distributed to
bondholders and, potentially, to previous shareholders, ensuring that equity holders take
the first loss. The amount of new shares provided for each bond’s nominal amount will in12 │ STEEL MARKET DEVELOPMENTS – Q2 2019
that case be determined by the appropriate bankruptcy court, taking into account the value
of the bond at the time of bankruptcy, and the assets of the company.
Debt for equity swaps can also be proposed by the company to its obligors. Companies
in need of being relieved from a heavy debt burden may engage in negotiations with their
main lenders, trying to incentivise them to agree to exchange their debt for equity. This
will result in a dilution of the company previous ownership, thus current equity holders
have an incentive to ensure good management and to avoid over-indebtedness. To entice
bondholders to agree to the swap, the estimated value of shares will typically be higher
than the money due, which means that investors agreeing to the swap will be provided with
more shares in value that what the amounts they had lent to the company. Obligors are free
to refuse such a scheme.
Debt for equity swaps can also be triggered by conditions described in the bond
indenture (the legal and binding contract between the bond issuer and the bondholders):
this is the case of convertible bonds. It could be that a “financing event” identified in the
indenture automatically decides when the bond is converted to equity. Other convertible
bonds can be converted on the decision of their holder only. Convertible bonds typically
have a lower yield than non-convertible bonds, since they essentially give bondholders a
“call option” on the company stock: each bond can be converted for a fixed amount of
company shares. Bondholders would convert their bond to equity whenever the value of
the equity they can obtain becomes higher than the (current) price of their bond.
Convertible bonds thus enable debt investors to become equity investors, which might be
particularly appealing in an upturn.
The State Council issued a guideline on 22 September 2016 that forbids Chinese banks to
hold equity stakes of corporates facing financial difficulties (Pang and Herrero, 2016[5]).
To carry out a debt for equity swap, the bank sets up a Single Purpose Vehicle (SPV)
structure, called a “fund”, to which the bank sells its distressed debt. The debt thus leaves
the balance sheet of the bank, as the SPV balance sheet does not consolidate at the bank
level. Future transactions between the fund and its final investors are also off-balance sheet
from the point of view of the bank. This entails significant capital relief for the bank since
it does not have to provision its distressed debt. Furthermore, there is evidence that the fund
buys the debt at par value, rather than at a discount (Pang and Herrero, 2016[5]), which
means that the bank is not taking any loss. Future losses and financial risks are passed to
end-investors further down the scheme.
End-investors in the new Chinese debt for equity swaps are those who buy shares of the
fund. In practice, they are:
1. The originating bank itself, through its participation in its own fund. This
participation is accounted for in the trading book of the bank through its Asset
Management Company (AMC), rather than in its lending book. Moreover, based
on a number of individual deals, Natixis estimated that banks retained a mere 4%
of the total amount of debt for equity swaps through their own AMCs (Herrero and
Gary, 2018[6]). Hence, the scheme entails important capital reserve savings for
banks, which do not need to provision risky loans and can off-load them to the fund
and clean their balance sheet.STEEL MARKET DEVELOPMENTS – Q2 2019 │ 13
2. Other AMCs than the one of the banks (34%). Those are mainly the three large
AMCs created by China in the 1990s to clean up bad loans in its banking sector,
namely, China Huarong, Cinda, and Orient and Great Wall.
3. Insurance companies (30%); and
4. State-owned funds (27%), in particular:
a. The China Structural Reform Fund; it is the formed by 10 SOEs. The fund’s
aim is to allocate 80% of their assets to structural restructuring of SOEs directly
with equity or through investment in funds, as well as involvement in SOEs as
a creditor.
b. The China State-owned Capital Venture Investment Fund, which has the largest
involvement in debt for equity swaps. The key purpose of the fund is to support
innovation-driven and industrial upgrading.
c. The Guohua Military and Civilian Integration of Industrial Development Fund,
whose aim is to support the strategic military industry and central SOEs, as part
of the 13th Five-Year Plan.
5. Other potential investors, including private investors, the National Security
fund, and the targeted SOE itself (Pang and Herrero, 2016[5]).
Although under Regulation 82 of the China Banking Regulation Commission (CBRC),
non-performing loans are not allowed to be sold directly or indirectly to households (Pang
and Herrero, 2016[5]), the regulation is circumvented by the scheme as it is the fund (the
SPV), and not the bank, which will transfer the risk to its end-investors (Pang and Herrero,
2016[5]). Hence, the risk and potential future losses are diluted through the financial system
and beyond it, with depositors and households bearing the ultimate risk. For example, the
Postal Saving Bank of China has few non-performing loans (twice less than the sector
average in Q3 2017) and a solid deposit base, but is the owner of 35% of the China
Structural Reform Fund and the China State-owned Capital Venture Investment Fund, and
hence an important end-investor in the debt for equity schemes (Herrero and Gary, 2018[6]).
The main beneficiaries of the scheme are i) the borrower (the indebted company, usually
an SOE), which avoids the difficulty of having to repay its debt while reducing its
indebtedness at a very low cost and ii) the lender (the bank, usually an SOE), which does
not have to set aside capital for provisioning its distressed loans nor does it have to take
any significant loss on the value of its loans. The scheme does not incentivise the borrower
towards a more prudent approach with respect to debt, nor does it incentivise the obligor
towards a more prudent management of credit. Hence, it fails to instil market discipline
that would enforce long-term structural change and capital efficiency. On the contrary, it is
the rest of the financial system, including the cash-rich banks, and ultimately, the
households, which will bear the debt market and default risks (Pang and Herrero, 2016[5]).
Within the company management, little change or re-organisation can be expected from
the new diluted and non-expert shareholders. The reduced debt-level of the company would
enable it to obtain new loans from its main lenders, thus falling short of the deleveraging
goal and perpetuating an over-reliance on debt.
Debt for equity swaps, by allowing the diffusion of steel firms’ financial risks and debt
burden to the rest of the Chinese economy, and ultimately, households, represent a
downside risk for the global economic outlook and thus also for the steel sector. Long-term
incentives for firms to reduce borrowing, curtail capacity expansion projects and adopt
more conservative management practices are absent, as debt for equity swaps allow14 │ STEEL MARKET DEVELOPMENTS – Q2 2019
borrowers to avoid disruptive and forced restructuring. Similarly, banks that lend to steel
firms are not incentivised to provide credit more carefully, as they can avoid taking losses
for bad loans to steel firms by simply passing them to a debt for equity scheme.
2.2.2. Slowdown in global economy and trade
The OECD’s Economic Outlook, released in November 2018, explains that import tariffs
have led to increases in prices in some countries, and that global trade had started to ease
due to the adverse effects of trade restrictions on confidence and investment planning
(OECD, 2018[7]). According to the OECD, global trade growth will remain below 4% per
annum on average during the period 2018-20.
A recent WTO leading Trade Outlook Indicator (WTOI), released on 19 February,
exhibited the weakest value since March 2010, indicating a rate of trade growth below the
currently estimated trend. The WTO forecasts trade growth to slow to 3.7% in 2019 from
an expected 3.9% in 2018, downgrading its previous forecast due to trade frictions and
tighter credit market conditions (Miles, 2019[8]) (WTO, 2019[9]).
In January 2019 the International Monetary Fund (IMF) reported that rising trade frictions,
as well as financial vulnerabilities due to the building up of private and public debt, are key
downside risks to the world economy (IMF, 2019[10]) and warned that the slowdown in
economic growth could be sharper than predicted. The lack of a deal concerning “Brexit”,
and a larger-than-anticipated slowdown in China were also pointed as risks that could
contribute to a steeper slowdown in the world economy. A Pricewaterhouse Coopers (PwC)
survey also found that only 5% of executive managers are expecting the situation to
improve, compared to a third a year earlier (Giles, 2019[11]).
World industrial production growth, which had been picking up from its 2015 lows and
reached 4.1% in January 2018, has been falling ever since. Growth stood at 1.8% in
November 2018, down from 3.7% one year earlier (Figure 2). The weakening growth of
industrial production has been more pronounced in advanced economies. Annual growth
in advanced economies fell from 4.2% in November 2017 to a meagre 0.6% in November
2018. In emerging economies, industrial production growth decelerated from 3.2% to 2.8%
during the same period. Hence, the industrial production gap between emerging economies
and advanced countries, which had narrowed during previous years, appears to be widening
again.STEEL MARKET DEVELOPMENTS – Q2 2019 │ 15
Figure 2. World industrial production
% change, year-on-year
Source: Netherlands Bureau for Economic Policy Analysis (CPB).
After a rapid increase in 2016 and 2017, the growth in global trade and export prices nearly
came to a halt in November 2018. Annual growth in export volumes fell from 10% at the
end of 2017 to 1.7% in November 2018.16 │ STEEL MARKET DEVELOPMENTS – Q2 2019
Figure 3. World trade and trade prices
% change, year-on-year
Source: Netherlands Bureau for Economic Policy Analysis (CPB).
From January 2018 to November 2018, steel market sentiment, as measured by the new
orders Steel Purchasing Managers’ Index (PMI) compiled monthly by Markit, has been
very volatile for the U.S. and decreased steadily for both Asia and the E.U. (Figure 4, upper
panel). The sentiment index has worsened for all three regions, and, as of February 2019,
purchasing managers of all three regions expect a decrease in new orders (index below 50).
New export orders are also expected to decline, despite a notable improvement of the
sentiment in Asia compared to the previous months (Figure 4, lower panel).STEEL MARKET DEVELOPMENTS – Q2 2019 │ 17
Figure 4. Steel Purchasing Managers’ indices (PMIs)
Note: An index less than 50 indicates that more purchasing managers expect a decrease over the next month
than an increase.
Source: Markit economics, via Datastream
2.3. Steel consumption
Figure 5 below presents the y-o-y percentage change in the combined consumption of hot-
rolled products for 10 of the world’s largest steel-consuming economies in Asia, the CIS
region, Europe, North America and South America, which together account for
approximately 75% of global steel demand. The y-o-y growth figure for the first three
months of 2018 was a robust 7.5%, compared to the same period in 2017.18 │ STEEL MARKET DEVELOPMENTS – Q2 2019
Figure 5. Consumption of hot-rolled steel products, major economies
Y-o-y % changes.
Note: Total (incl. China) represents the combined consumption of hot-rolled steel products of the following
economies: Brazil, China, Germany, India, Italy, Japan, Korea, Mexico, Russia and the U.S. Total (excl. China)
represents the combined consumption of all those economies except China. Consumption of hot-rolled products
is defined as the sum of production and net imports. According to the latest publication of ISSB, consumption
data on China is not available since April 2018 due to the lack of Chinese data on exports and imports of hot-
rolled steel products (ISSB, 2019[12]).
Source: OECD calculations based on data from ISSB (International Steel Statistics Bureau).
2.3.1. Americas
In the North American Free Trade Agreement (hereafter “NAFTA”) region, the U.S.
monthly steel consumption indicator increased by 3.7% during January to August 2018,
year-on-year. Housing and non-residential construction is contributing to the growth of
steel demand. Light vehicle production in the U.S. has also stabilized and is expected to
increase modestly (Metal Expert, 2018[13]). In Mexico, the monthly steel consumption
indicator remained flat (0.0%) during the first eight months of 2018, y-o-y. Mexican
manufacturing sectors continue showing steady demand, while construction activity
remains weak (Ternium, 2018[14]).
According to the Latin American Steel Association (Alacero), consumption of finished
steel products in Latin America remained flat in January-November 2018 (0.0%), when
compared to the same period in 2017 in January-November 2018. Steel consumption also
increased in Argentina (1%) and Ecuador (4%) during January-November 2018. In
contrast, Peru and the Bolivarian Republic of Venezuela (hereafter “Venezuela”) saw their
domestic steel consumption decrease by 17% and 66%, respectively, in the first 11 months
of 2018 (Alacero, 2019[15]).
2.3.2. Asia
The monthly consumption indicator for China, which accounts for around 46% of global
steel demand, registered a y-o-y growth rate of 7.7% in the first three months of 2018.
According to China Metallurgical Industry Planning and Research Institute (hereafter
“MPI”), the demand growth in 2018 benefited from the expansion of investments in
manufacturing and real estate, as well as an increase in exports of electrical machinery. TheSTEEL MARKET DEVELOPMENTS – Q2 2019 │ 19 one-off statistical effect from the closure of induction furnaces in 2017 is also reflected in the demand growth in 2018 — note that demand for steel supplied by these induction furnaces was not previously captured by the official statistics (MPI, 2018[16]) (People.cn, 2018[17]). Steel demand in India, the third largest steel consuming economy, remained strong. India became the second largest steel producer in 2018, registering 106.5 million metric tonnes of production (World Steel Association, 2019[18]). The monthly consumption of hot-rolled products in India increased by 30.7% during January-March 2018 compared to the corresponding time period one year earlier. The implementation of government-driven large-scale infrastructure projects, such as housing, power transmission and railways, is contributing to the growth of domestic demand (Business Standard, 2018[19]). According to the South East Asia Iron and Steel Institute (SEAISI), apparent steel consumption in the Association of Southeast Asian Nations region (ASEAN-6, i.e. Indonesia, Malaysia, Philippines, Singapore, Thailand and Viet Nam), slightly increased by 0.2% y-o-y during January-June 2018 (SEAISI, 2018[20]). Malaysia’s steel consumption increased by 6.6% y-o-y supported by growth in the demand for flat steel products used mainly in the manufacturing sector. Steel demand in Indonesia and the Philippines recorded moderate growth, of 1.2% and 3.8% y-o-y, respectively. Steel demand in Thailand has slightly recovered by 1.5% during the first half of 2018, after a significant decline in 2017 (-14%) due to destocking that followed a strong build-up of inventories in 2016 (SEAISI, 2018[21]). Steel demand in Viet Nam expanded by more than 20% per annum on average from 2014 to 2016, but started to decline in 2017 (by 5.8%) and continued to decline in the first half of 2018 (by 5.3%, y-o-y). This decline has been attributed to the slowdown in the market for long steel products, which are used primarily in construction. Singapore’s steel demand also declined by 4.9% y-o-y during the first half of 2018. In Japan, the monthly consumption indicator registered a moderate y-o-y growth rate of 1.3% in the first eight months of 2018. Steel demand from the construction, industrial machinery and automobile sectors has been firm, while demand from the shipbuilding sector remains stagnant (JISF, 2018[22]). The steel consumption indicator for Korea decreased by 5.3% in January-August 2018 compared to the corresponding time period one year earlier, explained by a slowdown in the auto and shipbuilding industries (KOSA, 2018[23]). 2.3.3. CIS In the Commonwealth of Independent States (CIS) region, the steel monthly consumption indicator for Russia recorded y-o-y growth of 0.9% during the first eight months of 2018. According to the Russian Steel Association (Russian Steel), steel demand in Russia is expected to increase in 2018, mainly supported by new infrastructure projects and investments in modernisation of downstream industries, i.e. digitalisation and investments for environmental and energy efficiency purposes (Russian Steel, 2018[24]). In Ukraine, apparent steel consumption during January-June 2018 in Ukraine has increased by 6.4%, y-o-y, supported by stable demand in key steel consuming industries, such as construction, machine-building and hardware production industries, according to Ukrainian steel company Metinvest (Metinvest, 2018[25]). 2.3.4. European Union A recent report by the European Steel Association (EUROFER) indicates that steel demand in the E.U. benefited from moderate growth in steel-using sectors in Q3 2018 (Eurofer,
20 │ STEEL MARKET DEVELOPMENTS – Q2 2019

      2019[26]). This was evidenced by the 2.3% increase in the Steel Weighted Industrial
      Production Index (SWIP).7 Apparent steel consumption in the third quarter of 2018 grew
      by 2.6% y-o-y and is estimated to have increased by 0.3% y-o-y in Q4 2018 (EUROFER,
      2019[27]). The key drivers of steel demand in Europe included the construction industry
      (+5% year-on-year during the first three quarters of 2018) and, to a lesser degree,
      mechanical engineering (+4%). Construction activity was stimulated both by residential
      and non-residential demand. In western European countries, residential demand for
      affordable housing increased due to the need for the authorities to accommodate the
      migrant flows of recent years (Eurofer, 2019[26]). In particular, German construction
      activities continued to be strong throughout 2018 (Kallanish, 2018[28]) and the momentum
      does not seem to have abated in 2019 (Kallanish, 2019[29]). Private non-residential
      investment was supported by low costs for finance, while public non-residential investment
      was supported by improvements in the budgetary situation of some European countries. In
      central European countries, the key drivers of construction activity were infrastructure
      projects and healthy domestic conditions. EU investment in machinery and equipment
      should grow at a more moderate rate going forward, due the slowdown in economic activity
      and the redirection of business investment increasingly towards the service sector.
      Eurofer estimates mechanical engineering growth to decrease to about 1.5% in 2019 and
      2020 (Eurofer, 2019[26]). Weaker demand from the automotive, steel tube production and
      the domestic electrical appliance industries explains the sluggish growth. Eurofer estimates
      that automotive industry production increased by only a meagre 1.3% in 2018, due to a
      sharp fall in the second half of 2018. Production declined in most European automotive
      markets (Kallanish, 2018[30]), and the decline was particularly felt in German car production
      (Kallanish, 2018[31]).
      Factors affecting the outlook include high vehicle ownership in the Western European
      market and the expectation that lease companies may delay purchases of cars until the
      uncertainty surrounding governments stance towards diesel cars is resolved. The transition
      to new emission testing procedures, i.e. the Worldwide Light Vehicle Test Procedure
      (WLTP)8 may also worsen the drop in demand for automobiles (Flak, 2019[32]).

2.4. Steel production

      World crude steel production increased by 4.7% in 2018 compared to the previous year,
      but with marked differences across regions. The strongest regional growth by large was
      observed in the Middle East (12.6%), followed by Africa (6.9%), China (6.9%) and
      Oceania (5.9%). North America also experienced a relatively strong y-o-y growth (4.1%).
      Steel production growth was sluggish in the Other Europe (0.5%) and CIS (0.1%) regions,
      while the European Union registered a decline in steel production in 2018 (-0.2%).
      Total crude steel production in the North America region was up by 4.1% overall during
      2018, with the U.S. registering the strongest pace of production growth (6.2%), Mexico
      growing at a slower pace (1.0%) and Canada showing a decline in steel production (-4.0%).
      In the E.U., steel production declined slightly (-0.2%) in 2018 as a whole, reversing gains
      earlier in the year. Steel output increased in the United Kingdom (U.K.) (+3.5%) and in
      Italy (+1.7%). The largest decreases in steel production were experienced in Poland (-
      2.3%), Germany (-2.0%), and Spain (-1%).
      In the “Other Europe” region, steel output growth was anaemic, increasing by a mere 0.5%
      in 2018, with Turkish steel output contracting by 0.6%. In the CIS region, steel output
STEEL MARKET DEVELOPMENTS – Q2 2019 │ 21
stagnated in 2018 (+0.1%). Russian output was flat during the period (+0.3%) and
Ukrainian production decreased (-1%).
Asian crude steel production accelerated during the second half of 2018, resulting in an
overall 5.9% growth rate over the year. China's steel production supported the increase with
a 6.9% growth rate in 2018, followed by India (4.9%), which became the second largest
steel producer in the world, Chinese Taipei (+3.5%) and Korea (2.0%). Japanese steel
production stagnated in 2018 (-0.3%).
In South America, steel production decelerated during the second half of 2018, resulting in
a mere 1.5% growth in 2018. The largest increase remained in Argentina, with production
growth accelerating to 11.6%, while Brazil grew at a more subdued pace of 1.1% in 2018.
In the Middle East, steel production increased by a strong 12.6% in 2018, y-o-y, mainly led
by Iran (17.7%), which produced 25.0 million metric tons of steel in 2018 (Worldsteel,
2018[33]). Saudi Arabia’s steel production also saw a robust increase (8.4%). African steel
production increased by 6.9% in 2018, still driven by very strong production growth in
Egypt (13.6%), while steel production remained flat in South Africa (0.4%).
Table 2. World crude steel production developments in 2018
Level, thousand mmt % change, year-on-year
Dec 2018 2017 2018 Dec 2018 2017 2018
EU 14 527 168 549 168 192 10.1 8.6 -0.2
Other Europe 3 474 40 633 40 821 -3.1 6.3 0.5
CIS 8 034 100 932 101 062 -9.5 7.6 0.1
North America 10 108 115 761 120 511 5.9 7.6 4.1
South America 3 679 43 686 44 275 2.1 7.5 1.3
Africa 1 250 13 593 14 526 2.9 5.1 6.9
Middle East 3 096 32 020 36 066 9.5 1.8 12.6
Asia, of which: 105 033 1 186 889 1 257 216 7.4 6.7 5.9
China 77 621 867 544 927 523 10.3 6.6 6.9
Oceania 474 5 985 6 341 -10.9 3.2 5.9
World 149 676 1 708 048 1 789 009 6.0 6.9 4.7
Source: World Steel Association, as of June 2018. Data are based on monthly production data and can differ
slightly from annual data published after December of each year.
2.5. World steel trade
Table 3 presents recent data on trade developments in the 10 largest steel-producing
economies. Exports from China declined by 9.3%, in the first 10 months of 2018 compared
to the same period in the previous year. Exports from the E.U. (external trade) and Japan
have also declined, by 6.4% and 3.1% y-o-y, respectively, during January-October 2018.
Exports from India, which had recorded a significant increase in 2017 (60.7%), declined
by 29.3% y-o-y in January-October 2018. Steel exports from the U.S., Korea and Brazil
have also decreased, doing so by 13.4%, 3.1% and 9.7%, respectively, during the first 10
months of 2018. Exports from Russia and Turkey increased by 8.7% and 18.3%, y-o-y, in
the first 10 months of 2018, respectively. Iran has showed a significant increase in exports
(37.2%) during the same period.22 │ STEEL MARKET DEVELOPMENTS – Q2 2019
Turning to steel imports, the E.U., the largest steel-importing economy, saw steel imports
increase by 9.6% in January-October 2018, compared to the corresponding period one year
earlier. The U.S., which had recorded a significant increase in steel imports in 2017
(14.7%), posted an import decline of 10.6%, y-o-y, during the first ten months of 2018. The
volume of imported steel products in Korea and Iran decreased significantly in the first 10
months of 2018, falling by 26.4% and 38.3%, respectively. Steel imports in Japan, Russia
and Turkey also declined by 4.2%, 2.9% and 17.7%, respectively,-during the same time
period. China and Brazil recorded increases in steel imports of 1.3% and 2.3%,
respectively.STEEL MARKET DEVELOPMENTS – Q2 2019 │ 23
Table 3. Steel trade developments across major steel-producing economies
2018 2017 % change, y-o-y
Thousands of metric tonnes 2014 2015 2016 2017
Jan-Oct Jan-Oct Jan-Oct 2018
China (People’s Republic of)* Exports 93 780 112 400 108 490 75 410 58 410 64 490 -9.3%
Imports 14 430 12 780 13 210 13 300 11 100 10 960 1.3%
EU-28 (external trade) Exports 36 451 32 998 29 193 30 508 23 635 25 254 -6.4%
Imports 31 931 37 385 41 150 41 702 38 761 35 354 9.6%
India Exports 9 828 7 117 9 933 15 964 9 241 13 072 -29.3%
Imports 9 310 13 249 9 857 8 818 7 503 7 451 0.7%
Japan Exports 41 247 40 720 40 452 37 408 30 058 31 025 -3.1%
Imports 6 657 5 850 5 965 6 186 4 956 5 175 -4.2%
United States Exports 11 581 9 620 8 920 10 081 7 378 8 519 -13.4%
Imports 40 285 35 564 29 918 34 327 26 525 29 661 -10.6%
Korea Exports 31 803 31 077 30 504 31 254 25 421 26 241 -3.1%
Imports 22 268 21 546 23 168 19 208 12 255 16 655 -26.4%
Russian Federation Exports 26 939 29 605 31 104 31 087 27 600 25 394 8.7%
Imports 5 644 4 309 4 389 6 407 5 216 5 370 -2.9%
Turkey Exports 15 965 14 687 15 117 16 083 15 503 13 107 18.3%
Imports 13 326 18 415 15 344 13 352 9 192 11 167 -17.7%
Brazil Exports 9 730 13 624 13 378 15 301 11 306 12 527 -9.7%
Imports 3 894 3 141 1 827 2 275 2 018 1 973 2.3%
Iran Exports 2 838 3 764 5 623 7 336 7 989 5 824 37.2%
Imports 4 140 4 396 4 652 3 065 1 589 2 575 -38.3%
Definition: HS 7206 to 7302, 7304-7306, and 7307.21-7307.99 excluding some forgings (7326.19), points and
switches/crossings (7302.30 and 7302.90), some forged cold finished sections (7216.69 and 7216.99), some
cold formed sections (7216.61 and 7216.91), welded shapes and sections (7301.20) and steel castings
(7325.99).
Note: The economies listed in this table are the major crude steel producing economies by production volume
in 2018 (World Steel Association, 2019[18]). This is the first time Iran is shown in this table because in 2018
Iran became the 10th largest steel producer in the world. Data for China are sourced from the General
Administration of Customs of China (GACC, 2018[34]). Therefore, the definition of steel products for data of
China are slightly different from the OECD's definition, which is used for other economies.
Source: OECD calculations based on data from ISSB (International Steel Statistics Bureau) and General
Administration of Customs of China (GACC)
2.6. Steel and steelmaking raw material prices
2.6.1. Steel prices
The uptick in steel demand from 2016 onwards supported a rebound in steel prices from
their 2015 lows, but this trend was short-lived and the price dynamics have since reversed,
with both world hot-rolled coil (HRC) and rebar prices steadily declining from their May
2018 heights (Figure 6). In the beginning of 2019, the flat and the rebar price indexes stood
at USD 590.6 per tonne and USD 554.6 per tonne respectively, close to the levels in the
beginning of 2014. Differences in prices are reflected in the price dispersion indicator
shown in Figure 6. Regional price dispersion, for both rebar and flat prices, has increased
sharply since mid-2017, reversing its earlier decline. Increases in regional price dispersion
have previously been associated with significant price declines— e.g. during 2015, price24 │ STEEL MARKET DEVELOPMENTS – Q2 2019
dispersion was very high and the price index at its lowest level during the whole 2008-2018
period.
Figure 6. Aggregate flat and rebar steel prices (latest January 2019)
Notes: The flat price and rebar price indices are defined as the arithmetic average of the individual regional
Platts price series for the U.S., North Europe, China, Japan, India and Russia, when available. This simple
arithmetic average had the closest fit to the two global Platts price indices used in Market reports prior to the
two global price indices being discontinued by Platts from September 2017 onwards. The coefficients of
variation (CV) are defined as the ratio of the standard deviation of the regional Platts price series making up
the indices to their (arithmetic) mean, and thus captures price dispersion across regions.
Source: Platts Steel Business Briefing.
Flat Steel prices increased more rapidly in the U.S. than in other jurisdictions during the
first half of 2018, but reversed course during the second half of the year (Figure 7) and
moved closer to the levels in the beginning of the year. U.S. rebar steel prices remained flat
during the period because, according to Platt’s, market players were adopting a “wait and
see” attitude (Figure 8).
Chinese and South East Asian flat and rebar prices, which had moderately increased during
the second half of 2017 and stalled in the first half of 2018, have decreased in the second
half of 2018 and are now back at their mid-2017 levels (Figure 7, Figure 8). In absolute
terms, flat and rebar prices in those regions are significantly below comparable prices in
other regions.STEEL MARKET DEVELOPMENTS – Q2 2019 │ 25
Figure 7. Steel price for flat products, by region
Source: Platts Steel Business Briefing.26 │ STEEL MARKET DEVELOPMENTS – Q2 2019
Figure 8. Steel price for rebar products, by region
Note: The stabilisation of U.S. rebar price during the last months is explained by a market attitude of “wait and
see” since the new, higher price level has been reached, according to the explanation provided by Platt’s
analysts to the OECD Secretariat on June 2018.
Source: Platts Steel Business Briefing.
2.6.2. Steel futures prices
As shown in the previous report on steel market developments (OECD, 2018[35]), steel
future prices tend to move quicker than steel prices, suggesting that they are better able to
predict steel price dynamics by incorporating new market information more rapidly.
For the purpose of analysis, this paper uses continuous steel price indices, constructed from
a number of steel future contracts by rolling them over. More precisely, each month the
price data are extracted from a different steel contract price series of the same maturity than
the contract used one month prior. Figure 9 below shows three steel future continuous
contracts, as provided by Thomson Reuters Datastream. There has been a steady decrease
from 2018 onwards, suggesting that the downward trend observed for spot steel prices is
expected by traders to continue in the short term.STEEL MARKET DEVELOPMENTS – Q2 2019 │ 27
Figure 9. Steel future prices
Indices of three continuously rolled steel futures contract prices, USD per tonne
Note: NYMEX US Midwest futures prices were converted to correspond to metric tonnes rather than tons.
SHFE Steel rebar futures prices were converted from RMB to USD using daily exchange rates at closing. For
more information on contract specifications, please refer to https://www.lme.com/en-GB/Metals/Ferrous/Steel-
Rebar#tabIndex=0 for LME steel rebar contracts; to
http://www.shfe.com.cn/en/products/SteelRebar/contract/9220216.html for SHFE steel rebar continuous
contracts, and to https://www.cmegroup.com/education/files/hot-rolled-coil-steel-index-futures-options.pdf for
NYMEX US Midwest HRC contracts. For a throughout description of futures contracts and steel futures
markets, see (OECD, 2018[35]).
Source: Thomson Reuters, Datastream.
2.6.3. Steelmaking raw material prices
Prices of key steelmaking raw materials declined between early 2011 and the beginning of
2016, contributing significantly to lower steel production costs during that period.
Nevertheless, this trend reversed in 2016, when raw material prices slowly climbed back
towards their 2011 levels. Prices of steelmaking raw materials continued to increase in
2017, albeit at a slower pace. In 2018, iron ore prices stayed relatively flat, while scrap
prices and coking coal prices declined (Figure 10).
Iron ore prices stabilised at around USD 72 per tonne as of 31 December 2018, up from
USD 64 in June 2018 but well below their high of USD 83 per tonne in March 2017. Coking
coal prices have stabilised at USD 196 per tonne as of 31 December 2018, after a volatile
2016-2017 period. Scrap prices decreased steadily during the course of 2018, reversing
most of their 2017 gains, falling to USD 264 per tonne (FOB Rotterdam) as of 31 December
2018.You can also read