STEICO SE Half Year Report 2018 - The green shares
←
→
Page content transcription
If your browser does not render page correctly, please read the page content below
STEICO SE
Half Year Report 2018

                                                             The green shares

6M                                               2018
Record-breaking profitability despite slower pace of sales

Natural building products for healthier living
Overview
H1 2018
Record-breaking profitability despite slower pace of sales
Revenue growth in € millions Gross earnings growth in € millions
125 122.8 125
114.6 +7.2%
100 100
75 75
+14.6% 56.6
49.4
50 50
25 25
€m
€m
17
18
17
18
20
20
20
20
H1
H1
H1
H1
EBITDA growth in € millions EBIT growth in € millions
25 25
+16.3% 21.4
20 18.4 20
15 15
+17.0% 12.4
10.6
10 10
5 5
€m
€m
17
18
17
18
20
20
20
20
H1
H1
H1
H1
EBT growth in € millions Growth in net income for the period in € millions
15 15
+20.2% 11.9
12 12
9.9
9 9 +32.8% 8.5
6.4
6 6
3 3
€m
€m
17
18
17
18
20
20
20
20
H1
H1
H1
H1
| ADDITIONAL KPIS
6M 2018 FY 2017 6M 2017
1. Total operating revenue in € millions € 119.8 million € 232.3 million € 113.2 million
2. EBITDA margin as a percentage of total operating revenue 17.9% 16.3% 16.3%
3. EBIT margin as a percentage of total operating revenue 10.4% 9.5% 9.3%
4. Equity ratio (as of June 30 or December 31) 51.3% 53.9% 43.4%
Percentage increases and margins calculated based on rounded figures. As a result of the reclassifications there are differences compared to the
previous year’s figures.
2 STEICO Semi-annual report 2018Half Year Report 2018
The STEICO Group continued its growth in the first six months
of 2018 with new record-breaking revenues and earnings.
The pace of sales was slightly slower, up by 7.2% to € 122.8 million.
This was due to the poor weather conditions in the first quarter,
which resulted in slower construction activity in the UK in particular.
In addition the weaker exchange rate for pounds sterling lead to
a downturn in the timber wholesale business in the UK. On this
market STEICO offers various wooden products to supplement its
own I-joists. These are purchased as merchandise in the eurozone.
In terms of its earnings, the STEICO Group once again
proved its profitability. EBITDA improved compared to the
first six months of the previous year by 16.3% to € 21.4
million. EBIT lifted by 17.0% to € 12.4 million. Net income
for the period increased by 32.8% to € 8.5 million.
The EBITDA margin of 17.9% and the EBIT margin of
10.4% mean that the first half of the year also reached
new record-breaking figures in terms of profitability.
As a result of the slightly slower pace of sales in the first
six months, the company’s management is now aiming for
revenue growth over the year as a whole in the upper single-
digit percentage range. In contrast, in terms of earnings, above
average growth is also forecast for the year as a whole.
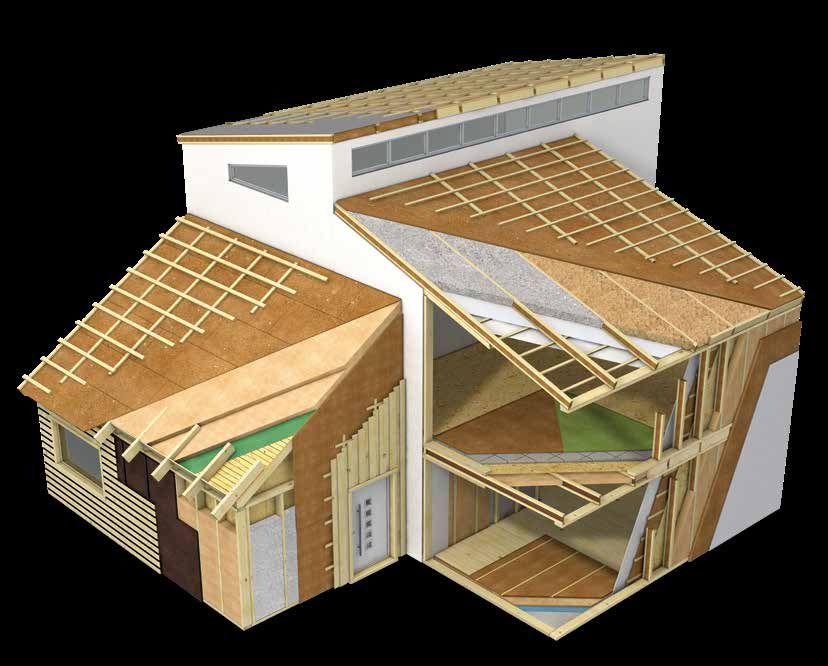
Company profile
STEICO develops, produces and markets ecological The construction elements comprise I-joists and
construction products made of renewable raw Laminated Veneer Lumber. In addition, the STEICO
materials. STEICO is the European market leader in group also produces fiberboard and operates in the
the wood-fiber insulation materials segment. wood trade.
STEICO is positioned as a system provider for The Munich-based company’s products are used
ecological residential construction and is the only in new construction and when renovating roofs,
manufacturer in the industry to offer an integrated walls, ceilings, floors and facades. STEICO’s products
wooden construction system in which insulation allow the construction of future-proof, healthy
material and construction components supplement buildings with a particularly high quality of living
each other. These include flexible and stable wood and a healthy atmosphere. STEICO’s products offer
fiber insulation panels, composite thermal insulation reliable protection against cold, heat and also noise,
systems, insulation panels with a reinforcing effect, and they permanently improve the building’s energy
as well as cavity wall insulation made of wood fibers efficiency.
and cellulose.
Disclaimer
This document is an abbreviated version of the German original document. The translation has been prepared
with utmost care. However, only the German original document is binding.
STEICO Semi-annual report 2018 3Growth of STEICO’s shares
Charts
Year 2017
A. PRICE GROWTH IN 2018 Year 2018
105 45,0
STEICO’s shares started the first six months of the year with a
price
90 of € 21.75 onSE2 January 2018. In the following months,
STEICO 37,5 STEICO SE
the share price lifted, however after patchy growth it fell
75 to its price from the start of the year as of 3 April, the
back 30,0
lowest
60 price in the first six months of the year. In contrast, 22,5
the second quarter was characterised by stable growth. On
45 June the shares reached their highest price in the first half
14 15,0
of
30the year at € 28.30. After profit-taking, STEICO’s shares 7,5
closed at a price of € 25.50 in Xetra trading on 29 June. This
15
corresponds to a share price increase of 17.2% in the first six 0
months
0 of 2018. -7,5
in% in%
B. INVESTOR RELATIONS
17
17
17
17
17
18
18
18
18
18
18
18
20
20
20
20
20
20
20
20
20
20
20
20
1.
3.
6.
9.
2.
1.
1.
2.
3.
4.
5.
6.
As was the case in previous years, STEICO SE is engaged in
.0
.0
.0
.0
.1
.0
.0
.0
.0
.0
.0
.0
02
31
30
30
29
02
31
28
29
30
30
29
open and direct communication with the capital markets
in the first half of 2018, and is in close contact with its
shareholders. In addition to the transparency policies for the Basic Board and m:access, STEICO SE fulfilled its publication
requirements,
H1: Earnings and for example
Expenseswith end-to-end communication in German and English and the regular publication of quarterly
ratio
reports. In addition, up-to-date press releases and financial reports are also always published on the Web site www.STEICO.
120
com/ir. Information on key events is disseminated via a well-known institution to comply with publicity obligations.
+2,0% -54,7%
100
In July 2018 STEICO was rewarded with ISS-oekom’s “Prime award” for its corporate responsibility.
80
60
-18,2%
40
-7,5 -11,2%
20 10,4%
C. CAPITAL MARKET DIARY 2018
%
11/12 January 2018 STEICO presented the company at the 21st ODDO Forum, held by ODDO BHF in Lyon (France)
5 February 2018 Publication of provisional figures for 2017
e
e
s
es
n
es
IT
ial
om
om
io
EB
ns
ns
at
er
6 February 2018 STEICO presented the company at the HSBC SRI Conference (Frankfurt am Main)
pe
pe
nc
inc
tiz
at
si
ex
ex
m
or
g
os
tin
21/22 February 2018 STEICO presented the company at the “12th German Conference” held by ODDO BHF
Am
of
el
g
tin
Gr
nn
ra
st
ra
pe
so
Co
26 April 2018 Publication of the 2017 STEICO annual report
pe
r
ro
Pe
ro
he
26 April 2018 Publication of STEICO’s 2018 Q1 report
he
Ot
Ot
15 May 2018 STEICO presented the company to institutional investors in Brussels (roadshow with ODDO BHF)
23 May 2018 STEICO presented the company to institutional investors in Frankfurt/Main (roadshow with Commerzbank)
5 June 2018 STEICO presented the company to institutional investors in Zurich (roadshow with ODDO BHF)
6 June 2018 STEICO presented the company to institutional investors at the ODDO BHF Nextcap Forum (Paris)
21 June 2018 STEICO SE’s 2018 Ordinary General Meeting
19 July 2018 Publication of STEICO’s 2018 semi-annual report
October 2018 Publication of STEICO’s 2018 Q3 report
18 October 2018 STEICO presents the company at Munich Stock Exchange’s “Specialist Conference for Technology”
Current dates for the capital markets are published online at www.steico.com/ir.
4 STEICO Semi-annual report 2018Half Year Report 2018
Group management report for STEICO SE as of 30 June 2018
A. FOUNDATIONS fundamental difference between the two methods is that
wet fibers are processed (formed to make boards) in the wet
I. STEICO SE’S BUSINESS MODEL method, and in the dry method the fibers are dried before
forming the boards. The dry method can be used to produce
fibers for cavity insulation, flexible (compressible) mats or
1. OVERVIEW
stable insulation boards.
STEICO develops, produces and markets ecological
Air injected insulation
construction products made of renewable raw materials.
STEICO is the European market leader in the wood-fiber Air injected insulation is made of loose insulation fibers or
insulation materials segment. insulation flakes which are blown into construction cavities at
high pressure, where they then compress. The STEICO Group
STEICO is positioned as a system provider for ecological
produces and sells air injected insulation material made of
residential construction and is the only manufacturer in the
wood fibers and also cellulose flakes.
industry to offer an integrated wooden construction system
in which insulation material and construction components Construction products I-joists
supplement each other. These include flexible wood fiber
I-joists are supporting components which are optically very
insulation materials, stable wood fiber insulation boards,
similar to traditional double-T-joists. They comprise two
wood fiber insulation boards for facade insulation (“ETICS”),
“belts” (square timber posts made of Laminated Veneer
bracing insulation boards, cavity insulation made of wood-
Lumber) which are connected using a fiberboard, also
fiber and cellulose as well as system products to insulate
made by STEICO. STEICO’s I-joists offer an alternative to
building shells. Construction elements comprise I-joists and
standard construction products such as construction lumber
Laminated Veneer Lumber. In addition, the STEICO group
or laminated timber in terms of both their price and energy
also produces Natural Fiber Boards and operates in the wood
consumption.
wholesale trade. The product range in the United Kingdom
also include products for ceiling and floor construction. Construction products Laminated Veneer Lumber
(LVL)
The STEICO Group’s production equipment can also be used
to produce a wide variety of specialty products such as door
is a high-performance wood material and comprises several
panels, pin-boards, etc. which are sold to various industrial
layers of wood laminate glued together. It is characterised
customers.
by its particularly high rigidity and ability to bear loads, while
simultaneously offering high dimensional stability. Laminated
2. THE STEICO GROUP’S PRODUCTS AND SERVICES
Veneer Lumber is used both in the construction industry and
The STEICO Group is a system provider for natural also in industrial applications (for example to produce doors
construction products for insulation and construction. and furniture). It is also a key component for I-joists (belt
The core range comprises “natural wood-fiber insulation material). The STEICO Group took its first production line for
materials”. In the first six months of 2018 the bulk of Laminated Veneer Lumber into operations in Czarna Woda
revenues (60.8%) was recorded with environmentally friendly in 2016. As a result of the high demand, the construction of
wood-fiber insulation materials and cavity insulation for a second production line for Laminated Veneer Lumber was
building and floor insulation. started the same year. The second line went live in the fourth
quarter of 2017 (for further information see B.II.3.).
The STEICO Group’s current range of products and services
comprises: Timber wholesale
Wood-fiber insulation materials The STEICO Group operates in timber product wholesale in
Germany. These products stem from the company’s former
STEICO insulation materials are mode of fresh soft wood.
orientation and these operations are being continued with
They are used in new buildings and renovation work,
a lower number of employees. The company generates
protecting against the cold, heat and noise.
revenues with wood products which are mostly imported
Wood-fiber insulation materials are produced by the from south-eastern European countries and Poland. Clients
subsidiaries using various methods - both the wet and are the timber wholesale trade and furniture industry in
the dry method. Both methods break down wood into Germany. The range of merchandise spans sawn timber
individual fibers using steam and mechanical treatment. The
STEICO Semi-annual report 2018 5Group management report for STEICO SE as of 30 June 2018
through to semi-finished products for furniture making (e.g. In France wood is procured on the free wood market. The
products cut to customer specifications). wood is sourced from sustainably managed forests from the
region surrounding the production facilities.
STEICO UK Ltd. runs wholesale operations in the United
Kingdom with wood and wooden composite boards to
4. SALES AND CUSTOMERS
supplement its sales of I-joists. It has become standard
practice on the UK market for construction companies to The STEICO Group’s direct customers are mostly broken
offer end-to-end ceiling systems - including planning, the down into the customer groups of wood and construction
supporting structure (I-joists) and wooden composite boards materials traders, large wood construction companies and
to construct the floor - all from a single source. pre-fabricated home construction companies as well as DIY
stores (in some cases via distributors) as well as industrial
Special products
customers (e.g. manufacturers of laminated/parquet
The special products segment bundles all of the products flooring, furniture manufacturers, construction material
that the group produces itself which are not directly allocable manufacturers).
to the construction sector. These include, for example,
Other key customer groups include:
fiberboards for pinboards or door fills, as well as other
products for industrial applications. • Craftsmen and wood construction companies which
process the group’s products.
Natural fiber boards (hardboards)
• Architects and planners, who take decisions to use
The production of natural fiber boards is similar to the
STEICO’s products when planning buildings.
production of wood-fiber insulation materials made using the
wet method. The difference is that wet fibers are pressed to • Private and institutional builders who use STEICO’s
form stable boards using particularly high pressure. Natural products in their buildings.
fiber boards are used in the furniture industry. Natural fiber
boards are used in the furniture industry where they are
used, for example, to form the backs of cupboards or the
bottoms of drawers. In addition, they are used as standard
construction boards on many markets, for example for roof
boards. Within the STEICO Group, natural fiber boards are a
key component in the production of I-joists, where they form
the so-called bar. Sales to external customers is no longer of
any strategic importance due to the low margins.
Miscellaneous
The Miscellaneous segment bundles various peripheral
activities, such as ETICS accessories, vapour barriers and
other accessories such as tools for processing insulation
material.
Services
STEICO offers a range of supplementary services, such as its
“STEICO Academy” seminars. These seminars train craftsmen,
architects, trade representatives and also people building
there own home in how to use the STEICO construction
system. In addition STEICO has its own department for
technical advice for craftsmen, planners and builders. As a
rule services are preformed free of charge.
3. PROCUREMENT
The fresh wood require to produce wood fiber products
is mostly procured in Poland from the Polish State Forest.
6 STEICO Semi-annual report 2018Half Year Report 2018
Group management report for STEICO SE as of 30 June 2018
II. CONTROL SYSTEM AND SHAREHOLDER B. ECONOMIC REPORT
SYSTEM
I. OVERALL ECONOMIC AND INDUSTRY-SPECIFIC
STEICO SE is responsible for sales management, marketing, UNDERLYING CONDITIONS
investments, product development, finance and financial
control in its position as the group’s holding company. 61.1%
1. ECONOMIC TREND
of shares are held be the CEO/managing director Mr. Udo
Schramek, and the remaining 38.9% is in free float. The economy in Europe is continuing its positive growth.
Stable GDP growth in the eurozone is going hand in
hand with positive growth forecasts. However, there are
risks from growing protectionism, an increasing lack of
III. RESEARCH AND DEVELOPMENT
specialist workers and the uncertain outcome of the Brexit
negotiations.
R&D activities in the first half of 2018 focused on optimising
product characteristics for wood fiber insulation boards as In the first six months of 2018 the European construction
well as developing new products as part of the product sector suffered from the poor winter weather. Structural
range, in particular: engineering production increased by 1.9% in the first quarter
of 2017 in the EU28 countries, however it fell by 0.5% in the
• Supporting research work in parallel to operating the
first quarter of 2018. It was only possible to record growth
Group’s own production line for Laminated Veneer Lumber
compared to the same month of the previous year in April.1
and taking the second line into operation.
The construction sector in Germany continued to enjoy
• Research activities to develop formaldehyde-free biding
robust growth at a high level. Planning permission for
agents for wood materials and other adhesives
residential properties was up by 0.7% year-on-year in the
• Further development of cellulose cavity insulation period from January to April 2018. Over the same period
the number of building permits issued for hostels (including
• Developing and optimising wet method wood fiber
accommodation for refugees) fell strongly (-32.9%). Without
insulation materials
taking hostels into account, the number of permits even
• Developing and optimising dry method wood fiber lifted by 2.8%. Multi-family homes recorded particularly
insulation materials strong growth of 5.0%. In contrast, the number of building
permits for semi-detached houses fell by 1.7%, and 0.5%
• Research to optimise the fire and mouldering performance
fewer permits were issued for detached houses.2
for STEICO’s insulation materials
Competition for wood fiber insulation materials continues to
• Research to optimise the heat conduction properties for
be intense. However, prices have stabilised over the past few
STEICO’s insulation materials
months. This is probably also due to the high level of capacity
• Research to measure heat conduction using wet samples uptake for production equipment throughout the industry.
• Research to reduce VOC emissions from wood fiber
2. COMPETITION
insulation materials
With regard to wood-fiber insulation materials, in the first
Future R&D work will continue to focus on building the
six months of 2018 the most important competitors were
integrated construction system.
Soprema with its Pavatex brand (France), Gutex (Germany),
Homatherm (Germany - after bankruptcy now a brand of
HOMANIT Building Materials), Schneider (Germany) and
Hunton (Norway).
In terms of fiberboards, in STEICO’s view the most important
competitors in the first half of 2018 were Fibris (Poland),
Homanit (Poland), Woodway Group (Russia), Huntonit
(Norway) and Finnish Fiberboard (Finland).
1 Source: Eurostat, press releases dated 17.05.2017 and 19.06.2018
2 Source: Destatis; Press release dated 19.06.2018
STEICO Semi-annual report 2018 7Group management report for STEICO SE as of 30 June 2018
The company’s management believes that in the first six Compensation for higher energy costs
months of 2018 its key competitors for I-joists are Metsä
(Finnland), Masonite (Sweden), as well as James Jones The costs of energy (heat, electricity, logistics costs) have
(United Kingdom). increased substantially over the past few months. It is unlikely
that these costs will fall again over the short term. The
The most important competitors for Laminated Veneer
STEICO Group has been primarily investing in using biomass
Lumber in the first half of the year were Metsä (Finland)
as a source of energy for several years, in order to become
Stora Enso (Finland), Lousiana Pacific (USA), as well as Taleon
more independent of fossil fuel. In spite of this, however,
Terra (Russia), however STEICO continues to supply this
current cost increases have made it unavoidable to react with
company with Laminated Veneer Lumber as merchandise (to
a moderate increase in the price of STEICO’s product range.
supplement its own production).
This price increase will take effect during the course of the
third quarter.
II. COURSE OF BUSINESS
1. KEY EVENTS IN THE FIRST SIX MONTHS 2018
Staff changes in the board of directors
STEICO SE announced a new Head of Production on 24
April 2018. The former director, Mr. Steffen Zimny, has left
the board of directors. Mr. Holger Jödecke, who has been
a member of the board since March 2017, has taken over
responsibility for Production.
2. UNDERLYING CONDITIONS FOR PRODUCTION AND
SALES
Start of operation for the second production line for
Laminated Veneer Lumber (LVL)
The “80% performance test” was been successfully passed
by the second production line for Laminated Veneer Lumber
at the plant in Czarna Woda (Poland) on 7 November
2017. The 80% performance test marks the start of regular
production. However the line’s supplier must still further
optimise some of the line’s components before it passes the
100% performance test (final acceptance) in total. The board
of directors believes that final acceptance of the line will be
issued at the end of the third quarter of 2018.
New production lines for wood fiber insulation materials
to go live
Both of the new lines for the production of wood fiber
insulation materials (stable insulation materials and flexible
insulation materials made using the dry method) are set to
go live on schedule, which means that regular operation is
scheduled for the third quarter of 2018.
8 STEICO Semi-annual report 2018Half Year Report 2018
Group management report for STEICO SE as of 30 June 2018
H1 2018: Revenue share by products
3. COURSE OF BUSINESS3 boards. As these products are mostly used as components
Others 2.5%
for I-joists, sales to third parties
Hardboards 2.3% is not of any strategic
During the first six months the STEICO Group’s revenues
H1 2018: Development importance.Timber wholesale 3.3%
lifted by 7.2%. Germany, revenues by products
the core market, in €growth
recorded millions
(122.8 Mio. € total) Special products 6.4%
of 6.9%, with growth in France lifting by 18.0%, however In addition, slight downturns in sales were also recorded in
sales in the United Kingdom fell by 14.5%. This is due to the Scandinavian countries, with the STEICO Group being able to
+7,7%* Laminated Veneer
harsh
80 winter in the first quarter of the year, which practically record very pleasing
Lumber 11.7% growth on all of its other markets.
74,5
brought the UK construction industry to a standstill. This
69,2
70 Ecological insulation
also lead to a downturn in the sale of I-joists, and it was not materials 60.8%
possible
60 to compensate for this in the second quarter.
I-joists 13.0%
In50addition, STEICO also trades in wooden products in the
UK. These products, such as chipboards used in ceiling
40
construction, are offered as a supplement to the I-joists, as
UK30 customers have-7,0%
demanded end-to-end ceiling systems
+60,0%are purchased in the
in the past. The wooden products
17,2
20 3,9%
16,0
eurozone, than they are sold in the UK in sterling.-25,5%However, H1 2018 Revenues by market
14,4
-20,0% +19,2%
H1 2018: Revenue share by markets
this
10 resale business is being made significantly more difficult
7,9
9,0
7,6
5,5
4,1
3,1
2,6
due to the lower value of sterling as a result of the “Brexit”.
3,5
2,8
Italy 4.1%
€m
As price increases are only possible to a very limited extent, Alpine Region 4.2%
H1 17 18 17 18 17 18 17 18 17 18 17 18 17 18
this resale business fell substantially in the first half of the
Rest of World 5.6%
er n
sts
LV r
ts
ale
rd s
rs
year. However, the low margins in the resale business meant
r ( ee
o a rd
at io
uc
he
s
L)
s)
oi
les
db a
be n
m ulat
ial
od
ar Bo
Ot
m Ve
I-j
ho
that this downturn did not impact STEICO’s profitability. Poland 6.0%
pr
s
(H iber
Lu t e d
l in
rw
ial
ina
ica
Germany
lF
be
ec
Remaining Eastern
ra
The markets in Poland and the rest of Eastern Europe are
og
m
Tim
Sp
32.8%
tu
La
Europe 6.3%
ol
Na
Ec
enjoying pleasing growth, the slight downturn in sales in
Poland is mostly due to the lower sales of natural fiber Rem. Western and
Southern Europe 6.8%
3 All of the change rates have been calculated based on non-rounded Scandinavian
figures. Countries 6.8%
United Kingdom 12.0% France 15.4%
H1 2018: Development revenues by market in € millions
(122.8 Mio. € total)
+6.9%*
40.4
40
37.8
* Rate of change from H1 2017 to H1 2018
35
30
25
+18.0%
-14.5%
19.0
20
17.2
16.1
14.7
15
-3.4% +6.3% +22.2% -1.4% +60.5% +18.6% +6.4%
10
8.7
8.4
8.4
7.9
7.7
7.4
7.3
6.9
6.3
5.0
5.1
4.7
5
4.3
4.3
€m
H1 17 18 17 18 17 18 17 18 17 18 17 18 17 18 17 18 17 18 17 18
y
e
m
tri n
Be Eur nd
t P u ro r n
d
ld
lan n
ly
an
nc
un ia
er io
an
Ita
or
do
ou E aste
es
Lu e
ol pe
d)
cl. n n a
co inav
itz Reg
rm
F ra
Ne op
l
W
Po
ng
x)
d)
(in her ter
E
Ge
an
of
d
Ki
Sw e
ing
an
ut es
a+ lpin
st
d
So . W
Sc
ite
ain
Re
A
Un
m
m
Re
Re
ith
tri
(w
us
(A
STEICO Semi-annual report 2018 9Group management report for STEICO SE as of 30 June 2018
4. GROWTH IN THE PRODUCT SEGMENTS developed for central Europe. In addition sales on overseas
markets are also being reinforced.
In terms of environmentally friendly insulation materials,
STEICO is benefiting from the stable construction sector The sale of Laminated Veneer Lumber contributed around
and the trend to environmentally friendly building materials. € 14.4 million to total revenues in the first six months.
This segment grew in the first six months by 7.7% to € 74.5 This corresponds to an increase of 60.0%. The company’s
million. management believes that it will be possible to record
significant revenue growth in future in this segment, as the
The sale of I-joists (construction products) fell slightly in
100% performance test for the second laminated veneer
the first half of 2018 by 7.0%. As a result these products
production line has not yet fully taken place.
accounted for € 16.0 million of revenues. This is mostly
due to the weaker sales in the United Kingdom (see B.II.3.). The specialty products segment enjoyed stable growth and
However, the company’s management believes that this contributed € 7.9 million to total revenues in the first six
segment will grow again in future. Specific product versions months.
as wall studs in timber frame construction are currently being
Business with natural fiber bords (hardboards) was
significantly negative in the first six months, down 20%.
H1 2018 Revenues by product segment
H1 2018: Revenue share by products This development also reflects the fact that natural fiber
boards are increasingly being used within the company as a
Others 2.5%
Hardboards 2.3%
component for I-joists and that sales to third parties are of
Timber wholesale 3.3% no strategic importance.
Special products 6.4%
The timber wholesale segment also recorded a major sales
downturn of 25.5%, which is due to the changes in the
Laminated Veneer
resale business in the United Kingdom (see B.II.3.).
Lumber 11.7%
Ecological insulation The “Miscellaneous” products segment enjoyed positive
materials 60.8% growth and contributed € 3.1 million to total revenues in the
first six months.
I-joists 13.0%
H1 2018: Development revenues by products in € millions
(122.8 Mio. € total)
H1 2018: Revenue share by markets
+7,7%*
80 Italy 4.1%
74,5
69,2
70Alpine Region 4.2%
* Rate of change from H1 2017 to H1 2018
Rest of World 5.6%
60
Poland 6.0%
50
Remaining Eastern Germany
Europe
40 6.3% 32.8%
30
Rem. Western and -7,0%
Southern Europe 6.8% +60,0%
17,2
20 3,9%
16,0
14,4
Scandinavian -25,5%
-20,0% +19,2%
Countries 6.8%
7,9
9,0
7,6
10
5,5
4,1
3,1
2,6
3,5
2,8
€m
United Kingdom 12.0% France 15.4%
H1 17 18 17 18 17 18 17 18 17 18 17 18 17 18
er n
sts
LV r
ts
ale
rd s
rs
r ( ee
o a rd
at io
uc
he
s
L)
s)
oi
les
db a
be n
m ulat
ial
od
ar Bo
Ot
m Ve
I-j
ho
pr
s
(H iber
Lu t e d
l in
rw
ial
ina
ica
lF
be
ec
ra
og
m
Tim
Sp
tu
La
ol
Na
Ec
10 STEICO Semi-annual report 2018Half Year Report 2018
Group management report for STEICO SE as of 30 June 2018
III. NET ASSETS, FINANCIAL POSITION AND In terms of both revenues and earnings this was the most
RESULTS OF OPERATIONS successful quarter in the company’s history.
As a result of the reclassifications there may be differences 2. FINANCIAL POSITION AND NET ASSETS
compared to the previous year’s figures.
Total assets increased slightly as of 30 June 2018 to around
€ 305.7 million compared to 31 December 2017 (€ 298.7
1. RESULTS OF OPERATIONS
million).
In total, the STEICO Group’s revenues lifted by 7.2% to
In line with the ongoing projects to increase capacity,
€ 122.8 million in the first half of the year (previous year:
property, plant and equipment increased to € 203.8 million
€ 114.6 million) which is due to both the high demand for
(31 December 2017: € 200.5 million).
environmentally friendly insulation materials as well as the
increases in Laminated Veneer Lumber. The increase in receivables and other assets to € 43.1 million
is due to the higher order volumes in the summer months,
During the first six months the level of finished goods and
as was also the case in previous years (31 December 2017:
work in progress fell. Total operating revenue amounted to
€ 34.0 million).
€ 119.8 million (previous year: € 113.2 million).
On 30 June 2018 the item cash in hand and bank balances
The cost of materials ratio amounted to 54.7%, substantially
amounted to € 18.1 million (31 December 2017: € 25.5
lower than in the same period of the previous year at 58.9%,
million). This downturn is due to the ongoing capital
which played a key role in improving earnings. The personnel
expenditure.
expenses ratio in the first six months was 18.2% (previous
year: 16.9%). This increase is due to the staff increases which Equity and liabilities are characterised by an increase in
have already been implemented for both production and liabilities to banks to € 99.1 million (31 December 2017:
sales in view of the second Laminated Veneer Lumber line. € 90.7 million). This is due to the ongoing investment
We believe that the in future personnel costs will grow at a projects to increase capacity, which are financed via the
slower rate than revenues. existing syndicated credit agreement.
The other operating expenses ratio is 11.2% (previous On 30 June 2018 equity amounted to € 157.0 million (31
year: 10.4%). This increase is due to factors including the December 2017: € 161.0 million). This corresponds to an
impairment of CO2 certificates and exchange rate differences. equity ratio of around 51.3% (31 December 2017: 53.9%).
The financial result totals € -0.5 million (previous year: € -0.6
million).
Consolidated net income for the first six months totaled € 8.5
million (previous year: € 6.4 million), up 32.8%.
Q2 – viewed in isolation
Revenues of € 63.6 million were recorded in the second
quarter (previous year: € 60.5 million) This corresponds to an
increase of 5.1%.
Total operating revenue amounted to € 61.7 million (previous
year: € 58.3 million).
Gross profits amounted to € 30.2 million (previous year:
€ 25.8 million).
EBITDA in the second quarter lifted by 20.0% to € 12.0
million (previous year: € 10.0 million). EBIT grew by 26.7%
compared to the same quarter of the previous year and
totaled € 7.6 million (previous year: € 6.0 million). The
EBITDA margin is 19.4% (previous year: 17.1%), the EBIT
margin is 12.3% (previous year: 10.3%).
STEICO Semi-annual report 2018 11Group management report for STEICO SE as of 30 June 2018
Charts
3. LIQUIDITY million). This is deposited current accounts. The
group pursues a risk-minimising investment
H1 2018: Cash flows in € millions approach which ensures that liquidity is guaranteed
until it is used for further investments.
40 4.8 -20.4
35 9.4
IV. NON-FINANCIAL PERFORMANCE
30 INDICATORS
25.5
25
Environmental protection
20 -1.2
18.1
As a sales company with an extensive product range
15 of environmentally friendly products, the STEICO
Group attaches great importance to having a low
10
environmental impact and saving natural resources.
5 The wood from which STEICO’s products are made
originates from sustainably managed forests, which
€m
are mostly certified according to the well-known
organisations FSC® (Forest Stewardship Council) or
rio ts
tiv om
rio ts
tiv om
ge
pe alen
tiv om
pe alen
nd
es
nd
ac fr
es
an
es
PEFC® (Programme for the Endorsement of Forest
iti
ac fr
ac fr
g w
iti
th uiv
ch
iti
th quiv
ng ow
cin flo
ing flow
of eq
ed
Certification Schemes).
sti fl
an sh
d he
e
e
lat
ve ash
rt sh
er sh
fin Ca
en as
sta ca
re
o p Ca
of
ins C
e dc
at
ge
th and
The IBR® seal means that STEICO’s insulation
n
an
at sh a
at sh
ch
materials have a recognised seal of quality for
e
th
Ca
Ca
Ex
environmentally friendly, safe and functional
Cash flow from operating activities construction products. In addition, since February
2016 the STEICO Group holds an environmental product
During the past six months, the STEICO Group recorded a
declaration (EPD) for wood fiber insulation materials which
cash flow from operating activities of € 9.4 million (2017
offers additional proof of its dedication to sustainability.
as a whole: € 25.5 million). During the first six months of
the year the cash flow from operating activities is generally Products from STEICO’s range are tested regularly by the
Share of prefabricated Houses in Germany
impacted by a particularly high level of trade receivables and, well-known consumer magazine ÖKO-TEST and have always
+10.7%
as a result, the high volume of business due to construction received the best grade of “very good” in the past. In the
20 19.7
activities in the summer months. latest test in August 2017 the product “STEICOzell” once
19 again received a grade of “very good”.
Cash flow from investing activities +4.7%
18 +4.9% Protecting
17.8 the environment is one of the key basic pillars of
The cash flow from investing activities totaled € -20.4 million
17.0 STEICO’s corporate philosophy. The STEICO Group uses its
17 six months of 2018 (2017 as+3.2%
in the first a whole: € -46.0
+2.6 % activities and awards to show that growth and sustainability
due%to payments made 16.2
million) and is mostly+1.3 for investments
16 15.7 can go hand in hand and thus reinforces its position as
in property, plant and equipment.
15.3 The largest block of capital
15.1 one of the leading companies for environmentally friendly
expenditure
15 is the construction of an additional biomass
construction products.
power plant at the facility in Czarnków.
%
Staff
Cash flow from financing activities
11
12
13
14
15
16
17
As of 30 June 2018 the STEICO Group had an average of
20
20
20
20
20
20
20
The cash flow from financing activities was positive in
1,609 employees (without suspended employees) (previous
the first six months at € 4.8 million (2017 as a whole:
year:
Building permits for prefabricated single and double family houses 1,479). The STEICO Group’s employees play a key role
(mainly
€ 27.6 million). This item is characterised by receipts and
timber construction). Source: Bundesverband Deutscher Fertigbauine.V.
the group’s long-term success. STEICO companies aim to
payments from funds from the syndicated loan to finance
acquire highly qualified staff and keep them in the group.
investment projects and dividend payments.
This is based on an open corporate culture, which is based on
As of 30 June 2018 the STEICO Group’s cash and cash flat hierarchies, respect and a willingness to perform. Training
equivalents totaled € 18.1 million (previous year: € 25.5 activities are actively promoted to reinforce employee loyalty.
12 STEICO Semi-annual report 2018Half Year Report 2018
Group management report for STEICO SE as of 30 June 2018
C. REPORT ON EVENTS AFTER THE
BALANCE SHEET DATE
There were no special events between 30 June 2018 and the
date on which this report was published.
D. OPPORTUNITY AND RISK REPORT,
FORECAST
The following comments in the opportunity and risk report
and in the forecast are, by their very nature, associated with
a certain degree of forecasting uncertainty.
I. FORECAST
The forecast for the second half of the year is governed by
the following factors:
The market for wood fiber insulation materials is continuing
to enjoy dynamic growth and the company’s management
believes that it will record higher growth rates than the entire
market for (conventional) insulation materials. In addition,
the company’s management believes that the announced
price increase will allow the it to compensate for further
increases in energy costs.
I-joists will continue to increase their share of the continental
European market. The United Kingdom continues to be
the most important sales market. The extent to which the
“Brexit” negotiations will impact the UK’s construction
sector cannot yet be reliably forecast. However, at present
the British construction sector is robust. In spite of this,
however, management aims to diversify risks, for example by
establishing sales markets in overseas countries.
The company’s management believes that Laminated Veneer
Lumber will continue to enjoy ongoing growth. In this
regard, final acceptance (100% performance test) for the
second production line is of particular importance. This is
expected by the end of the third quarter.
As a result of the slightly slower pace of sales in the first
six months, the company’s management is now aiming for
revenue growth over the year as a whole in the upper single-
digit percentage range. In contrast, in terms of earnings,
above average growth is also forecast for the year as a
whole.
STEICO Semi-annual report 2018 13Consolidated Income Statement 1 January - 30 June 2018
6M 2018 6M 2017
€ €
1. Revenues 122,846,264.99 114,629,151.16
2. Increase in finished goods and work in progress -3,110,689.65 -1,478,185.43
3. Other own work capitalised 52,349.53 91,889.00
119,787,924.87 113,242,854.73
4. Other operating income 2,418,545.77 2,859,217.12
122,206,470.64 116,102,071.85
5. Cost of materials
a) Cost of raw materials, consumables and
supplies and for purchased goods -64,970,511.70 -66,026,603.90
b) Cost of purchased services -590,515.71 -685,817.74
6. Gross profits 56,645,443.23 49,389,650.21
7. Personnel expenses
a) Wages and salaries -17,774,032.90 -15,616,495.51
b) Social security and expenses for retirement benefits -4,033,326.13 -3,508,110.46
8. Amortisation of intangible fixed assets and depreciation of tangible fixed assets -9,022,761.91 -7,885,746.06
9. Other operating expenses -13,411,772.93 -11,816,238.28
10. EBIT 12,403,549.36 10,563,059.90
11. Other interest and similar income 279,729.35 273,682.21
12. Interest and similar expenses -824,613.21 -921,248.12
13. Financial result -544,883.86 -647,565.91
14. Earnings before taxes 11,858,665.50 9,915,493.99
15. Income taxes -2,237,399.69 -2,586,249.09
16. Earnings after taxes 9,621,265.81 7,329,244.90
17. Other taxes -1,097,733.73 -938,954.55
18. Consolidated net income for the period 8,523,532.08 6,390,290.35
19. Profit carried forward from previous year 35,519,612.38 23,210,009.32
20. Consolidated profits 44,043,144.46 29,600,299.67
As a result of the reclassifications there are differences compared to the previous year’s figures.
14 STEICO Semi-annual report 2018Half Year Report 2018
Semi-annual report 2018
This page does not have any content for technical reasons
STEICO Semi-annual report 2018 15STEICO Consolidated Balance Sheet as of 30 June 2018
| ASSETS
30 June 2018 31 Dec. 2017
€ €
A. NON-CURRENT ASSETS
I. Intangible assets
1. Acquired concessions, industrial property rights and similar rights and assets
as well as licenses for such rights and assets. 1,456,702.75 1,486,642.13
2. Advance payments made 160,439.81 112,811.98
1,617,142.56 1,599,454.11
II. Property, plant and equipment
1. Land, land rights and buildings including
buildings on third-party land 59,914,422.03 58,131,637.96
2. Technical plant and machinery 106,282,700.23 114,561,500.50
3. Other assets, operating and office equipment 2,376,562.22 2,238,882.29
4. Advances made and assets under construction 35,209,784.19 25,560,606.86
203,783,468.67 200,492,627.61
III. Financial assets
1. Interests in affiliated companies 0.00 2,137.90
2. Loans to affiliated companies 11,417.27 8,618.62
3. Other loans 211,700.00 211,700.00
223,117.27 222,456.52
205,623,728.50 202,314,538.24
B. CURRENT ASSETS
I. Inventories
1. Raw materials, consumables and supplies 22,641,533.96 19,701,537.91
2. Work in progress 1,732,937.71 1,551,738.21
3. Finished goods and merchandise 10,738,439.77 13,642,413.78
4. Advance payments made 26,943.25 117,593.61
35,139,854.69 35,013,283.51
II. Receivables and other assets
1. Trade receivables 27,813,781.17 20,878,931.17
2. Receivables from affiliated companies 9,511.07 8,119.62
3. Other assets 15,283,813.10 13,076,691.51
43,107,105.34 33,963,742.30
III. Securities
Other securities 55,362.65 43,247.15
IV. Cash in hand and bank balances 18,055,671.87 25,528,972.69
96,357,994.55 94,549,245.65
C. PREPAID EXPENSES 2,854,846.48 783,434.02
D. DEFERRED TAX ASSETS 821,641.67 1,057,860.97
305,658,211.20 298,705,078.88
16 STEICO Semi-annual report 2018Half Year Report 2018
STEICO Consolidated Balance Sheet as of 30 June 2018
| EQUITY AND LIABILITIES
30 June 2018 31 Dec. 2017
A. EQUITY
I. Subscribed capital 14,083,465.00 14,083,465.00
II. Additional paid-in capital 104,911,923.60 104,911,923.60
III. Retained earnings
Other retained earnings 7,050,000.00 7,050,000.00
IV. Difference in equity from currency translation -13,133,841.58 -3,510,567.38
V. Consolidated profits 44,043,144.46 38,477,140.03
156,954,691.48 161,011,961.25
B. PROVISIONS
1. Provisions for pensions and similar obligations 2,600,801.28 2,654,868.25
2. Provisions for taxes 2,041,524.07 2,495,304.17
3. Other provisions 11,765,481.11 8,794,599.06
16,407,806.46 13,944,771.48
C. LIABILITIES
1. Liabilities to banks 99,137,704.00 90,651,559.11
2. Advance payments received on account of orders 53,087.67 129,592.50
3. Trade payables 17,977,804.44 22,715,554.38
4. Other liabilities 13,711,938.56 8,807,131.88
130,880,534.67 122,303,837.87
D. DEFERRED INCOME 6,512.13 6,818.01
E. DEFERRED TAX LIABILITIES 1,408,666.46 1,437,690.27
305,658,211.20 298,705,078.88
STEICO Semi-annual report 2018 17STEICO Consolidated Cash Slow Statement for H1 2018
1 Jan - 30 June 2018 1 Jan - 31 Dec. 2017
€ €
I. CASH FLOW FROM OPERATING ACTIVITIES
1. Earnings for the period (consolidated net income/loss) 8,523,532.08 15,267,130.71
2. +/- Amortization/depreciation of non-current assets 9,022,761.91 15,886,934.71
3. +/- Increase/decrease in provisions 2,835,099.08 957,107.51
4. +/- Other non-cash expense/income -42,313.96 -629,355.29
5. -/+ Increase/decrease in inventories, trade receivables and other
assets that are not allocated to investing or financing activities -11,353,462.18 -11,856,304.77
6. +/- Increase/decrease in trade payables and other liabilities
that are not allocated to investing or financing activities 90,246.03 3,893,269.12
7. -/+ Gains/losses from the disposal of non-current assets 41,914.94 179,994.05
8. +/- Interest income/expense 544,883.86 1,026,857.94
9. +/- Income tax expense/income 2,237,399.69 3,693,907.90
10. -/+ Income tax payments -2,483,984.30 -2,925,601.98
11. = Cash flow from operating activities 9,416,077.15 25,493,939.90
II. CASH FLOW FROM INVESTING ACTIVITIES
1. - Payments made for investments in intangible non-current assets -323,227.66 -1,168,749.03
2. + Proceeds received from disposals of items of property, plant and equipment 1,134,532.90 243,289.63
3. - Payments made for investments in property, plant and equipment -21,535,855.22 -45,626,564.92
4. + Proceeds received from disposals of financial assets 0.01 0.01
5. - Payments made for investments in financial assets -1,179.04 0.00
6. + Interest received 279,729.35 566,905.16
7. = Cash flow from investing activities -20,445,999.66 -45,985,119.15
III. CASH FLOW FROM FINANCING ACTIVITIES
1. Proceeds received from additions to equity by shareholders of the parent company 0.00 24,966,142.45
2. + Proceeds received from taking out (financial) loans 15,047,270.89 16,500,044.11
3. - Payments made from redeeming bonds and (financial) loans -6,561,126.00 -9,997,246.00
4. - Interest paid -742,897.21 -1,601,883.10
5. - Dividends paid to shareholders of the parent company -2,957,527.65 -2,304,567.00
6. = Cash flow from financing activities 4,785,720.03 27,562,490.46
IV. CASH AND CASH EQUIVALENTS
1. Net change in cash and cash equivalents -6,244,202.48 7,071,311.21
2. +/- Exchange-rate related change in cash and cash equivalents -1,229,098.34 847,580.07
3. + Cash and cash equivalents - start of period 25,528,972.69 17,610,081.41
4. = Cash and cash equivalents - end of period 18,055,671.87 25,528,972.69
18 STEICO Semi-annual report 2018Half Year Report 2018
STEICO Notes to the consolidated financial statements
I. GENERAL INFORMATION ON THE longer apply, these are written up according to Section 253
CONSOLIDATED FINANCIAL STATEMENTS (5) sentence 1 of the HGB.
Inventories are measured at cost. Items with impaired
1. LEGAL FOUNDATIONS marketability are written down to their lower fair value.
The regulations set out in Sections 294 ff. of the As a rule, receivables and other assets are carried at face
Handelsgesetzbuch (HGB - German Commercial Code) value.
apply for the consolidated financial statements. The
In order to cover the risk of default, individual and lump-sum
consolidated financial statements are prepared based on legal
write-downs are formed for receivables to the extent
requirements.
required. When forming individual write-downs, the company
takes into account the fact that some receivables are covered
2. CONSOLIDATED ACCOUNTING AND VALUATION
by commercial credit insurance.
METHODS
Securities under current assets are carried at acquisition cost
The Group applies the principles of the German Commercial
or at their lower fair value.
Code for its accounting and valuation methods. According to
Section 308 (1) of the HGB, the assets and liabilities included Cash in hand and bank balances are carried at face value.
on the consolidated balance sheet are subject to a uniform
Expenses prior to the balance sheet date that relate to
valuation in line with the valuation methods which apply for
expenses for a limited period after the balance sheet date are
the parent company’s annual financial statements.
carried as prepaid expenses. The accounting option offered
The consolidated balance sheet and consolidated income in Section 250 (3) Sentence 1 of the HGB to form a discount
statement are classified according to Sections 266, 275 (2) of has been used. The item is reversed using the straight-line
the HGB in connection with Section 298 of the HGB. method in line with time.
The following individual accounting and valuation methods Deferred tax assets result from temporary differences
were applied: between tax losses carried forwards and consolidation. The
tax relief resulting at an individual company level has been
Internally generated intangible assets are capitalised at cost
capitalised according to the option offered in Section 274 in
and subject to scheduled amortisation over their expected
connection with Section 306 of the HGB.
useful lives. Patents, concessions, licenses and software are
written down over 2-5 years, rights of usufruct are written Provisions for pensions are calculated on the balance sheet
down over 20 years. date in line with Section 253 (2) of the HGB using the
projected unit credit method based on an average market
Property, plant and equipment is valued at cost according
interest rate and an assumed residual period of 15 years.
to Section 253 of the HGB in connection with Section 255
This is announced by Deutsche Bundesbank in line with the
of the HGB, less scheduled depreciation in line with the
corresponding legal provisions. On the balance sheet date
standard useful lives in the industry.
this liability was netted with the re-insurance in line with
Buildings are depreciated using the straight-line method, Section 246 (2) Sentence 2 of the HGB. The netted assets are
with both the straight-line and declining balance methods valued at fair value according to Section 253 (1) Sentence 4
being used for machines. Office equipment and IT hardware of the HGB.
is written down using both the straight-line and declining
Provisions for taxes and all other provisions are formed for
balance methods.
all recognizable risks and uncertain liabilities in the amount
Low-value items of property, plant and equipment have required for fulfillment according to prudent commercial
been written off immediately through profit and loss since judgement. The amount required for fulfillment is calculated
1 January 2011. taking future price and cost increases into account.
As a rule, financial assets are carried at cost or, in the event Provisions with a remaining term of more than one year are
of permanent impairment, at their lower fair value on the discounted over their remaining term in line with the average
balance sheet date. market interest rate for the past seven fiscal years (Section
253 (2) Sentence 1 of the HGB).
If the reasons for maintaining a lower carrying amount no
Liabilities are included at their repayment amounts.
STEICO Semi-annual report 2018 19STEICO Notes to the consolidated financial statements
Deferred tax liabilities result from temporary differences 5. DIRECTORS
to the carrying amounts in the tax base for the companies
STEICO SE’s Board of Directors comprises 6 members.
included.
Mr. Udo Schramek, Munich, Chairman and Managing
3. CURRENCY TRANSLATION Director of STEICO SE - responsible for R&D, quality
assurance, marketing, purchasing, business sector
Receivables and liabilities denominated in foreign currencies
development, application technology, IT, legal and HR.
are translated using the exchange rate on the date of the
transaction. Assets and liabilities denominated in foreign Mr. Holger Jödecke, Munich, Managing Director for
currencies with a residual period of less than one year are production, quality management, sustainability management.
subsequently valued on the balance sheet date using the
Mr. Uwe Lange, Berga, Managing Director for line
average spot exchange rate on the balance sheet date.
construction and investment project maagement.
Foreign statements prepared in foreign currencies for the
Dr. David Meyer, Munich, Managing Director for finance,
Group’s subsidiaries in Poland and England are translated
accounting & controlling and investor relations.
using the “modified balance sheet date method” set out in
Section 308a of the HGB. Mr. Milorad Rusmir, Kirchheim, Managing Director for wood
wholesale
With the exception of equity, items on the balance sheet are
translated using the rate on the balance sheet date; items Mr. Heiko Seibert, Koblenz, Managing Director for sales.
in the income statement are translated using the average
exchange rate for the fiscal year; equity is translated using
the historical rate.
The parent company’s functional currency is the group’s
currency (euros).
Differences in the consolidation of liabilities resulting from
exchange rates are taken directly to equity under Currency
translation differences.
The exchange rates for PLN/€ are:
Closing rate on 30 June 2018: 4.37320
Average rate in H1 2018: 4.24073
The exchange rates for GBP/€ are:
Closing rate on 30 June 2018: 0.88605
Average rate in H1 2018: 0.88010
4. SUPERVISORY BOARD
STEICO’s Supervisory Board comprises 4 members.
Mr. Udo Schramek, Munich, Chairman, Managing Director
and Chairman of the Supervisory Board
Mr. Uto Baader, Munich, banker, Deputy Chairman of the
Supervisory Board
Ms Katarzyna Schramek, Munich, attorney
Dr. Jürgen Klass, Munich, attorney
20 STEICO Semi-annual report 2018Semi-annual report 2018
Semi-annual report 2018
This page does not have any content for technical reasons
STEICO Semi-annual report 2018 21We spend approx. 80 % of our lives Steico insulation and construction ma-
in enclosed rooms. But are we terials, carry a number of distinguis-
always aware what we are hed ‘seals of approval’ which is
surrounding ourselves with? a sign of high quality, healthy
STEICO has set itself the and functional building pro-
target of developing ducts. The raw materials used
building products in Steico products are certified
which consider the by FSC® (Forest Stewardship
needs of both man and Council®) and PEFC® (Programme
nature. Our products for the Endorsement of Forest
are therefore produced Certification®), ensuring a
using sustainable natural traceable and fully sustainable
materials. They help reduce usage of the raw materials. STEICO,
energy use and add considerably the number 1 choice for your sustainable
to a natural healthy internal climate. building solutions.
Natural Insulation and Construction Systems for
New Builds and Renovations – Roof, Ceiling, Wall and Floor
Renewable Excellent cold Excellent Energy Saving
$
raw materials protection summer and increased
without in winter heat property
harmful protection worth
additives
Weather tight Excellent Excellent Environmentally
and Fire sound friendly and
breathable Protection protection recyclable
Light and Insulation Strong Compatible
easy to for healthy quality insulation
handle living control and structural
1-2-3... building
systems Printed 07/2018
STEICO zell
Quality
Forum
Holzfaser-Einblasdämmung
® sehr gut Management
PEFC/04-31-2550
Ausgabe 08/2017
| Bau ISO 9001:2015
Your STEICO Dealer
www.steico.com
STEICO SE • Otto-Lilienthal-Ring 30 • 85622 Feldkirchen (GER)
Tel.: + 49 - 89 - 99 15 51- 0 • Fax: + 49 - 89 - 99 15 51- 700
Internet: www.steico.com • E-mail: info@steico.com
engineered by natureYou can also read