Stock Market Behavior Predicted by Rat Neurons
←
→
Page content transcription
If your browser does not render page correctly, please read the page content below
Stock Market Behavior Predicted by Rat
Neurons
by Timothy C. Marzullo, Neuroscience Program, University of Michigan, Ann Arbor
Edward G. Rantze, Red Antze, Inc., Cumming, Georgia
Gregory J. Gage, Biomedical Engineering, University of Michigan, Ann Arbor
We here report for the first time, to the best of our knowledge, rat motor cortex neurons predicting the behavior of the
American stock market. We implanted the motor cortex of the brains of rats with silicon electrodes. Using the correlation
technique, we monitored the activity of neurons in our rats while simultaneously tracking the activity of stocks in the U.S.
stock market.
Background: Hedge Funds
Hedge funds burgeoned in the early 1990's as a popular alternative to the conventional, and
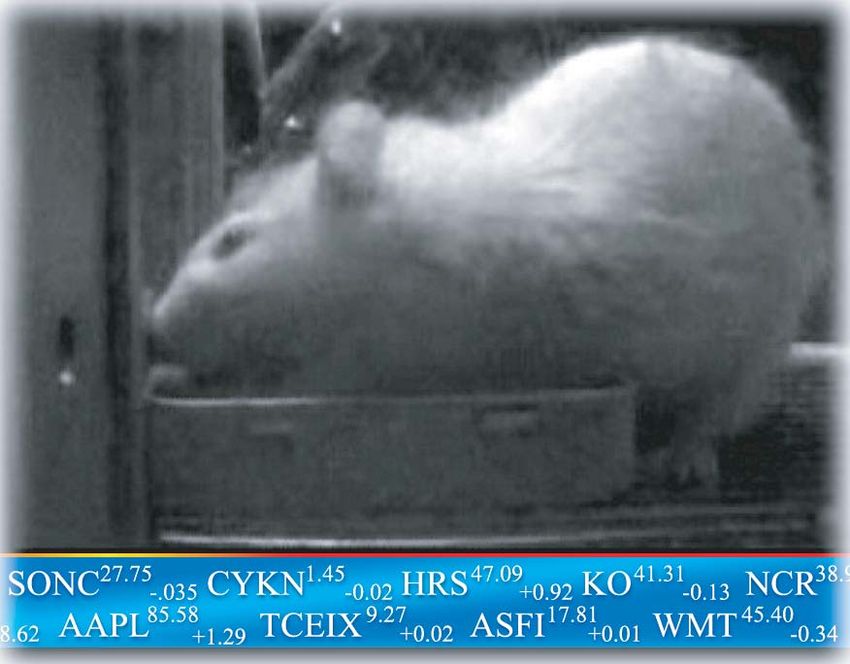
more regulated, mutual funds. Hedge funds have often used alternative methods, such as Figure 1 (top): Behavioral
various human social factors, to predict future performance of the stock market. However, we apparatus: rat trained
here propose an alternative alternative method. on a brain-machine
interface task while stocks
Methods: Correlation Analysis simultaneously tracked.
For nine days, neural activity in the form of firing rates (which are the number of electrical
discharges per second) from recorded neurons (n=94) of three rats were averaged each day as
22 | Annals of Improbable Research | July-August 2006 www.improbable.comthe rats learned to use a brain-machine interface1 to obtain food pellets.
Mean firing rate data per day were stored using custom software (MATLAB, Mathworks Inc., Natick, MA), along with
the closing stock prices for the same day for all corporations listed on NASDAQ, the New York Stock Exchange, and the
American Stock Exchange (n=4195). Correlation coefficients were obtained using the corrcoef function of MATLAB, and
only stocks that had significant coefficients (p f d-1 a short (1)
fd < f d-1 abuy (2)
fd ≈ f d-1 ahold (3)
where fd-1 is the firing rate from day d - 1 and a is the action taken, a = {buy; short; hold}. Stated simply, if the rats’
neurons increased firing rates, we would simulate a “short” of the stock; if the firing rates decreased, we would “buy” the
stock. If no change occurred (± 1 impulse/s), we did not trade that day (hold). To determine the success of our predictions,
the actual value of the stock was observed on day d+1, and we calculated our profits and losses. Brokerage fees were not
included in this analysis.
Coca-Cola Bottling Co. (COKE) Stock (US$)
58.5 6
Results
We found that 74 stocks were responsive
to the firing rates of our rats. Figure 58 5.5
2 shows an example of one stock
Firing Rate (Imp/s)
(COKE, Coca-Cola Bottling Company 57.5 5
Consolidated) that was positively
correlated with the rat neurons. Table 1
57 4.5
groups the responsive stocks by sector.
Though interesting clusters emerge in
the financial and technology industries, 56.5 4
the theoretical implications are beyond
the scope of this paper.
56 3.5
In our prediction experiments, we found
a similar number of stocks that responded
55.5 3
to a lag of one day (n=68). Figure 3 June-10 June-14 June-15 June-16 June-17 June-18 June-21 June-23 June-24
shows the output of the stock trading
simulation for one exemplar example Figure 2: Coca-Cola Stock Price (red) and average firing rates of
stock (ASFI, Asta Funding, Inc.). Figure 3A indicates neurons (blue) from rat motor cortex over 9 days in 2004. Correlation
the results of the predictions, while Figure 3B shows coefficient = 0.704.
our return on investment using the directives provided
by the contrarian predictive model.
Discussion
For our analysis, we adopted the standard practice in neurophysiology where researchers will record a population of
neurons, say 500, and find 50 that respond to a certain stimulus. The researchers will then decide to focus on the cells that
showed responses and subject these to further statistical analysis. Thus, based on the work of our colleagues, we believe
our methods are sound.
We found that stocks correlate with the firing rates of motor cortex neurons in rats. We also generalized our model to
predict future stock price, and we made $435 from an initial $1000 investment in 20 days by using neuronal firing rates to
predict whether to buy, short, or hold shares in Asta Funding, Inc.
www.improbable.com July-August 2006 | Annals of Improbable Research | 23Conclusion
Nobel Prize-winning economist Paul Samuelson said in a 1967 declaration to the U.S. Senate that buying a mutual fund is
worse than throwing darts at a dartboard. As a consequence, index and hedge funds are now popular. We say that if you are
not using a rat motor cortex model of stock price, you might as well be using a mutual fund.
A Buy
Appendectal Discussion
Model Prediction
Hold
We are on the verge of a paradigm shift we call the Gage / Rantze /
Marzullo (GRM, or the Generalized Revenue Model) Motor Cortex
Short
Rattus norvegicus Theory of Societal Urges. The neurons of our rats
1 2 3 4 5 6 7 8 9 10 11 12 13 14 15 16 17 18 19 20
B 1450
are in some mysterious way tied to humans’ purchase patterns which
1400 ultimately manifest as fluctuations in the American Stock Market.
1350
1300
The Gaia hypothesis, proposed by James Lovelock in the 1960’s, states
Portfolio Value (US $)
1250 the Earth entire is a living organism.3 The data presented here are
Final Value
Initial Investment
1200
($1000)
($1,435) consistent with this theory. We are all tied in a great circle of life,4
1150 +43% Increase
1100
where our hopes, dreams, aspirations, triumphs, despairs, boredoms, and
1050
loves are inextricably linked to the creatures of the Earth. Research in
1000 1934 proved that the solar cycles of 1929 were correlated to the closing
950
1 2 3 4 5 6 7 8 9 10 11 12 13 14 15 16 17 18 19 20 stock prices of the London and New York stock exchanges of the same
Trading Day
year.5 Though we do not have access to rat motor cortex firing rates from
19296, our future experiments will do a triple correlation between rat
Figure 3: Results of predicting closing stock price
motor cortex firing rates, the American and London Stock Markets, and the
of ASFI on day d + 1 from average firing rates on
2006 solar radiation flux.
day d. A. Output of contrarian prediction model.
B. Simulation of US $1000 investment using trade We focused on rats in this study, but we would not be surprised if the stock
information obtained from predictions. market was correlated to the behavior of American White House squirrels,
Jamaican fruit bats, Tasmanian devils, and New England codfish. As a final
note, we wonder what would happen to the stock market should species become extinct. Given Earth’s current global
biodiversity crash and mass extinction crisis,7 future human economic success may be neither assumed nor assured.
Notes
Results from the study were previously presented at the 2005 annual Society for Neuroscience meeting in Washington,
D.C.
Conflict of Interest Statement: The authors of this study do not personally own any stocks in Asta Funding or Coca-Cola,
unless one includes index funds that represent the whole stock market.
References
1. Brain-machine interfaces are devices that are controlled by the self-modulation of brain activity. The rat data presented
here were acquired as part of a broad experiment examining brain-machine interface algorithm designs.
“Naive Coadaptive Cortical Control,” Gregory J. Gage, Kip A. Ludwig, Kevin J. Otto, Edward I. Ionides, and Daryl R.
Kipke, Journal of Neural Engineering, vol. 2, no. 2, 2005, pp. 52-63.
2. “Profitability of Short-term Contrarian Strategies: Implications for Market Efficiency,” Jennifer Conrad, Mustafa N.
Gultekin, and Gautam Kaul, Journal of Business Economic Statistics, vol. 15, no. 3, 1997, pp. 379-86.
3. Gaia: A New Look at Life on Earth, James Lovelock, Oxford University Press, Oxford, United Kingdom, 1979.
4. The Lion King, Walt Disney Pictures, Buena Vista Home Entertainment, 1994.
5. “Solar and Economic Relationships,” Carlos Garcia-Mata and Felix Schaffner, Quarterly Journal of Economics, vol.
49, no. 1, 1934, pp. 1-51.
6. Curiously, 1929 was also the year that Hans Berger published the first recordings of human brain activity in his research
attempting to understand the physiology of a youthful telepathic experience with his sister.
7. “Declines of Biomes and Biotas and the Future of Evolution,” David S. Woodruff, Proceedings of the National Academy
of Sciences of the United States of America, vol. 98, no. 10, 2001, pp. 5471-6.
24 | Annals of Improbable Research | July-August 2006 www.improbable.comMarket Sector mean Corr. Coeff. n % of total n
Basic Materials 0.03 2 3%
Consumer Goods 0.23 3 4%
Financial 0.31 24 32%
Healthcare -0.59 10 14%
Industrial Goods -0.19 3 4%
International 0.83 2 3%
Services -0.41 9 12%
Technology -0.18 16 22%
Utilities 0.72 1 1%
Not Specified 0.37 4 5%
Table 1: Market Sectors and the mean Pearson’s correlation coefficients of responding stocks.
HMO-NO News
Health care advice to pass on to your patients
Cure b
y Comm
We at H
second
MO-NO itment
to none are committed
health c .I to cure.
are orga t’s so strong th Our com
program nization at we d mitmen
. Sign u offers: t a re to of t
you wit p fo r C h e new H f er some is
h1 om MO thin
least tw 00% commitm mitment Care -NO Commit g no other
o weeks e ™, and ment C
.* In the nt -- 24 hours a
further
services unlikely a day, s w e g u arantee re™
even da t
, traditi
onal no event that you ys a we o treat
n-comm re e k
itment p quire addition , for at
rogram a
s are av l and/or
ailable.
**
* Note: Mayincur stochastic surcharge.
** Note: On an as-available basis. Additional fees apply. May require a three-month prior notification and/or a six-
month membership re-consideration period.
HMO-NO The very final word in health care
www.improbable.com July-August 2006 | Annals of Improbable Research | 25What is this picture? (see page 1) PERIODICALS
ISSN 1079-5146 Annals of Improbable Research
Volume 12, Number 4 P.O. Box 380853
www.improbable.com
July/August 2006 Cambridge, MA 02238, USA
34 | Annals of Improbable Research | July-August 2006 (+1) 617.491.4437
www.improbable.comYou can also read