Storm Tide - Issues for Design of Road Infrastructure in Coastal Areas - Guideline
←
→
Page content transcription
If your browser does not render page correctly, please read the page content below
Guideline

Storm Tide – Issues for Design of Road Infrastructure in
Coastal Areas
January 2014
Copyright

http://creativecommons.org/licenses/by/3.0/au/

© State of Queensland (Department of Transport and Main Roads) 2014

Feedback: Please send your feedback regarding this document to: mr.techdocs@tmr.qld.gov.au

Transport and Main Roads, January 2014
Amendment Register

 Issue /      Reference
                                 Description of revision       Authorised by         Date
 Rev no.       section
                                                           Bill Weeks, Director   January
             Whole           Initial release
                                                           (Hydraulics)           2014

Transport and Main Roads, January 2014                                                      i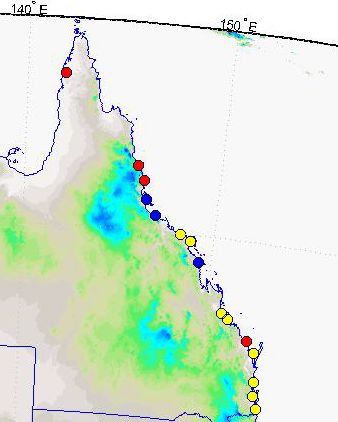
Contents

1       Background to storm tides ...........................................................................................................3
1.1     Introduction ..................................................................................................................................... 3
1.2     Storm surges and storm tides......................................................................................................... 3
1.3     Historical events.............................................................................................................................. 4
1.4     Processes of tides, storm tides and storm surge............................................................................ 5
1.5     Cyclone Yasi storm tide .................................................................................................................. 7
2       Designing for storm surges and storm tides..............................................................................7
2.1     Introduction ..................................................................................................................................... 7
2.2     Determining storm tides.................................................................................................................. 8
2.3     Coincident probability assessments ............................................................................................... 9
3       Issues for road infrastructure design ........................................................................................11
4       Design guidance ..........................................................................................................................12
5       Conclusion ...................................................................................................................................14
6       References....................................................................................................................................14
Appendix 1 - Detailed tropical cyclone storm tide risk along the Queensland coast (Harper,
1998).......................................................................................................................................................16
Appendix 2 - Storm surge plus tide at given ARIs for 2003 conditions and with future climate
change conditions................................................................................................................................18
Appendix 3 - Summary of proposed method to account for combination of storm tide and
floods .....................................................................................................................................................19

Figures

Figure 1 - Components of storm tide (Harper / Geoscience Australia) ................................................... 4

Figure 2 - Damage to Bruce Highway in Cardwell – Cyclone Yasi - 2011.............................................. 4

Figure 3 – Semidiurnal tidal planes (Maritime Safety Queensland, 2013).............................................. 6

Figure 4 – Diurnal tidal planes (Maritime Safety Queensland, 2013) ..................................................... 6

Figure 5 – Plot of storm surge, Cyclone Yasi at Cardwell (DSITIA, 2012).............................................. 7

Figure 6 - Dependence between extreme rainfall and storm surge (ARR, 2012) ................................. 10

Figure 7 - Interaction of catchment and coastal flooding (Collins et al, 2012) ...................................... 11

Transport and Main Roads, January 2014                                                                                                                      ii

Storm Tide – Issues for Design of Road Infrastructure in Coastal Areas,
1 Background to storm tides
1.1 Introduction
This guide provides relevant information on the incorporation of storm surge and storm tide into the
planning and design of road infrastructure in coastal regions. A statistically correct approach to the
inclusion of storm tide inputs to hydraulic design is not yet available, though research is currently
underway. Once this work is completed and adopted into engineering practice, the process will be
improved significantly. This guide however provides interim assistance while development of the more
complete approach continues.
Storm surge is a feature of the coastal environment that can influence the design of infrastructure and
can be a cause of damage. It is a difficult design input to consider and many designs adopt an overly
conservative allowance for this input by making cumulatively conservative assumptions about the
extent of storm surge and the timing of surge, astronomical tides and flooding.
There are two main concerns for TMR. Firstly TMR infrastructure located close to the coast or over the
ocean may be damaged directly by storm surge, by the ocean actually inundating the infrastructure
directly. The second aspect, which is a more common concern for TMR, is where storm surge
provides a higher than normal tailwater level for design of drainage structures. The higher tailwater
level means that culverts, bridges or floodways may not operate as efficiently as they would if the
tailwater level was lower or the infrastructure, while not directly located on the coast, may even be
inundated by the tailwater, which will lower the flood immunity.
The material presented in this guide can assist in design for both of these aspects. Because of
continuing uncertainties, this guide gives some “practical” advice that will allow a reasonable and
consistent assessment approach, though still with some uncertainty.
1.2 Storm surges and storm tides
There are two terms that need to be understood clearly when discussing storm surge. These are:
Storm surge. This is the abnormal rise in level above normal water surface level generated by
a “storm”, that is the difference between astronomical tidal level and the level recorded. It is
therefore not an absolute water level, but a difference between expected water level and the
level that actually occurs.
Storm tide. This is the water level produced by the combined action of storm surge and
astronomical tides. It is therefore an absolute water level as recorded.
In other words, storm surge is a change in water level, while storm tide is the resulting level. Causes of
storm surge are low atmospheric pressure and on-shore winds, influenced by shoreline and sea bed
bathymetry. These and other components that occur during a storm tide are illustrated in Figure 1.
An important point involved with these definitions is that the storm tide level may be lower than a high
astronomical tidal level if there is a storm surge that occurs at low tide. The storm tide therefore
depends on the storm surge level, the astronomical tide level and the timing of the storm surge relative
to the timing of the astronomical tides.
Transport and Main Roads, January 2014 3
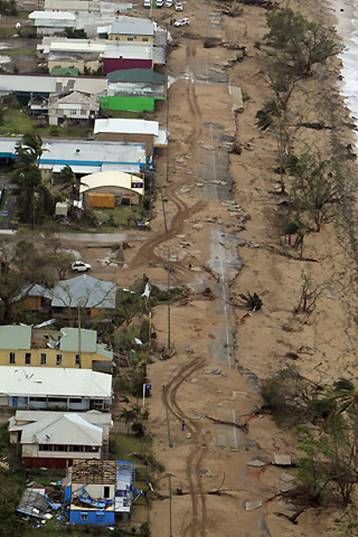
Storm Tide – Issues for Design of Road Infrastructure in Coastal Areas,

Figure 1 - Components of storm tide (Harper / Geoscience Australia)

In northern Queensland, large storm tides are generally associated with tropical cyclones, while in
southern Queensland; they may also be caused by severe storms or east coast lows as well as
cyclones.

1.3    Historical events

A listing of significant storm surges that have occurred in Queensland is provided in Harper (1998).
The largest recorded storm surge was at Bathurst Bay in 1899, but other major storm surges have
occurred in Burketown, Mackay, Bentinck Island, Edward River and the Gilbert River as well the storm
surge from Cyclone Yasi in 2011. The cyclone in Mackay in 1918 had a storm surge height of 3.7 m
and was combined with a high tide, resulting in a flood height of 5.4 mAHD, about 2 m above the
Highest Astronomical Tide (HAT) and contributed significantly to the cyclone and flood damage. This
history shows that the Gulf of Carpentaria is especially prone to storm surge, though it is a concern in
all coastal regions.

TMR infrastructure was severely damaged by the storm tide generated by Cyclone Yasi in 2011. This
storm surge severely damaged the Bruce Highway, which is between the coast and the town of
Cardwell as shown in Figure 2.

Figure 2 - Damage to Bruce Highway in Cardwell – Cyclone Yasi - 2011

Transport and Main Roads, January 2014                                                                 4
Storm Tide – Issues for Design of Road Infrastructure in Coastal Areas,
While there are direct impacts of storm surge, the most important issue for TMR is the increase in sea
level that acts a control on tailwater level. This impacts drainage design for coastal infrastructure.
1.4 Processes of tides, storm tides and storm surge
Storm surge is an abnormal increase of water level above that expected from astronomical tides.
Tides are caused by the gravitational effects of the sun and the moon and can be predicted accurately
for any location on the coast. In Queensland, tidal predictions are published annually by the
Queensland Government (Maritime Safety Queensland, 2013).
In some situations, such as when winds blow offshore, the actual tide level may be lower than that
predicted. Therefore since storm surge is a departure from the well understood and predicted
astronomical tides, the fundamental requirement for assessment of storm surge is an understanding of
astronomical tides.
Astronomical tides follow a complex pattern depending on the relative positions of the sun and the
moon and local coastal conditions for each location. Tides are therefore highly variable for different
locations. Tides can follow either a diurnal pattern, where there is approximately one high and one low
tide a day, such as in the Gulf of Carpentaria. More commonly for the east coast of Queensland, tidal
cycles follow a semidiurnal pattern, where two high and two low tides occur in a 24 hour cycle. The
tidal range (the difference between low and high tides) is also highly variable depending on the
particular location.
There are many terms used to define different tidal levels (as defined in the Queensland Tide Tables)
and appropriate levels are used in design of road infrastructure. Tide definitions for semidiurnal
patterns are defined as follows:
Lowest Astronomical Tide (LAT). This is the lowest water level that can be predicted to occur
under average meteorological conditions and any combination of astronomical conditions.
Highest Astronomical Tide (HAT). This is the highest water level that can be predicted to occur
under average meteorological conditions and any combination of astronomical conditions.
Mean High Water Springs (MHWS. This is the long term mean of the heights of two
successive high waters during those periods of 24 hours (approximately once a fortnight)
when the range of tide is greatest during the full and new moon.
Mean Low Water Springs (MLWS). This is the long term mean of the heights of two
successive low waters over the same periods as defined for MHWS.
There are similar definitions for diurnal tidal planes.
Sketches showing semidiurnal and diurnal tidal planes are shown in Figures 3 and 4.
Transport and Main Roads, January 2014 5Storm Tide – Issues for Design of Road Infrastructure in Coastal Areas, Figure 3 – Semidiurnal tidal planes (Maritime Safety Queensland, 2013) Figure 4 – Diurnal tidal planes (Maritime Safety Queensland, 2013) Transport and Main Roads, January 2014 6
Storm Tide – Issues for Design of Road Infrastructure in Coastal Areas,

1.5    Cyclone Yasi storm tide

An example of the influence of timing of storm surge is illustrated in Figure 5, which plots the storm
surge, astronomical tide and storm tide at Cardwell during Cyclone Yasi. This shows a storm surge of
5.33 m, that is the maximum tide level measured was 5.33 m above the expected astronomical tide.
The storm tide is the combination of the astronomical tide and storm surge and this resulted in a storm
tide of 6.36 m above Lowest Astronomical Tide (LAT). This is higher than the Highest Astronomical
Tide (HAT), which is 4.13 m above LAT. However the peak of the storm surge occurred near low tide,
so the storm tide could have been significantly higher with different timing.

Figure 5 – Plot of storm surge, Cyclone Yasi at Cardwell (DSITIA, 2012)

2     Designing for storm surges and storm tides
2.1    Introduction

The objective of hydraulic design is to ensure that the calculated flood level at the location of the
required drainage infrastructure represents the correct probability. This means that the adopted ocean
level (tailwater) is based on an appropriate risk level to represent the combined flood event and storm
tide. There is often a tendency to combine the different components in a way that results in a lower
probability than actually required for design purposes and infrastructure investment (by assumptions
that storm surge and floods coincide). While this is a conservative assumption with a lower risk of
failure, it does result in a more expensive infrastructure than is appropriate for TMR design standards
and does not meet the expected probability level.

Coastal infrastructure design requires that the hydraulic assessment of tailwater levels consider the
water levels for defined risks. An appropriate level for the design storm tide needs to be estimated
from storm surge, astronomical tides and the probability of coincidence and this needs to be combined
with the probability of coincidence with a flood event.

Transport and Main Roads, January 2014                                                                7
Storm Tide – Issues for Design of Road Infrastructure in Coastal Areas,

This means that the combined probability of tailwater level and flood inflow should result in the
appropriate total probability for flood levels at the site of the project. Assuming a coincident occurrence
of a high tailwater level and a flood event may result in an overall conservative flood level for the
design.

2.2     Determining storm tides

The most straightforward approach to calculating storm tide levels for input to TMR hydraulic analysis
is by a simple statistical analysis of recorded tide levels. This involves analysis of historical tidal levels,
by extracting an annual or partial series of maximum recorded tide levels. A comparison between the
recoded levels and the predicted levels will allow assessment of storm surge as well. This series is
then analysed and appropriate storm tide level statistics extracted. The limitation on this is the very
small number of tide gauges and the short records available. The tide gauge at Fort Denison in
Sydney Harbour has the longest records in Australia with data back to 1914, but this is unusual and
only applicable locally. The length of record and distribution of tide gauges in Queensland is more
limited.

Since this approach is not practicable for analysis of storm tide statistics, an alternative theoretical
approach must be applied.

Hydraulic analysis can be carried out to calculate storm tide levels by using input parameters such as
sea bed bathymetry, wind speeds, atmospheric pressure and cyclone tracks. This can be used to
derive the statistics of storm surge and calculate design storm surge levels. Many local authorities in
Queensland have prepared reports and maps showing storm tide risk in coastal areas. These reports
can be found on relevant council websites, with a typical example prepared for Moreton Bay Regional
Council (Cardno Lawson Treloar, 2009). The Structures Interactive Map has a mapping layer available
that shows storm tide risk.

In the absence of specific analysis of storm tides, the following steps are required:

      1. Check with the local authority for storm tide reports or maps. These reports generally give a
         map showing the storm tide levels for a range of probabilities for different locations around the
         council area. If there are no suitable design levels available, alternative approaches by
         experienced coastal modellers is required.

      2. Consult published reports on storm tide risk. State wide statistics are given by Harper (1998)
         and Hardy, Mason and Astorquia (2004).

          a. Harper has provided storm tide risk for selected locations on the Queensland coast, with
             results from previous publications in Appendix 2 of Harper’s report, provided as
             Appendix 1 of this report.

          b. Hardy et al (2004) has tables and graphs showing both storm surge and storm tide levels
             for a number of probability levels for existing and future climatic conditions for locations
             along the Queensland coast. Storm surge levels can be found in this publication for
             suitable locations, where there are no detailed storm surge studies available. A copy of
             this table is given in Appendix 2 of this report.

      3. Where there is no storm surge report available, or where the appropriate value cannot be
         extracted from the above two reports, the Department of Environment and Heritage Protection
         (2013) has recommended a default level. This level is 1.5 m above HAT in south-east
         Queensland and 2 m above Highest Astronomical Tide (HAT) in the rest of Queensland.

Transport and Main Roads, January 2014                                                                        8
Storm Tide – Issues for Design of Road Infrastructure in Coastal Areas,
There is no probability associated with this recommendation, so it is assumed that this applies
to 1% AEP + climate change events out to the 2100 planning horizon. These values are a
conservative estimate, so adoption of this level will usually result in a higher flood level than
would be found from a more specific analysis. In some cases the HAT may represent the
combination of storm surge and astronomical tide, less conservatively than the result provided
by DEHP.
4. If a storm tide is indicated as being an insignificant or independent, then a revised tail water
level is required for analysis of infrastructure near the coast. For example, it may not be
reasonable to use the HAT with the flood event, as the HAT does not occur every year and is
unlikely that it will coincide with the peak of a flood event. It is still reasonable though to test
for a moderately high tide. In this case, a reasonable assumption could be to apply the Mean
High Water Spring (MHWS) tide, a monthly occurrence, as a moderately conservative tidal
tailwater level.
2.3 Coincident probability assessments
As outlined, the greatest consideration in relating storm tides to drainage design is the risk of
coincident occurrence of floods as well as astronomical and storm tides
In Queensland, storm surge is associated with cyclones or east coast lows, both of which may also be
associated with heavy rainfall sometimes resulting in flood events. Although they are associated, the
timing may not coincide and so the analysis cannot assume that they can be combined or the peak
levels of the two events totally coincide. A review of these probability issues is provided by the
Queensland Government Science Delivery Division (DSITIA, 2012). This report discussed the
theoretical issues and approaches to the statistical analysis, but did not provide any clear
recommendations for practical application.
A recent report was prepared as part of Stage 2 for ARR Project 18 during the update of Australian
Rainfall and Runoff. This report outlines the interaction of coastal processes and severe weather
events (Australian Rainfall and Runoff, 2012). Subsequent to publication, a note was prepared
(unpublished as yet) with guidance on how to apply the assessment of the dependence. This
approach relies on a map of dependence for the whole of the Australian coast, and consideration of
the dependence between floods and storm surge.
This report suggests that where there is little difference between the complete dependence and
independence, the analysis should assume complete dependence, which will result in a small degree
of conservatism.
The major consideration in the report was the analysis of the probability of coincident storm tide and
rainfall events. This showed a weak dependence between the two factors. Figure 6 shows the
dependence between extreme rainfall and storm surge for the entire Queensland coast.
Red dots represent the statistically significant dependence with αStorm Tide – Issues for Design of Road Infrastructure in Coastal Areas,
The proposed application of this methodology has been produced by Dr Michael Leonard from
Adelaide University, who is the researcher who is completing this work. The proposed approach is
provided in Appendix 3.
Figure 6 - Dependence between extreme rainfall and storm surge (ARR, 2012)
There is also New South Wales research that is relevant to Queensland. A paper by Collins et al
(2012) has shown that there is a weak relationship between storm surge and flooding in New South
Wales. This paper provided guidance for assessing the combined risk for flooding in coastal regions of
New South Wales.
For the calculation of 1% AEP flood events in coastal areas, it recommended that analysis of four
different combinations of coastal flooding (storm tide) and river flooding, as follows.
1% AEP catchment flooding with 5% AEP coastal flooding
1% AEP catchment flooding with neap tide conditions in the coastal waterway to provide an
understanding of potential flow velocities
5% AEP catchment flooding with 1% AEP coastal flooding, and
no catchment flooding with 1% AEP coastal flooding.
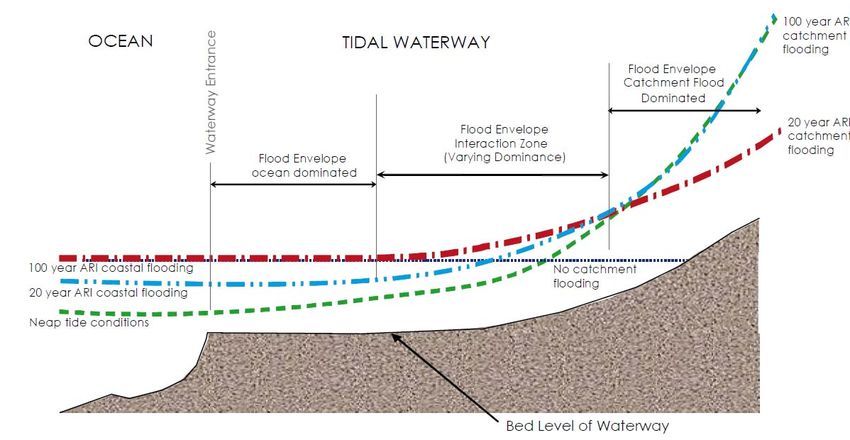
These four conditions are illustrated in Figure 7.
Transport and Main Roads, January 2014 10Storm Tide – Issues for Design of Road Infrastructure in Coastal Areas, Figure 7 - Interaction of catchment and coastal flooding (Collins et al, 2012) Once these four scenarios have been examined, a judgement needs to be made on the appropriate flood level to adopt. This needs to consider the distance from the coast, the differences between results with the alternative assumptions, the significance of the infrastructure involved and the risk profile. This approach is a pragmatic method that gives an indication of the potential range of possible answers, as also suggested by ARR (2012). To determine the ocean level for design flood estimates, it is important to evaluate the appropriate values for astronomical tides and storm surge that are associated with the appropriate flood event. It is important to maintain AEP neutrality, which means that the combination of the range of conditions should all combine to provide an appropriate flood level risk for design. Where the occurrence of flooding and storm surge is relatively independent, the assumption of dependence will lead to higher flood levels than would otherwise be the case. Therefore for the moment, the research needed to obtain a clear and statistically correct result for the assessment of the combined risk of flooding and storm tide has not been finalised. The following sections have an outline of a recommended approach that can be applied for the interim period until the ARR project has been finalised and a specific approach has been recommended for standard design consideration. 3 Issues for road infrastructure design Because of this uncertainty for the interim period before the Australian Rainfall and Runoff procedure has been finalised, a judgement needs to be made on an appropriate tailwater level for design. This needs to specifically determine the extent of dependence between storm tide levels and flood occurrence. There are a number of relevant considerations. High storm tide levels will generally be of a short duration with ocean levels rising and falling rapidly, with high sea levels generally of the order of a few hours rather than days. Therefore when the catchment is small and flood response is rapid, the floods are likely to be short duration with the water level rising and falling quickly. In this case, it is less likely that the peak of the flood in the catchment will coincide with the peak of the storm surge. It is therefore more likely that the two events will be independent in this situation. Transport and Main Roads, January 2014 11
Storm Tide – Issues for Design of Road Infrastructure in Coastal Areas,
Conversely, floods in larger catchments will have a longer duration and therefore it is more likely that
the storm surge will coincide with a higher flood level that is closer to the peak of the flood.
In both cases, it is worth collecting any anecdotal information on historical floods to determine the
possibility of storm surge and floods coinciding. Historical records may indicate this possibility and
therefore a better informed judgement can be made of the probability of coincidence of floods and
storm surge.
Wave set up may be an issue for TMR is coastal locations where the infrastructure is located directly
on the coast and damage from waves may be a concern. Occasionally also wave set up may be
sufficient to increase sea level during the storm event and thereby increase the tailwater level for the
infrastructure being designed. If this type of condition is deemed possible, an allowance should be
made for this factor.
While coastal areas of Queensland do show some dependence between heavy rainfall and storm
surge, this relationship is not strong.
There are three issues related to tailwater level for road design.
Direct impact from storm tides, where the road is close to the coast or there is a bridge across
the ocean, such as the Bruce Highway at Cardwell or the Ted Smout Bridge at Redcliffe. In
this case the ocean itself has a direct impact on the infrastructure, and there may be effects
from waves as well as the increase in water surface level.
No direct impact from the ocean, but the tidal water levels affects the tailwater levels for
design of bridges or culverts in road infrastructure. While this impact is generally apparent
close to the coast, in flat topography, the effects of ocean level may be apparent some
distance inland. This effect needs to be considered in projects such as the Gateway Upgrade
Project in Brisbane, where design for the bridges on Schultz Canal and Bulimba Creek
needed to consider tailwater levels affected by the ocean. With incorrect assumptions about
tailwater level, the flood immunity of the crossing may be designed incorrectly.
Impact of low tides on the hydraulic performance of the infrastructure. This will be the
condition where the flow velocity through the structure will be at a maximum. While a major
concern in estimation of the maximum flood level is to find flood immunity, it is also possible
that a flood may occur when the tide level is unusually low. In this case, the flood level through
the structure will be low, but the velocity will be higher than typical. This condition is needed to
test for the risk of scour, and does not assess the flood immunity, but is an important design
check.
4 Design guidance
Consideration of storm surge and storm tide is important in design of TMR infrastructure and must be
considered appropriately to ensure that the design considers the flood risk correctly. There is a
possibility that the design can be overly conservative if flooding, high tides and storm surge are
assumed to be coincident. In practice, there is a slightly higher probability that they are associated, but
the assumption of coincidence is generally too conservative.
This guidance is provided as an interim measure until the Australian Rainfall and Runoff guidelines are
finalised and depend on the specific situation.
Transport and Main Roads, January 2014 12Storm Tide – Issues for Design of Road Infrastructure in Coastal Areas,
In general, the dependence is not strong for most of Queensland, but there is some dependence
meaning that some consideration may be necessary. The situation where storm tide directly affects
the infrastructure (rather than impacting only on the tailwater level) will also need specific
consideration.
The recommended design procedure for hydraulic assessment for TMR drainage infrastructure
located close to the coast, where tidal influences may be an issue is as follows:
1. Prepare the design flood inflows using standard hydrology procedures.
2. Establish the hydraulic model (HEC-RAS or other) for the water course from upstream of the
structure to the downstream limit at the mouth of the stream.
3. Determine the astronomical tides for the mouth of the stream using the published tide data.
4. Determine storm tide levels for the mouth of the stream using published results from council
storm surge study, more regional results or the state wide generic results from the DEHP.
5. Analyse the flood levels and hydraulic design for the structure for three cases. These are:
a. catchment flooding associated with storm tides of the same probability (complete
dependence)
b. catchment flooding with MHWS as the tailwater level (assumed to be almost complete
independence)
c. storm tides without any catchment flooding (complete independence).
6. Determine the difference between the scenarios.
7. If the difference is sufficiently small to accept, adopt the complete dependence case as the
design condition, which will result in a slightly conservative result.
8. If the difference is large enough that it may have an impact on the design, a decision needs to
be made on the appropriate design approach. It may still be seen as acceptable to assume
complete dependence resulting in a conservative result, though this does result in a design
flood level higher than could be justified for the adopted probability.
9. A decision needs to be made then on the level of dependence to be adopted, with criteria
noted above. If the decision is to be made to accept complete independence, the tailwater
level of the MHWS should be adopted. If the decision is that there is partial dependence, the
tailwater level needs to be accepted as a point between the MHWS level and the storm tide
level.
10. The design floods should then be analysed for the catchment floods with the selected tailwater
level.
11. As a check, the catchment floods should also be analysed with a lower tailwater level to check
for design flow velocities to determine scour potential. The lower tide level should be mean
sea level of MLWS.
Once the procedure in Australian Rainfall and Runoff has been finalised and published, this will
provide a clearer and more consistent method for making allowance for storm tide in the tailwater
assessment for drainage infrastructure in tidal regions. However for the interim, the procedure outlined
here should be adopted, though it is recognised that this procedure still has some uncertainty.
Transport and Main Roads, January 2014 13Storm Tide – Issues for Design of Road Infrastructure in Coastal Areas, 5 Conclusion Consideration of storm surge and storm tide is important in design of TMR infrastructure and must be considered appropriately to ensure that the design considers the flood risk correctly. There is a possibility that the design may be overly-conservative if flooding, high tides and storm surge are all assumed to be coincident. In practice, there is a slightly higher probability that they are associated, but the assumption of coincidence is generally too conservative. This guide has provided advice on an appropriate approach to design of drainage infrastructure in coastal areas to account for storm surge in an appropriate way. This guidance is as interim guidance, which will need updating once the Australian Rainfall and Runoff project has been finalised. 6 References Australian Rainfall & Runoff Revision Projects (2012) “Revision Project 18: Interaction of Coastal Processes and Severe Weather Events”, Stage 2 report, Engineers Australia. Cardno Lawson Treloar (2009) “Storm Tide Hazard Study”, Report prepared for Moreton Bay Regional Council. Collins, L, B McPherson, D McLuckie and D Hanslow (2012) “Preliminary Examination of Coast and Catchment Flooding Interaction from the Data”, Floodplain Management Association Annual Conference, Batemans Bay. Department of Environment and Heritage Protection (2013) “Coastal Hazard Technical Guide: Determining Coastal Hazard Areas”, DEHP, April 2013. Department of Science, Information Technology, Innovation and the Arts (2012) “Tropical Cyclone Yasi: Post Cyclone Coastal Field Inspection”, Brisbane. Department of Science, Information Technology, Innovation and the Arts (2012) “Coincident Flooding in Queensland: Joint probability and dependence methodologies”, Science Delivery, October 2012. Hardy, TA, Mason, LB, Young, IR, bin Mat, H and Stark, KP (1987) “Frequency of Cyclone Induced Water Levels including the effects of Mean Sea Level Rise: Trinity Point”, Department of Civil and Systems Engineering, James Cook University, Report for Macdonald Wagner Consulting Engineers. Hardy, T, L Mason and A Astorquia (2004) “The Frequency of Storm Surge plus Tide during Tropical Cyclones for Selected Open Coast Locations along the Queensland East Coast”, report prepared for Queensland Government. Harper, B (1985) “Storm Tide Statistics – Parts 1 – 8”, Reports prepared by Blain Bremner and Williams Pty Ltd for the beach protection Authority. Harper, B (1998) “Storm tide threat in Queensland: History, prediction and relative risks”, Conservation technical report No 10, Queensland Department of Environment and Heritage. Maritime Safety Queensland (2013) “Queensland Tide Tables 2013”, Queensland Government, Brisbane (published annually). Mason, LB, Hardy, TA and Bode, L (1992) “Frequency of Cyclone Induced Water Levels – marlin Coast”, Department of Civil and Systems Engineering, James Cook University, Report for Mulgrave Shire Council. Transport and Main Roads, January 2014 14
Storm Tide – Issues for Design of Road Infrastructure in Coastal Areas,

McMonagle, CJ (1980) “Extreme Water Levels Gladstone and the Narrows”, Report by Blain Bremner
and Williams Pty ltd for Coordinator Generals Department.

McMonagle, CJ (1995) “Storm Tide Statistics Cardwell Region”, Report for Rust PPK Pty Ltd for
Beach Protection Authority.

McMonagle, CJ (1979) “Storm Surge and Tide Investigations for New Brisbane Airport”, Report for
Blain Bremner and Williams Pty Ltd for Commonwealth Department of Housing and Construction.

Treloar, DG (1985) “Storm Tide Statistics – Hervey Bay Region”, Report prepared by Lawson and
Treloar Pty Ltd for Beach Protection Authority.

Transport and Main Roads, January 2014                                                            15
Storm Tide – Issues for Design of Road Infrastructure in Coastal Areas,

Appendix 1 - Detailed tropical cyclone storm tide risk along the Queensland
coast (Harper, 1998)

Transport and Main Roads, January 2014                                        16
Storm Tide – Issues for Design of Road Infrastructure in Coastal Areas,

Transport and Main Roads, January 2014                                    17
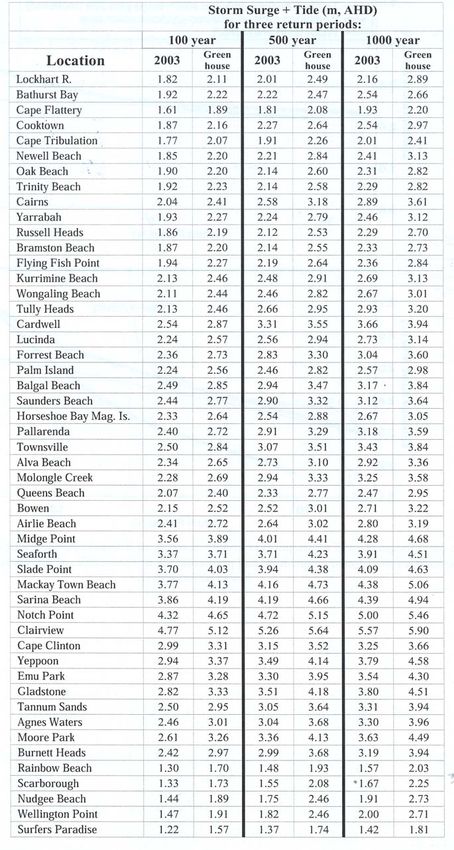
Storm Tide – Issues for Design of Road Infrastructure in Coastal Areas,

Appendix 2 - Storm surge plus tide at given ARIs for 2003 conditions and with
future climate change conditions

Hardy, Mason and Astorquia (2004)

Transport and Main Roads, January 2014                                          18
Storm Tide – Issues for Design of Road Infrastructure in Coastal Areas,

Appendix 3 - Summary of proposed method to account for combination of
storm tide and floods

Australian Rainfall and Runoff (2013)

Transport and Main Roads, January 2014                                    19
You can also read