Strandlines from Large Floods on the Colorado River in Grand Canyon National Park, Arizona - Scientific Investigations Report 2021-5048
←
→
Page content transcription
If your browser does not render page correctly, please read the page content below
Strandlines from Large Floods on the Colorado River in
Grand Canyon National Park, Arizona

Scientific Investigations Report 2021–5048

U.S. Department of the Interior
U.S. Geological Survey
Cover: U.S. Geological Survey hydrologist surveying a driftwood strandline along the Colorado
River in Grand Canyon National Park, Arizona.
Strandlines from Large Floods on the Colorado River in
Grand Canyon National Park, Arizona

By Thomas A. Sabol, Ronald E. Griffiths, David J. Topping, Erich R. Mueller, Robert B. Tusso, and
Joseph E. Hazel, Jr.

Scientific Investigations Report 2021–5048

U.S. Department of the Interior
U.S. Geological Survey
U.S. Geological Survey, Reston, Virginia: 2021
First release: August 2021
Revised: September 2021

For more information on the USGS—the Federal source for science about the Earth, its natural and living
resources, natural hazards, and the environment—visit https://www.usgs.gov or call 1–888–ASK–USGS.
For an overview of USGS information products, including maps, imagery, and publications,
visit https://store.usgs.gov.

Any use of trade, firm, or product names is for descriptive purposes only and does not imply endorsement by the
U.S. Government.

Although this information product, for the most part, is in the public domain, it also may contain copyrighted materials
as noted in the text. Permission to reproduce copyrighted items must be secured from the copyright owner.

Suggested citation:
Sabol, T.A., Griffiths, R.E., Topping, D.J., Mueller, E.R., Tusso, R.B., and Hazel, J.E., Jr., 2021, Strandlines from large
floods on the Colorado River in Grand Canyon National Park, Arizona: U.S. Geological Survey Scientific Investigations
Report 2021-5048, 41 p., https://doi.org/10.3133/sir20215048.

Associated data for this publication:
Sabol, T.A., Griffiths, R.E., Topping, D.J., Mueller, E.R., Tusso, R.B., and Hazel, J.E., Jr., 2021, Surveyed peak-stage
elevations, coordinates, and indicator data of strandlines from large floods on the Colorado River in Grand Canyon
National Park, Arizona: U.S. Geological Survey Data Release, https://doi.org/10.5066/P9GIQ9ZN.

ISSN 2328-0328 (online)
iii

Contents
Abstract............................................................................................................................................................1
Introduction.....................................................................................................................................................1
Purpose and Scope........................................................................................................................................1
Peak-Stage Indicators: Types and Preservation.......................................................................................2
Study Area.......................................................................................................................................................2
Expected Strandline Occurrence Based on Gaging Record...................................................................3
Methods...........................................................................................................................................................4
     Field Survey............................................................................................................................................4
     Historical Photography.........................................................................................................................4
     Strandline Classification.......................................................................................................................5
     Longitudinal Profiles and Slopes of Strandlines ..............................................................................6
     Stage-Discharge Relations..................................................................................................................6
     Comparison of Stage-Discharge Relations with a Predictive Numerical Model........................6
Results ..............................................................................................................................................................6
     Peak-stage Indicator Strandline Classification................................................................................6
             The Flood of 1884 (210,000 ft3/s)..................................................................................................8
             The Flood of 1921 (170,000 ft3/s)................................................................................................10
             The Floods of 1957 (125,000 ft3/s) and 1958 (108,000 ft3/s).....................................................10
             The Flood of 1983 (97,000 ft3/s)..................................................................................................10
     Longitudinal Profiles and Slopes of Strandlines.............................................................................11
Stage-Discharge Relations.........................................................................................................................14
     Strandline Elevations Relative to a Local Datum............................................................................14
     Comparison of Stage-Discharge Relations with a Predictive Numerical Model......................16
Discussion......................................................................................................................................................17
     Strandline Classification: Multiple Sources of Evidence..............................................................17
     Stage-Discharge Relations and River Width..................................................................................20
     Evaluation of Predicted Flood Stages from a Numerical Model..................................................21
Conclusions...................................................................................................................................................21
References Cited..........................................................................................................................................22
Appendix 1. Peak-Stage Indicator Data Collected Downstream from the Colorado River
        Near Grand Canyon, Arizona, Gaging Station............................................................................25
Appendix 2. Comparison of Stage-Discharge Relations Generated from the Strandlines
        with Those Generated by the Model of Magirl and Others (2008)..........................................39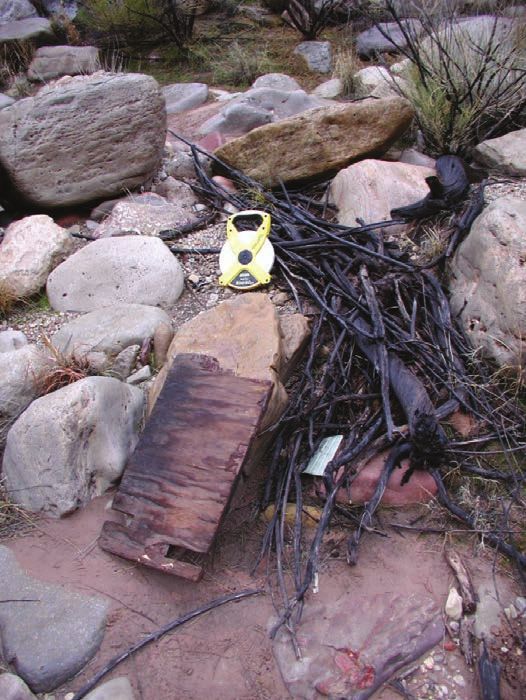
iv

     Figures
        1.    Map of the Colorado River study area.......................................................................................2
        2.    Graph showing the instantaneous discharge record of the Colorado River at the
              Lees Ferry, Arizona, gaging station at river mile 0...................................................................3
        3.    Photographs showing type examples of peak-stage indicators found along the
              Colorado River in Grand Canyon National Park, Arizona........................................................5
        4.    Photograph and cross section showing strandlines at river mile 74.0 in Grand
              Canyon National Park, Arizona....................................................................................................7
        5.    Cropped version of photograph taken by Robert Brewster Stanton in 1890 looking
              downstream at the Palisades Creek area at river mile 66.0–66.4..........................................8
        6.    Photographs showing weathering of driftwood that was likely emplaced by flood of
              1884 and flood of 1921...................................................................................................................9
        7.    Photograph showing the likely strandlines from 1958, 1957, and 1921...............................10
        8.    Longitudinal profiles of the 8,000 cubic feet per second reference stage and
              surveyed peak-stage indicators segregated into the five primary strandlines
              from the 1884, 1921, 1957, 1958, and 1983 floods.....................................................................11
        9.    Longitudinal profiles of strandlines in four shorter reaches showing linear
              regressions...................................................................................................................................12
       10.    Plots showing example comparisons between stage-discharge relations based on
              surveyed peak-stage indicators and stage-discharge relations predicted by the
              numerical model of Magirl and others.....................................................................................17
       11.    Photographs showing driftwood near river mile 83.4 on the Colorado River....................18
       12.    Photographs looking downstream at the cobble bar below Tanner Rapid........................18
       13.    Photographs showing driftwood at the base of the dune circled in figure 12..................19
       14.    Plan view photographs of select reaches of the Colorado River where the number
              of classified peak-stage indicators allows estimates of the lateral extent of
              flood inundation...........................................................................................................................20
       15.    Graph showing examples of stage-discharge relations that illustrate the range of
              calculated discharges for a given stage.................................................................................21

     Tables
        1. Percentage of peak-stage indicators comprising each of the five primary strandlines...9
        2. Calculated strandline slopes for selected reaches of the Colorado River in
           Grand Canyon National Park, Arizona......................................................................................13
        3. Stage-discharge relations developed for short reaches from surveyed peak-stage
           indicators and the orthometric elevation of the 8,000 cubic feet per second
           reference stage............................................................................................................................14
        4. Strandline elevations relative to the 8,000 cubic feet per second reference stage
           for ten reaches of the Colorado River in Grand Canyon National Park, Arizona .............16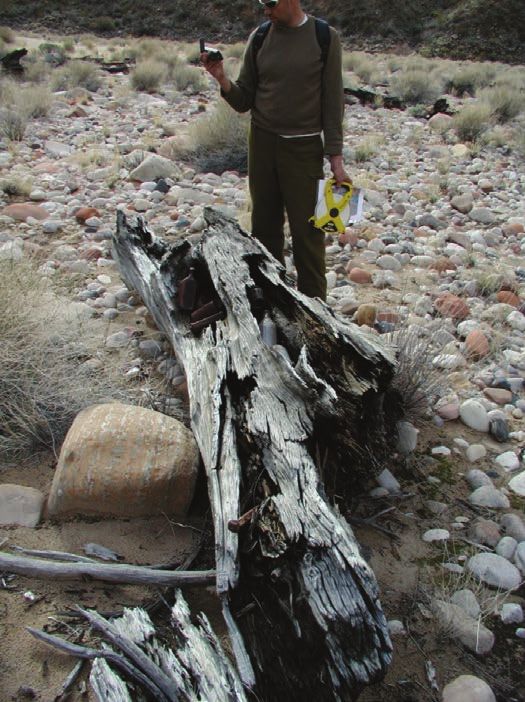
v

Conversion Factors
U.S. customary units to International System of Units

               Multiply                                    By                    To obtain
                                                         Length
 inch (in.)                                   2.54                   centimeter (cm)
 inch (in.)                                  25.4                    millimeter (mm)
 foot (ft)                                    0.3048                 meter (m)
 mile (mi)                                    1.609                  kilometer (km)
                                                        Flow rate
 cubic foot per second (ft3/s)                0.02832                cubic meter per second (m3/s)

Datum
Vertical coordinate information is referenced to the North American Vertical Datum of 1988
(NAVD 88).
Horizontal coordinate information is referenced to the North American Datum of 1983 (NAD 83).

Abbreviations
ESRI                         Environmental Systems Research Institute
GCMRC                        Grand Canyon Monitoring and Research Center
GCNP                         Grand Canyon National Park
GPS                          global positioning system
HFEs                         high-flow experiments
NAD83                        North American Datum of 1983
NAVD88                       North American Vertical Datum of 1988
RM                           river mile
USGS                         U.S. Geological Survey
vi

Strandlines from Large Floods on the Colorado River in
Grand Canyon National Park, Arizona
By Thomas A. Sabol,1 Ronald E. Griffiths,1 David J. Topping,1 Erich R. Mueller,1 Robert B. Tusso,1 and
Joseph E. Hazel, Jr.2

Abstract                                                           measurements of peak stage to constrain bed roughness
                                                                   (for example, Chow, 1959; Dalrymple and Benson, 1967;
      Strandlines of peak-stage indicators (such as driftwood      O’Connor and Webb, 1988; Baker, 2000; Magirl and others,
logs, woody debris, and trash) provide valuable data for           2008). The purpose of this report is to document the locations
understanding the maximum stage and extent of inundation           and elevations of strandlines that record the peak stages of
during floods. A series of seven strandlines have been preserved   large historical floods over long reaches of the Colorado River
along the Colorado River in Grand Canyon National Park,            in Grand Canyon National Park (GCNP), Arizona.
Arizona, USA. A survey and analysis of these strandlines was             Prior to the construction of Glen Canyon Dam, large
completed from the Colorado River at Lees Ferry, Ariz., gaging     floods were relatively common and played a dominant role
station to the Colorado River near Grand Canyon, Ariz., gaging     in the geomorphic evolution of the Colorado River in Grand
station. Owing to the longitudinally discontinuous nature of the   Canyon (Howard and Dolan, 1981; Carothers and Brown,
strandlines, several lines of evidence were used to determine      1991). Large floods scoured sand from the riverbed and built
the year of the flood associated with each strandline segment.     eddy sandbars and other high-elevation flood deposits (Howard
This evidence included strandline relative vertical position,      and Dolan, 1981; Schmidt, 1990; Schmidt and Graf, 1990;
degree of peak-stage indicator weathering, datable trash           Topping and others, 2000a, b). In addition, these large floods
drift, and map-view location. The seven distinct strandlines       reduced the severity of rapids at tributary mouths through the
identified were deposited during floods with the following peak    downstream transport of large boulders (Howard and Dolan,
discharges (in cubic feet per second [ft3/s]) at the Colorado      1981; Kieffer, 1985; Webb and others, 1989, 1999). Operation
River at Lees Ferry, Ariz., gaging station (year of flood in       of the dam has flattened the annual hydrograph by greatly
parentheses): 210,000 ft3/s (1884), 170,000 ft3/s (1921),          increasing baseflows and removing large floods (Topping and
125,000 ft3/s (1957), 108,000 ft3/s (1958), 97,000 ft3/s (1983),   others, 2003). After the closure of the dam in March 1963,
52,500 ft3/s (1986), and 45,000 ft3/s (multiple events between     the only flood with a peak discharge similar to the annual
1996 and 2012). Stage-discharge relations were developed in        pre-dam flood occurred in 1983 when the dam spillways were
areas where all, or most of the strandlines were present, and      used, although smaller dam-released floods have occurred
were compared to predicted stage-discharge relations from          since 1983. After initial tests of the concept in 1996, 2004,
a one-dimensional flow model. River width exerted a strong         and 2008, artificial controlled floods (now known as high-
control on these relations, with much greater stage change         flow experiments [HFEs]) for the purpose of rebuilding eddy
occurring for a given discharge change in narrower bedrock-        sandbars became part of standard dam operations in 2012 (U.S.
dominated reaches than in wider reaches with more extensive        Department of the Interior, 2011, 2016), and since 2012, HFEs
channel-margin alluvium. This comprehensive dataset allows         were conducted in 2013, 2014, 2016, and 2018.
for the verification of model-predicted flood stage along the
Colorado River in Grand Canyon National Park.
                                                                   Purpose and Scope
Introduction                                                             Understanding the effects of dam operations in the con-
                                                                   text of pre-dam floods requires knowing the peak-stage inun-
       Large floods play a dominant role in determining river      dation levels that occur during these smaller post-dam floods,
morphology (Leopold and others, 1964). Documentation of the        the larger post-dam 1983 flood, and the still larger pre-dam
effects of large floods on river morphology requires knowing       floods. The data and interpretations presented in this report
the peak stage of these floods over long river reaches. Although   add to the body of literature on the inundation levels of floods
it is possible to use standard hydraulic models to calculate       on the Colorado River in Grand Canyon. Peak-stage indicators
peak flood stage over long reaches, large biases and (or) errors   in short reaches of the Colorado River in GCNP have been
are likely in water-surface profiles modeled without sufficient    reported and analyzed by Hereford (1984, 1996), Hereford
                                                                   and others (1993, 1996, 1998, 2000), O’Connor and others
  1
   U.S. Geological Survey.                                         (1994), Webb and others (2002), Topping and others (2003),
  2
   Northern Arizona University.                                    Draut and others (2005), and Magirl and others (2008). This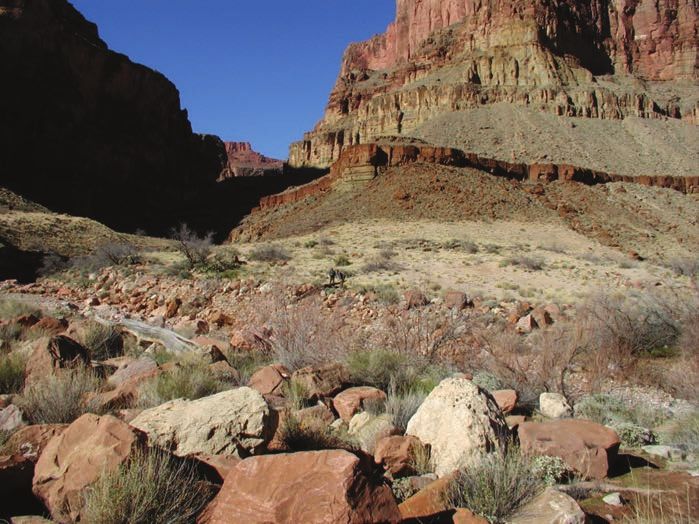
2 Strandlines from Large Floods on the Colorado River in Grand Canyon National Park, Arizona
current report provides the first comprehensive accounting of these strandlines are typically distinct, some scatter of material
strandline-forming peak-stage indicators over a long (that is, to elevations below these lines occurs. As a flood recedes,
87-mile-long) segment of the Colorado River in GCNP. some of the floating detritus adjacent to the bank may “sag” to
slightly lower elevations such that, after the flood, woody- and
trash-debris mats drape the landscape. In this case, the peak
Peak-Stage Indicators: Types and flood stage is associated with the highest elevation of these
Preservation mats. The second condition for preservation of peak-stage
indicators in multiple distinct strandlines is that the largest
Several types of strandline-forming peak-stage indicators flood is not the most recent, otherwise the strandlines from the
(Partridge and Baker, 1987; Baker, 1987; Webb and Rathburn, previous smaller floods would be erased by this more-recent
1988) were identified and surveyed in the field: large drift- larger flood. As described in this report, this second condition
wood logs, milled lumber, woody-debris piles, and trash is satisfied on the Colorado River in GCNP such that seven
(mainly aluminum cans and glass bottles). Preservation of distinct strandlines are preserved for floods spanning the
these peak-stage indicators in multiple distinct strandlines period from 1884 through 2012.
requires two conditions. The first of these conditions is that
adequate detritus must be present along the banks or floating
on the water surface during the rising limb of a flood. Detritus
Study Area
deposited along the banks during the rising limb is then This investigation was conducted on the Colorado River
pushed to higher elevations by the rising flood water so that in GCNP (fig.1), a bedrock-controlled river with a char-
the detritus collects to ultimately form a strandline at the acteristic rapid-pool geomorphology (Howard and Dolan,
elevation of peak stage (Koenig and others, 2016). Although 1981). Although peak-stage indicators from large floods
−114° −113° −112° −111°
Pa
ria
Lake
River Powell
NEVADA
37° UTAH
ARIZONA
k
Lees Ferry
re e
GLEN CANYON
Kanab C
0 DAM
USGS
ON
09380000
NY
CA
25
BLE
MAR
150 50
175 125
Lake USGS
Mead r GR 100
ve AN 09402500
275 Ri H D
o CA
200 NY 75
ad
36° ON
av
Litt
or
as
le
Col
uC
250
Co
ree k
lor
NEVADA 225
ad o R i
UTAH USGS
EXPLANATION
09404200 USGS
ver
Map 09404200
USGS gaging station
area
50 GCMRC river mile
ARIZONA
Grand Canyon National Park
Base from 1:100,000 scale U.S. Geological Survey National Hydrography Dataset 0 20 40 60 MILES
Universal Transverse Mercator zone 12 north
North American Datum of 1983 0 20 40 60 KILOMETERS
Figure 1. Map of the Colorado River study area. The study area encompasses reaches of the Colorado River in Marble and Grand
Canyons beginning near river mile 0 at the U.S. Geological Survey (USGS) Colorado River at Lees Ferry, Arizona, gaging station
(09380000), and terminating downstream near RM 225, at the USGS Colorado River above Diamond Creek near Peach Springs, Ariz.,
gaging station (09404200). GCMRC, Grand Canyon Monitoring and Research Center.Expected Strandline Occurrence Based on Gaging Record 3
may be preserved anywhere on the channel margins, the (RM 0) downstream to the mouth of the Little Colorado River,
main environments where peak-stage indicators collect to located near RM 61.9; Grand Canyon extends from the mouth
form distinct strandlines are fan-eddy complexes (Schmidt of the Little Colorado River (RM 61.9) downstream to the
and Graf, 1990) and large higher-elevation cobble bars. Grand Wash Cliffs near RM 277. The terms “left bank” and
Strandlines in fan-eddy complexes are typically preserved “right bank” designate direction from the centerline of the
in two areas: the zone of flow constriction on the upstream Colorado River for an observer facing downstream (Rantz
part of a tributary debris fan, and along the bank in the lateral and others, 1982). Strandline data from the 87-mile-long river
recirculation eddy downstream of the constriction. Strandlines segment between the Colorado River at Lees Ferry, Ariz.,
will slope down toward the downstream (that is, down- 09380000 (RM 0) and Colorado River near Grand Canyon,
canyon) direction in all environments except on the margins Ariz., 09402500 (RM 87) gaging stations are presented in the
of lateral recirculation eddies where, because the water along main part of this report. The locations of strandline-forming
the bank upstream from the eddy reattachment point is flowing peak-stage indicators for three short river reaches between
in the up-canyon direction, strandlines will slope toward the RM 87 and the Colorado River above Diamond Creek near
upstream (that is, up-canyon) direction. Peach Springs, Ariz., 09404200 (RM 225) gaging stations are
By the convention established by the 1923 Birdseye presented in appendix 1.
expedition (Birdseye, 1924), longitudinal locations along
the Colorado River in GCNP are referenced to a river-mile
(RM) system beginning with RM 0 at the Colorado River Expected Strandline Occurrence
at Lees Ferry, Ariz., 09380000 gaging station (fig. 1). This Based on Gaging Record
river-mile system was revised by the U.S. Geological Survey
(USGS) Grand Canyon Monitoring and Research Center The peak magnitude of floods on the Colorado River
(GCMRC) in 2006 (U.S. Geological Survey, 2006). This in GCNP has declined in a stepwise manner since the late
revision, in addition to commonly used place names (Belknap 1800s (Topping and others, 2003) leading to the existence of
and Evans, 1969; Stevens, 1983), are used for geographic seven distinct strandlines (fig. 2). The likely peak-discharge
reference herein. Marble Canyon extends from Lees Ferry levels (in cubic feet per second [ft3/s]), as gaged at the RM 0
250,000
1884 Peak discharge: 210,000 ft3/s
Instantaneous discharge, in cubic feet per second
200,000
1921 Peak discharge: 170,000 ft3/s
150,000 Series of events with peak discharge
similar in magnitude to the peak
discharge observed in 1957
1957 Peak discharge: 125,000 ft3/s
1927
1941
1949
1952
1958 Peak discharge: 108,000 ft3/s
100,000 1983 Peak discharge: 97,000 ft3/s
No floods larger than
the 1921 flood
during this period Closure of Glen 1984
Canyon Dam (1963)
1986 Peak discharge: 52,500 ft3/s
50,000 Peak discharge: 45,000 ft3/s
1996
2012
2004
2008
0
1880 1890 1900 1910 1920 1930 1940 1950 1960 1970 1980 1990 2000 2010 2020
Date
Figure 2. Graph showing the instantaneous discharge record of the Colorado River at the U.S. Geological Survey (USGS) Colorado
River at Lees Ferry, Arizona, 09380000 gaging station at river mile 0 (after Topping and others, 2003). Seven distinct strandlines (classified
by different colors) were expected in the field based on the progressive stepwise 1884 to 2012 decline of peak discharge during floods.
The brown oval indicates the four floods of similar peak discharge that preceded the 1957 flood. The 1984 flood (with peak discharge
similar to that of the 1986 flood) is indicated, as are the 1996, 2004, 2008, and 2012 floods. ft3/s, cubic feet per second.4 Strandlines from Large Floods on the Colorado River in Grand Canyon National Park, Arizona
gaging station, and the most-recent year of occurrence (in and 2013 (Sabol and others, 2021). These data provide a
parentheses) of the floods that produced these strandlines are: comprehensive survey of peak-stage indicators along the
210,000 ft3/s (1884), 170,000 ft3/s (1921), 125,000 ft3/s (1957), Colorado River corridor between RM 0 and RM 87 (fig. 1).
108,000 ft3/s (1958), 97,000 ft3/s (1983), 52,500 ft3/s (1986), In 2008, the locations of peak-stage indicators in three short
and 45,000 ft3/s (2012). In addition to the results of Topping reaches downstream from RM 87 were measured using a
and others (2003), peak-streamflow data from gaging stations handheld global positioning system (GPS) unit (appendix 1).
on the Colorado River downstream from our study area (U.S. Total-station measurements were made using an established
Geological Survey, 2020a, b) indicate that no floods larger network of survey control that references the 2011 realization
than the 1921 flood have occurred since 1884. Continuous of North American Datum of 1983 (NAD83) (NAD83,
gaging of the Colorado River has occurred since May 8, 1921, 2011; Kaplinski and others, 2017). The measurements were
at the Colorado River at Lees Ferry, Ariz., gaging station projected into the State Plane Coordinate System of 1983,
and since November 12, 1922, at the Colorado River near Arizona central zone (Federal Information Processing
Grand Canyon, Ariz., gaging station (Topping and others, Standard zone 0202). Vertical positions are provided in both
2003; instantaneous discharge data at https://www.gcmrc.gov/ NAD83 ellipsoid heights and in North American Vertical
discharge_qw_sediment/), thus removing all uncertainty about Datum of 1988 (NAVD88) orthometric elevations modeled
the post-1921 flood history of this river in our study area. from GEOID12b.
Floods of similar peak discharge will produce strandlines Identifying and accurately measuring the original
that are amalgamations of the peak-stage indicators deposited locations of peak-stage indicators decades after deposition
during these floods. More than seven floods likely formed the requires an understanding of how the indicators were
seven strandlines expected in our study area because multiple emplaced and how they have degraded or moved over time.
floods attained the peak discharges of 125,000 ft3/s—last Selecting the precise location to collect a surveyed data point
reached in 1957, 52,500 ft3/s—last reached in 1986, and is a function of the type of peak-stage indicator present;
45,000 ft3/s—last reached in 2012. Peak discharges of the selection of the surveyed location affects the quality of the
pre-dam floods during 1927, 1941, 1949, and 1952 were peak-stage data measured at a given site (Koenig and others,
all similar to the 125,000 ft3/s peak discharge of the 1957 2016). The approaches used for collecting survey data for each
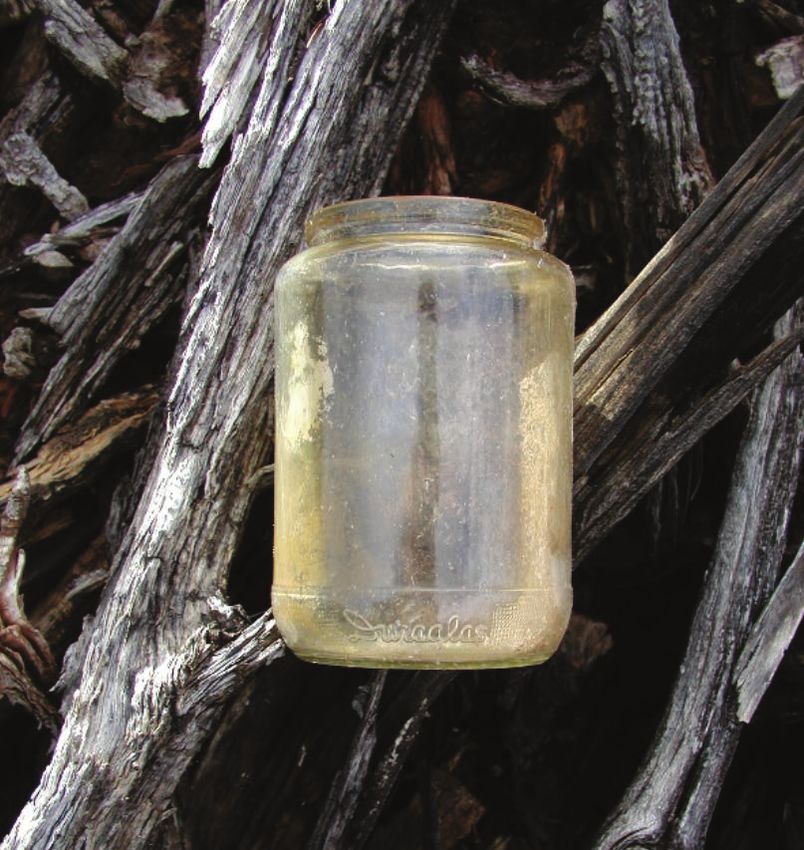
flood (fig. 2). Thus, the driftwood, woody debris, and trash type of peak-stage indicator (fig. 3) are as follows:
deposited at peak stage during these earlier floods and the
1957 flood probably comprise an amalgamated strandline • Driftwood logs and milled lumber: Interpretation of
that we reference as simply the “1957” strandline. Similarly, large driftwood deposits is potentially complicated.
large post-dam floods during 1984 and 1986 comprise an In settings where abundant driftwood forms a well-
amalgamated strandline, as do the 1996, 2004, 2008, and defined strandline, survey points were collected where
2012 HFEs released from the dam to rebuild sandbars (Webb each individual log came to rest and is in contact with
and others, 1999; Topping and others, 2010; Melis, 2011; the highest point on the land surface.
U.S. Department of the Interior, 2011). Although the peak • Woody-debris pile: Survey points documenting debris-
discharge of the 1984 flood (58,200 ft3/s) was slightly larger pile elevations were collected at or near the top of the
than the peak discharge of the 1986 flood (52,500 ft3/s) at debris pile. Organic detritus is often deposited as large
RM 0 at the Colorado River at Lees Ferry, Ariz., gaging mats that vary in thickness and drape the topography of
station, the peak of the 1984 flood lasted only a few hours the underlying land surface. Woody-debris pile herein
and attenuated to 47,500 ft3/s by RM 87 at the Colorado River refers to accumulations of small logs, branches, and
near Grand Canyon, Ariz., gaging station. Thus, the peak other small organic detritus.
discharges of the 1984 and 1986 floods were similar through
much of the study area, likely forming an amalgamated • Trash: Trash drift deposited in the strandlines was
strandline that we refer to as the “1986” strandline. Owing to surveyed where it made contact with the land surface.
the similar peak discharge of the 1996, 2004, 2008, and 2012 Most items of trash were associated with other peak-
HFEs (42,000 to 45,000 ft3/s), peak-stage indicators deposited stage indicators and were used to help assign ages to
during these four floods were similarly expected to comprise the strandlines. Trash drift consisted of cans, glass
an amalgamated “1996–2012” strandline. bottles, nails in milled lumber, and plastic. Hunt and
Mabey (1966) pioneered using trash to date historical
floods; their trash dating methods are described in
Methods detail in Hunt (1959, 1975) and were utilized and
(or) refined to place age constraints on strandlines by
Field Survey Hereford (1993), Hereford and others (1993, 1998,
2000), House and Baker (2001), and House and others
Coordinates of peak-stage indicators were measured
(2002).
using a survey-grade total-station theodolite during five
separate field surveys conducted in 2004, 2009, 2011, 2012,Methods 5
A B
C
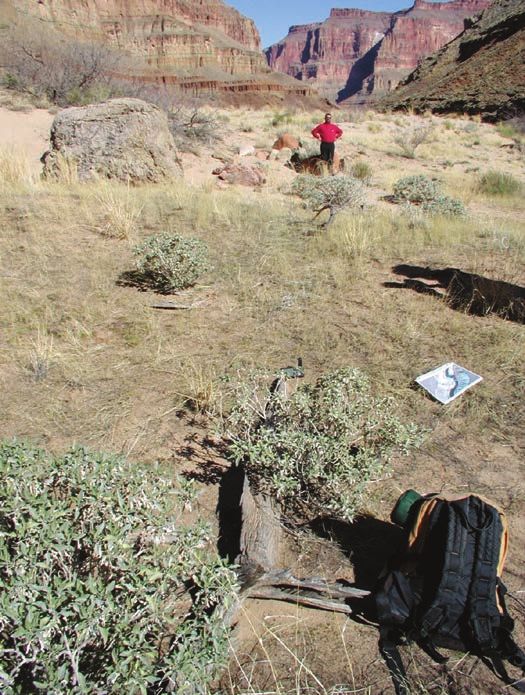
Figure 3. Photographs showing type examples of peak-stage
indicators found along the Colorado River in Grand Canyon
National Park, Arizona. Shown are (A) driftwood logs, (B) a
woody-debris pile, and (C) trash.
Historical Photography to the nearest 0.01 mile, by projecting the surveyed point to
the river centerline using a spatial join analysis in ArcMap.
Historical photographs are a resource for detecting The relative vertical positions of the peak-stage indicators
change over time (Webb, 1996). Many of the photographs were used to initially classify the peak-stage indicators into
taken along the Colorado River during an 1889–1890 the seven strandlines suggested by the flood history in figure
expedition by Robert Brewster Stanton (Webb, 1996) showed 2. In addition to the surveyed coordinates, airborne imagery
sand deposits and driftwood from the 210,000 ft3/s 1884 flood. (Durning and others, 2016; Davis, 2012) was also used to help
Because no floods larger than the 1884 flood occurred on the classify strandlines. The surveyed locations of the datable
Colorado River in our study area between 1884 and 1890 trash drift were then used to refine the assignment of the peak-
(Topping and others, 2003; U.S. Geological Survey, 2020b), stage indicators into these seven strandlines.
these photographed deposits and driftwood are likely from The elevations of peak-stage indicators relative to
the 1884 flood. The positions of driftwood and the maximum the local reference datum, that is, the reference stage at
elevation of the highest-elevation clean sand (likely deposited a discharge of 8,000 ft3/s, was used to confirm strandline
during the 1884 flood) in these photographs were therefore assignments. The longitudinal profile of the 8,000 ft3/s
used in the field to aid in determining the elevation of the peak reference stage was developed by Magirl and others (2005,
stage of the 1884 flood. 2008) and has an absolute vertical error estimated to be less
than 0.3 meters (m). In areas where strandlines from each of
Strandline Classification the five largest peak-discharge inundation levels (that is, the
strandlines assigned to the 1884, 1921, 1957, 1958, and 1983
A total of 1,812 peak-stage indicators were surveyed floods) were well defined, an elevation relation was developed
and analyzed during this study. Survey data were compiled in for each strandline using the 8,000 ft3/s reference stage as a
ArcMap 10.3.1. The survey point associated with the location datum. These relations were used to help inform strandline
of each peak-stage indicator was assigned a RM position, assignments in river segments where peak-stage-indicator data
men20-3155_fig036 Strandlines from Large Floods on the Colorado River in Grand Canyon National Park, Arizona
were sparse, or the sequence of strandlines was incomplete. 45,000 ft3/s from the Magirl and others (2008) model were thus
The locations, elevations, and assigned strandlines (that is, interpolated for comparison to the same locations where we
1884, 1921, 1957, 1958, 1983, 1986, and 1996–2012) of all developed these stage-discharge relations (appendix 2).
peak-stage indicators are presented in Sabol and others (2021).
Peak-stage indicators that could not be clearly assigned to
one of these strandlines are also included in Sabol and others Results
(2021) but were removed from the analyses herein.
Peak-stage Indicator Strandline Classification
Longitudinal Profiles and Slopes of Strandlines
As expected on the basis of the 1884-present flood history
A longitudinal profile over the entire river segment from in our study area, the surveyed peak-stage indicators defined
RM 0 through RM 87 was developed for each strandline using five strandlines above the likely peak stage of the 52,500 ft3/s
the surveyed elevation from the peak-stage indicators and 1986 flood (fig. 2). An example of these five “primary”
associated centerline RM. To highlight more subtle changes strandlines in a photograph and cross section at RM 74.0 are
in water-surface slope, longitudinal profiles were also created shown in figure 4. These strandlines are at similar relative
over shorter reaches. Where the density of data allowed, elevations as those surveyed by Draut and others (2005)
water-surface slopes were calculated. upstream at Palisades Creek (herein referred to as Palisades)
at RM 66.0–66.4 (Sabol and others, 2021). On the basis of the
Stage-Discharge Relations flood history provided in Topping and others (2003), Draut
and others (2005) assigned these strandlines, from highest to
Stage-discharge relations were derived at discrete locations lowest elevation, to the: 210,000 ft3/s 1884 flood, 170,000 ft3/s
by fitting 2nd order polynomials to the surveyed elevation data 1921 flood, 125,000 ft3/s 1957 flood, 108,000 ft3/s 1958
and the discharge value assigned to the strandlines. These flood, and 97,000 ft3/s 1983 flood. Additional support for
relations were generally developed at locations where strand- their interpretation is provided by a photograph taken of the
lines from all five of the largest floods (that is, the 1884, 1921, Palisades area by Robert Brewster Stanton in 1890 (fig. 5),
1957, 1958, and 1983 floods) were present within a 0.1-mile which showed relatively fresh sand from the likely 1884 flood
longitudinal distance, and the longitudinal variation in channel extending to near the location of the Draut and others’ (2005)
geometry was negligible. In a few cases, stage-discharge interpreted 1884 driftwood strandline. Thus, as justified in the
relations were also developed for areas of interest, where data “Expected Strandline Occurrence Based on Gaging Record”
from fewer than five strandlines were present. To allow for the section above and consistent with Draut and others (2005),
comparison between stage-discharge relations, the datum of all we assigned these five primary strandlines in our study area
relations was set equal to 0 feet at the 8,000 ft3/s reference stage, to the peaks of the 1884, 1921, 1957, 1958, and 1983 floods
as determined by Magirl and others (2005, 2008). (fig. 2, fig. 4). The lower-elevation 1986 and 1996–2012
strandlines are not considered to be primary strandlines,
Comparison of Stage-Discharge Relations with as these strandlines generally included less driftwood and
a Predictive Numerical Model were not surveyed with the same consistency as the primary
strandlines. Importantly, we found no driftwood at elevations
Magirl and others (2008) developed a predictive one- higher than the likely 1884 strandline. Given that driftwood
dimensional numerical model that simulated stages for would be expected to last as long as several hundred years
discharges from 8,000 ft3/s to 210,000 ft3/s. Because of a lack in the semi-arid climate in our study area (Webb, 1996), this
of continuous bathymetric data when the model was developed, key observation suggests strongly that no floods during the
the Magirl and others (2008) model used a synthetic bathymetry last several hundred years were larger than the 210,000 ft3/s
generated using a constant Manning’s n roughness such that the 1884 flood. Although there is evidence of a single, much
predicted stage at a discharge of 8,000 ft3/s would match the larger ~300,000 ft3/s flood in the Colorado River ~1,200 to
measured stage at this discharge. We evaluated the predicted 1,600 years ago (O’Connor and others, 1994; Topping and
stage-discharge output from the Magirl and others (2008) others, 2003), deposits from this singular event are old enough
hydraulic model using the stage-discharge relations developed that no driftwood would still be preserved. Thus, it is unlikely
from the strandlines. Stages for discharges of 210,000 ft3/s, that floods larger than the 1884 flood occurred in our study
170,000 ft3/s, 125,000 ft3/s, 108,000 ft3/s, 97,000 ft3/s, and area during the earlier 1800s.Results 7
A
125,000 ft3/s 170,000 ft3/s 210,000 ft3/s
97,000 ft3/s
108,000 ft3/s
2,635
B
2,630
2,624.46 ft at 210,000 ft3/s
2,625
2,621.47 ft at 170,000 ft3/s
2,620 ce
Elevation, in feet
2,616.35 ft at 125,000 ft3/s
urfa
n ds
2,615 2,612.52 ft at 108,000 ft3/s La
2,610.95 ft at 97,000 ft3/s
2,610
2,605
Water surface elevation
of 2,599.15 ft at 8,000 ft3/s
2,600
2,595
0 50 100 150 200 250 300 350
Distance from the center of the river, in feet
Figure 4. Photograph (A) and cross section (B) showing strandlines at river mile 74.0 in
Grand Canyon National Park, Arizona. Photograph (A) was taken on the left bank of the
river at river mile 74.0 looking upstream toward Unkar Creek Rapid, Arizona. Highlighted
in the photograph are five distinct strandlines of peak-stage indicators and their
associated peak discharge in cubic feet per second (ft3/s). An idealized cross section (B),
viewed upstream and perpendicular to the river centerline at the location of photograph
(A), shows the elevation of each strandline (in feet [ft]) and the likely peak discharge
associated with the flood that deposited each strandline. Elevation is orthometric
elevation.
men20-3155_fig048 Strandlines from Large Floods on the Colorado River in Grand Canyon National Park, Arizona
A
B
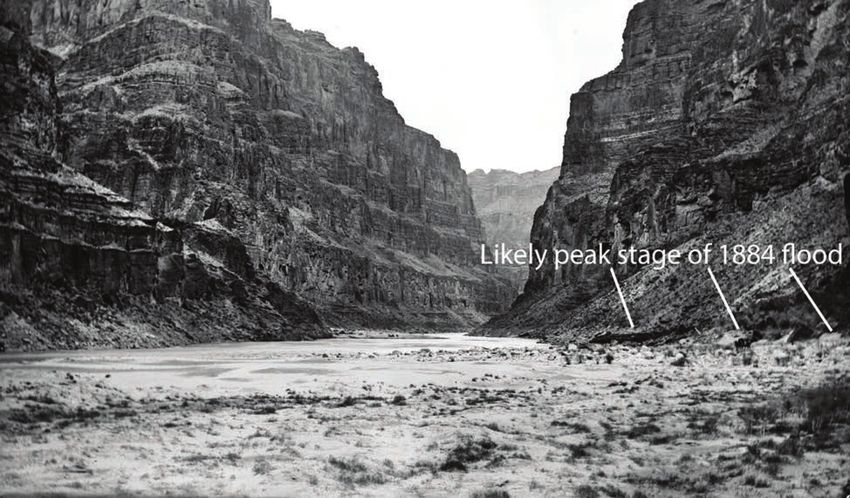
Figure 5. Cropped version of photograph taken by Robert Brewster Stanton in 1890 looking downstream
at the Palisades Creek area at river mile 66.0–66.4 (Robert Brewster Stanton, 57-RS-385, courtesy of The
National Archives). A, Palisades Creek area. Dashed line in (B) indicates approximate position of 1884
driftwood strandline surveyed as part of the study of Draut and others (2005). Hereford and others (1993)
and Hereford (1996) also used this photograph to infer the inundation extent of the 1884 flood in this
reach. The river is flowing from right to left in the photograph.
The Flood of 1884 (210,000 ft3/s) indicators associated with the 1884 flood accounted for
only 7.6 percent of all peak-stage indicators in the primary
The 210,000 ft3/s peak discharge of the 1884 flood was strandlines (table 1; Sabol and others, 2021). Driftwood
the highest discharge observed by western settlers to pass and debris deposited in this strandline are typically
the present location of the Colorado River at Lees Ferry, partially buried in fan sediments and display a high degree
Ariz., gaging station (Topping and others, 2003). Peak-stage of deterioration and disintegration (fig. 6A). Thus, the
men20-3155_fig05Results 9
Table 1. Percentage of peak-stage indicators comprising each of the five primary strandlines.
[ft3/s, cubic feet per second]
Year Peak flood discharge Percent of peak-stage indicators Number of peak-stage indicators
1884 210,000 ft3/s 7.6 122
1921 170,000 ft3/s 16.0 258
1957 125,000 ft3/s 29.0 467
1958 108,000 ft3/s 23.9 385
1983 97,000 ft3/s 23.4 376
Total = 1,608
A B
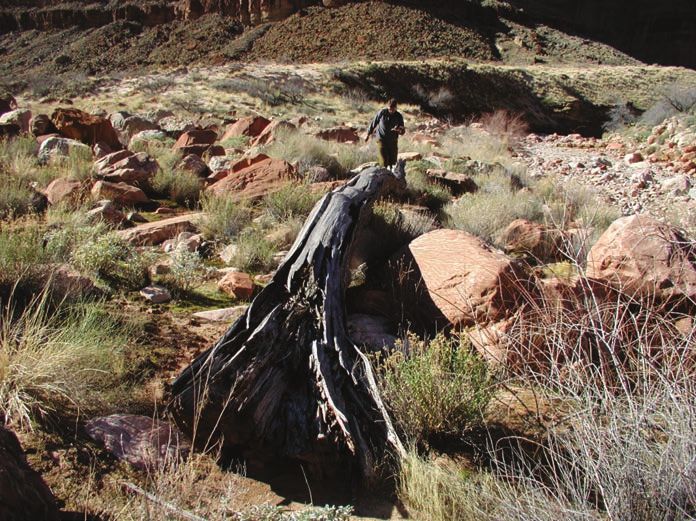
Figure 6. Photographs showing weathering of driftwood that was likely emplaced by (A) the 210,000 cubic feet per
second (ft3/s) flood of 1884, and (B) the 170,000 ft3/s flood of 1921. The degree of driftwood deterioration shown in these
photographs is common for 1884 and 1921 peak-stage indicators. As shown in (A), driftwood in the likely 1884 strandline
is commonly partially buried in fan sediments. Photographs were taken on the left bank of the Colorado River looking
upstream near (A) river mile 66.3 and (B) river mile 66.6, in the Palisades area.
weathering of these deposits over the last ~130 years is the Canyon by 1884, we found no trash in the likely 1884
likely cause for the relative sparsity of peak-stage indicators strandline. The interpreted 1884 strandline was typically
from this event. Although western settlers were beginning 3–5 feet higher in elevation than the likely 1921 strandline,
to inhabit the Colorado River basin upstream from Grand depending on local river width.10 Strandlines from Large Floods on the Colorado River in Grand Canyon National Park, Arizona
The Flood of 1921 (170,000 ft3/s) the Colorado River before the 1963 closure of Glen Canyon
Dam. Despite the difference in peak discharge between the
The 170,000 ft3/s flood of 1921 is the first flood two events, the peak-stage indicators emplaced by these flood
documented by a USGS gaging station (manually read staff peaks are described together because of their similarities in
gage installed on May 8, 1921) at Lees Ferry, Ariz., and is composition and location. Peak-stage indicators associated
also the highest magnitude flood directly recorded by the with the 1957 and 1958 floods account for respectively
USGS at that location (Topping and others, 2003). Peak- 29.0 percent and 23.9 percent of all peak-stage indicators
stage indicators associated with the 1921 flood accounted for surveyed among the five primary strandlines (table 1; Sabol
16.0 percent of all peak-stage indicators in the five primary and others, 2021). Most of the longer continuous driftwood
strandlines (table 1; Sabol and others, 2021). Driftwood and strandlines that exceeded ~100 m in length were composed
organic detritus in the 1921 strandline display a high degree of of wood from the 1957 and 1958 events (fig. 7). Peak-stage
weathering (fig. 6B), similar to the driftwood and debris in the indicators from 1958 were typically ~3 feet lower in elevation
sometimes-present, higher-elevation, 1884 strandline. In many than the 1957 strandline, and typically ~1.5 feet higher than
places, peak-stage indicators from 1921 defined the uppermost the 1983 strandline.
strandline and were generally 3–5 feet higher in elevation than
the 1957 strandline. The Flood of 1983 (97,000 ft3/s)
The Floods of 1957 (125,000 ft3/s) and 1958 The 97,000 ft3/s flood of 1983 is the post-dam flood of
(108,000 ft3/s) record of the Colorado River downstream of Glen Canyon Dam.
Peak-stage indicators associated with the 1983 flood account
The 125,000 ft3/s flood of 1957 and the 108,000 ft3/s for 23.4 percent of all peak-stage indicators surveyed among
flood of 1958 were the last two large floods that occurred in the five primary strandlines (table 1; Sabol and others, 2021).
170,000 ft3/s
108,00
0 ft 3/s 125,000 ft3/s
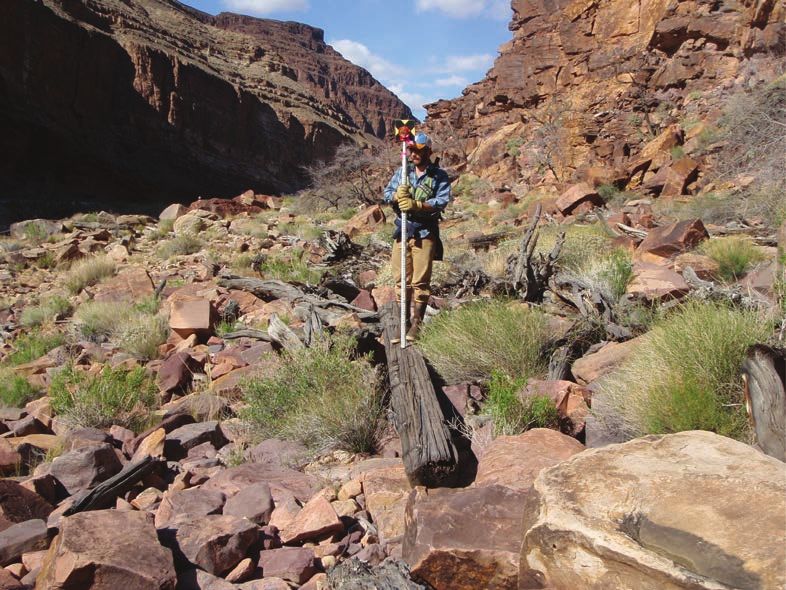
Figure 7. Photograph showing the likely strandlines from 1958, 1957, and 1921. This photograph
was taken on the left bank of the Colorado River looking upstream between river miles 76.0 and 76.3.
Surveyor is standing on a large structural 12 by 12 inch beam that was likely emplaced by the 1958
flood (highlighted by the orange line). Driftwood strandlines from the likely 1957 (yellow line) and
1921 (green line) floods are at progressively higher elevations to the surveyor’s left (to the right in the
photograph). Peak flood discharge is given in cubic feet per second (ft3/s).Results 11
Longitudinal Profiles and Slopes of Strandlines of peak-stage indicators and river morphology (fig. 9, table 2).
Peak-stage indicators likely from the 125,000 ft3/s flood of
Longitudinal profiles were developed for the 8,000 ft3/s 1957 and the 97,000 ft3/s flood of 1983 are present in all of
reference stage, and the five primary strandlines constructed the shorter profiles. 95 percent of the shorter profiles contain
from the surveyed peak-stage indicators over RM 0 through peak-stage indicators likely from the 108,000 ft3/s flood of
87 (fig. 8). Longitudinal profiles were also generated for 1958, 85 percent of the shorter profiles contain peak-stage
shorter reaches, including slopes calculated, at 20 locations indicators likely from the 170,000 ft3/s flood of 1921, and only
throughout the study area. The shorter profiles ranged from 35 percent of the shorter profiles contain peak-stage indicators
0.1 mile to several miles in length, depending on the density likely from the from the 210,000 ft3/s flood of 1884.
3,200
3,100 2,560
2,540
2,520
3,000
2,500
2,480
b
2,900 2,460
2,440
Elevation, in feet
2,420
80 82 84 86 88 90
2,800
3,150
3,140 a
3,130
2,700
3,120
3,110
3,100
2,600 3,090
3,080
3,070
3,060
2,500 3,050
−1 0 1 2 3 4 5 6 7 8 9
2,400
0 10 20 30 40 50 60 70 80 90 100
Centerline distance from Lees Ferry gage, in miles
EXPLANATION
Peak-stage indicator, 210,000 ft3/s Peak-stage indicator, 97,000 ft3/s
Peak-stage indicator, 170,000 ft3/s Peak-stage indicator, 52,500 ft3/s
Peak-stage indicator, 125,000 ft3/s Peak-stage indicator, 45,000 ft3/s
Peak-stage indicator, 108,000 ft3/s 8,000 ft3/s water-surface elevation
a Data from Topping and others (2003) and U.S. Geological Survey gaging station
USGS 09380000 Colorado River at Lees Ferry, Arizona
b Data from Topping and others (2003) and U.S. Geological Survey gaging station
USGS 09402500 Colorado River near Grand Canyon, Arizona
Figure 8. Longitudinal profiles of the 8,000 cubic feet per second (ft3/s) reference stage and surveyed peak-stage indicators segregated
into the five primary strandlines from the 210,000 ft3/s—1884, 170,000 ft3/s—1921, 125,000 ft3/s—1957, 108,000 ft3/s—1958, and 97,000
ft3/s—1983 floods, and also segregated into the strandlines from the 52,500 ft3/s—1986, and 45,000 ft3/s—1996–2012 floods. Also shown
(in the ovals in the expanded-scale boxes) for comparison are the peak stages of these floods from the stage-discharge relations at the
Colorado River at Lees Ferry, Arizona, 09380000 and the Colorado River near Grand Canyon, Ariz., 09402500 gaging stations.12 Strandlines from Large Floods on the Colorado River in Grand Canyon National Park, Arizona
3,120 3,040
A. River mile 11.4–11.7, below Soap Creek Rapid 3,030
B. River mile 20.7–26.5, Supai and Redwall Gorge
3,110
3,020
3,010
3,100
3,000
3,090 2,990
Elevation, in feet
2,980
3,080 2,970
2,960
3,070
2,950
2,940
3,060
2,930
3,050 2,920
2,910
3,040 2,900
11.4 11.45 11.5 11.55 11.6 11.65 11.7 20 21 22 23 24 25 26 27
2,865 2,720
2,860 C. River mile 46.0–50.2, above Fifty Mile D. River mile 66.0–66.4, Palisades
2,715
2,855
2,850
2,710
2,845
2,840 2,705
Elevation, in feet
2,835
2,830 2,700
2,825
2,695
2,820
2,815
2,690
2,810
2,805 2,685
2,800
2,795 2,680
45 46 47 48 49 50 51 65.9 66 66.1 66.2 66.3 66.4
Centerline distance from Lees Ferry gage, in miles
EXPLANATION
Peak-stage indicator, 210,000 ft3/s
Peak-stage indicator, 170,000 ft3/s
Peak-stage indicator, 125,000 ft3/s
Peak-stage indicator, 108,000 ft3/s
Peak-stage indicator, 97,000 ft3/s
Peak-stage indicator, 52,500 ft3/s
Peak-stage indicator, 45,000 ft3/s
8,000 ft3/s water-surface elevation
Figure 9. Longitudinal profiles of strandlines in four shorter reaches (A-D) showing linear regressions. Peak-stage indicators are
segregated into the same five primary strandlines, two lesser strandlines, and the 8,000 cubic feet per second (ft3/s) reference stage
depicted in figure 8. Table 3 presents the full list of slopes generated from longitudinal profiles regressed in the shorter reaches.
Profiles in A and D slope up-canyon because the strandlines were deposited upstream from the reattachment point in lateral
recirculation eddies, where the water near the bank was flowing in the up-canyon direction. Elevations are orthometric elevations.
men20-3155_fig09Results 13
Table 2. Calculated strandline slopes for selected reaches of the Colorado River in Grand Canyon National Park, Arizona.
[Assigned years of floods are shown in the header above the discharges associated with each strandline. Negative slopes slope in the down-canyon direction.
River reaches are indicated by river mile. Abbreviations: ft3/s, cubic feet per second; —, insufficient data for analysis, 2 or fewer data points]
1884, 1921,
River River 1957, 1958, 1983, 1986, 1996, 2012,
Reach name 210,000 170,000
reach start reach end 125,000 ft3/s 108,000 ft3/s 97,000 ft3/s 52,500 ft3/s 45,000 ft3/s 8,000 ft3/s
ft3/s ft3/s
River mile 3.3 to
3.30 7.90 — — −0.0002a −0.0003a −0.0004 — — −0.0001
Badger
8.00 8.20 Below Badger — −0.0074 0 — −0.0081 0.0012 −0.0035 −0.0073
11.40 11.60 Below Soap Creek 0.015 0.0092 0.008 0.0087 0.0041 0.0029 0.0068 −0.0081
Supai and Redwall
20.75 26.50 −0.0027 −0.0026 −0.0023 −0.0031 −0.0023 −0.0022 −0.0017 −0.0023
Gorge
30.00 33.00 Redwall Gorge — −0.0010 −0.0010 −0.0008a −0.0009 — −0.0027 −0.0011
Above Eminance to
43.40 45.80 — −0.0014 −0.0017 −0.0014 −0.0013 — −0.0007 −0.0016
Willy Taylor
Lower Marble
46.00 50.20 −0.0004 −0.0006 −0.0008 −0.0008 −0.0008 — −0.0009 −0.0007
Canyon
Lower Marble
51.00 52.30 Canyon to above 0.003 — −0.0012 −0.0015a −0.0015 — — −0.0006
Little Nankoweap
52.30 54.00 Nankoweap −0.0035a −0.0028a −0.0025a −0.0025 −0.0028 — −0.0100 −0.0027
Lower Marble
Canyon to above
58.40 61.50 — −0.0007 −0.0006 −0.0007 −0.0009 0.0003 −0.0009 −0.0010
Little Colorado
River
Little Colorado River
62.00 66.00 — −0.0011 −0.0011 −0.0014 −0.0011 — −0.0015 −0.0013
to Lava Chuar
66.00 66.40 Palisades 0.0004 0.0007 0.0008 0.0011 0.0004 — — −0.0005
Below Palisades to
66.50 69.00 — −0.0012 −0.0020 −0.0021 −0.0020 — −0.0018 −0.0016
Tanner
69.00 69.80 Below Tanner — −0.0002 0.0003 −0.0006 −0.0017 — — −0.0024
70.00 71.00 Below Basalt — −0.0033 −0.0031 −0.0033 −0.0018 — −0.0028 −0.0023
72.00 72.90 Above Unkar — −0.0045 a
−0.0001 −0.0001 a
0.0014 0 0.0034 −0.0004
73.80 75.70 Below Unkar −0.0010 −0.0012 −0.0009 −0.0008 −0.0008 — — −0.0004
75.80 76.15 Nevills − upper — −0.0030 −0.0012 −0.0023 −0.0023 — — −0.0060
76.20 76.30 Nevills − lower — −0.0001 0.0014 0.0094 0.0039 — 0.0031 −0.0032
77.30 77.60 Hance — — −0.0061a −0.0007a −0.0007 — — −0.0054
a
Slope generated with only 1 data point on either the upstream or downstream end of the profile line.14 Strandlines from Large Floods on the Colorado River in Grand Canyon National Park, Arizona
Stage-Discharge Relations The stage-discharge curves generated in this study for each
site are only valid for the range in discharge for which strand-
Stage-discharge relations were empirically developed at lines were identified at that site (table 3) and should not be
fifty locations where the density of peak-stage-indicator data extrapolated above the maximum discharge reported in table 3.
was sufficient to form multiple distinct strandlines across a
wide range in stage (table 3) (Rantz and others, 1982). Stage- Strandline Elevations Relative to a Local Datum
discharge relations were generated by fitting a 2nd order
polynomial to the stages of the strandlines associated with Strandline elevations relative to a local datum, that is,
each peak discharge and also to the known reference stage the 8,000 ft3/s reference stage, were calculated for ten river
associated with a discharge of 8,000 ft3/s. The equation for the reaches (table 4). River reaches were modified from those
stage-discharge relation at a particular site is: in Schmidt and Graf (1990) to minimize the effect of rapids
on these elevation relations. To evaluate how the strandline
Q = 8, 000 + C1Z + C2 Z 2 (1) elevations compared with the stages measured at gaging
where stations (table 4), the peak stages of the 1884, 1921, 1957,
Q is the discharge in ft3/s; 1958, 1983, 1986 floods and 1996–2012 HFEs relative to the
Z is the stage in feet above the 8,000 ft3/s 8,000 ft3/s reference stage were also calculated at the Colorado
reference stage relative to the NAVD88 River at Lees Ferry, Ariz., and the Colorado River near Grand
orthometric elevation; and Canyon, Ariz. gaging stations.
C1 and C2 are coefficients.
Table 3. Stage-discharge relations developed for short reaches from surveyed peak-stage indicators and the orthometric elevation of
the 8,000 cubic feet per second reference stage.
[The short reaches begin and end at the river miles indicated. Shown for comparison are the stage-discharge relations at the Colorado River at Lees Ferry,
Arizona (river mile 0), and the Colorado River near Grand Canyon, Ariz., gaging stations (river mile 87). R2 is the coefficient of determination, C1 and C2 are
coefficients defined by equation 1 in the main text (Q = 8,000 + C1Z + C2Z2) where Q is the discharge in cubic feet per second (ft3/s), and Z is the stage in feet
above the 8,000 ft3/s reference stage]
Orthometric elevation Maximum
River mile:
River mile: end (in feet) of 8,000 ft3/s C1 C2 R2 Sample size discharge
start
reference stage (in ft3/s)
0.00 0.00 3,118.35a 10,835.438a −63.937a 0.996a 8a 210,000
3.55 4.13 3,091.30 2,234.178 99.151 0.966 11 170,000
6.14 6.24 3,089.03 6,284.147 −72.942 0.982 13 125,000
8.08 8.12 3,073.31 3,805.154 59.968 0.955 23 210,000
11.43 11.46 3,051.60 2,008.758 59.539 0.978 9 210,000
11.59 11.64 3,044.36 1,796.164 23.933 0.923 35 210,000
20.80 20.88 2,979.85 1,755.459 49.206 0.969 28 170,000
23.33 23.33 2,953.72 −151.794 107.829 0.996 5 210,000
23.50 23.50 2,950.64 639.514 95.816 0.951 9 210,000
24.64 24.68 2,942.80 −30.114 175.721 0.967 10 210,000
24.76 24.83 2,934.68 4,092.674 27.830 0.942 11 210,000
26.02 26.06 2,912.22 −1,003.073 115.941 0.969 11 210,000
32.19 32.23 2,874.23 3,159.255 39.146 0.936 10 210,000
32.36 32.37 2,871.25 1,281.588 70.762 0.986 9 210,000
43.48 43.58 2,830.82 2,079.487 96.739 0.889 26 170,000
44.00 44.15 2,823.72 2,708.868 65.143 0.953 31 210,000Stage-Discharge Relations 15
Table 3. Continued.
Orthometric elevation Maximum
River mile:
River mile: end (in feet) of 8,000 ft3/s C1 C2 R2 Sample size discharge
start
reference stage (in ft3/s)
44.32 44.62 2,821.65 2,464.688 90.357 0.948 27 170,000
47.25 47.41 2,813.42 5,499.964 −50.987 0.968 16 125,000
47.79 47.93 2,811.01 −1,602.362 242.570 0.967 17 210,000
50.02 50.14 2,800.04 334.334 137.661 0.968 13 125,000
51.25 51.30 2,798.08 3,603.452 27.923 0.965 6 125,000
52.11 52.24 2,795.79 5,898.295 −18.824 0.965 18 210,000
52.34 52.44 2,794.04 3,247.414 75.462 0.973 16 210,000
53.89 53.92 2,771.87 1,043.448 156.365 0.969 13 210,000
54.23 54.26 2,768.00 3,690.464 29.676 0.994 6 125,000
57.66 57.81 2,743.01 2,371.511 131.726 0.958 16 210,000
61.00 61.04 2,719.75 2,839.573 34.728 0.890 15 170,000
63.93 64.02 2,697.26 2,720.551 63.517 0.978 7 170,000
66.01 66.04 2,684.17 5,181.460 227.297 0.978 18 210,000
66.12 66.15 2,684.11 2,574.063 391.033 0.987 18 210,000
66.24 66.29 2,683.66 5,068.983 199.082 0.931 30 210,000
66.61 66.76 2,675.39 3,077.604 184.345 0.937 28 170,000
66.95 67.17 2,671.20 −862.133 310.205 0.902 51 170,000
68.16 68.29 2,659.55 5845.716 27.220 0.975 26 170,000
68.29 68.83 2,659.46 2,188.452 277.246 0.949 66 170,000
68.79 68.98 2,658.38 9,744.164 −138.811 0.964 26 170,000
69.13 69.63 2,646.57 482.550 541.693 0.830 84 170,000
70.11 70.13 2,638.07 −132.687 376.223 0.969 16 170,000
70.36 70.44 2,634.61 529.940 368.486 0.988 23 170,000
73.60 73.63 2,600.03 4,903.176 111.071 0.984 13 125,000
73.91 73.99 2,591.56 2,230.443 113.198 0.962 80 210,000
75.58 75.62 2,586.82 1,497.535 209.002 0.959 20 170,000
75.83 75.90 2,580.74 6,215.885 60.705 0.977 27 170,000
75.94 75.95 2,576.97 2,903.370 158.895 0.996 6 170,000
76.06 76.09 2,573.54 3,724.463 77.514 0.983 21 125,000
76.20 76.26 2,571.67 895.831 166.103 0.837 45 170,000
77.41 77.44 2,550.66 2,006.556 161.117 0.998 6 125,000
82.51 82.51 2,473.87 1,534.112 48.403 0.984 4 210,000
83.42 83.43 2,467.90 1,180.954 121.558 0.999 5 210,000
87.00 87.00 2,431.03 b
1,188.925b 172.684 b
0.998 b
8b
210,000
a
Data from Topping and others (2003) and U.S. Geological Survey gaging station USGS 09380000 Colorado River at Lees Ferry, Arizona.
b
Data from Topping and others (2003) and U.S. Geological Survey gaging station USGS 09402500 Colorado River near Grand Canyon, Arizona.You can also read