Strategic context Draft long term plan 2018-38 Consultation - supporting information - Kapiti Coast District Council
←
→
Page content transcription
If your browser does not render page correctly, please read the page content below
Draft long term plan 2018-38
       Consultation - supporting information

Strategic context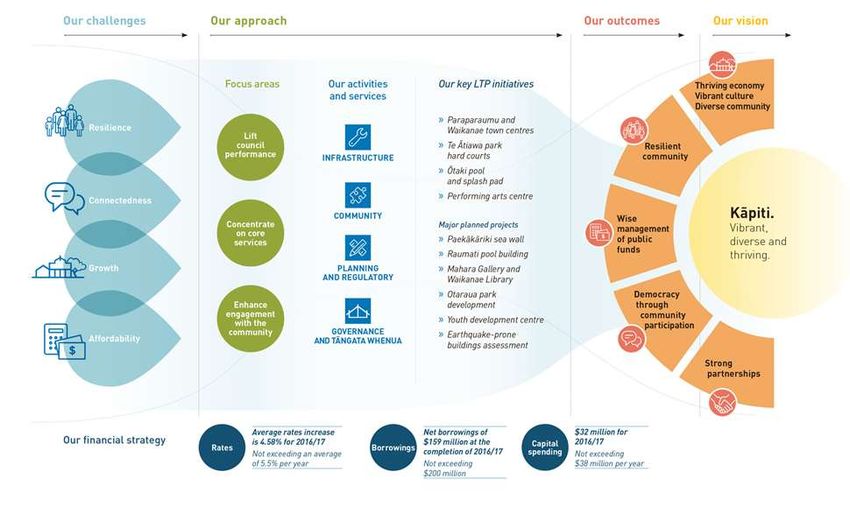
Contents
Legislative environment .................................................................................................................................... 5
   Roles and responsibilities of local authorities ............................................................................................... 5
       Local Government Act 2002 ...................................................................................................................... 5
       Resource Management Act 1991 .............................................................................................................. 6
       Treaty of Waitangi ..................................................................................................................................... 8
       Land Transport Management Act 2003 ..................................................................................................... 8
       Other laws ................................................................................................................................................. 9
   Relationship between a territorial authority and a regional council ............................................................ 9
   Council planning .......................................................................................................................................... 10
External factors................................................................................................................................................ 12
   Demographic changes and urbanisation ..................................................................................................... 12
   Rapid technology change ............................................................................................................................ 13
       Mobile technology, wearable technology and cloud computing ............................................................ 13
       Big data and the Internet of Things (IoT)................................................................................................. 14
       Transport ................................................................................................................................................. 14
       Automation .............................................................................................................................................. 14
       Renewable energy and distributed generation ....................................................................................... 15
   Affordability ................................................................................................................................................. 15
       Cost of living ............................................................................................................................................ 15
       Other factors influencing housing affordability ...................................................................................... 16
   Pressures on the natural environment........................................................................................................ 18
       Climate change ........................................................................................................................................ 19
   Emergency resilience ................................................................................................................................... 20
       Roles and responsibilities ........................................................................................................................ 21
       New Zealand’s current preparedness...................................................................................................... 21
       Earthquake and tsunami preparedness .................................................................................................. 22
       Significant tsunami risk ............................................................................................................................ 22
       Earthquake planning................................................................................................................................ 22
   Economic prosperity .................................................................................................................................... 23
       National economic outlook ..................................................................................................................... 23
       Growth within the New Zealand economy.............................................................................................. 23

                                                                                                                                                      2|P a g e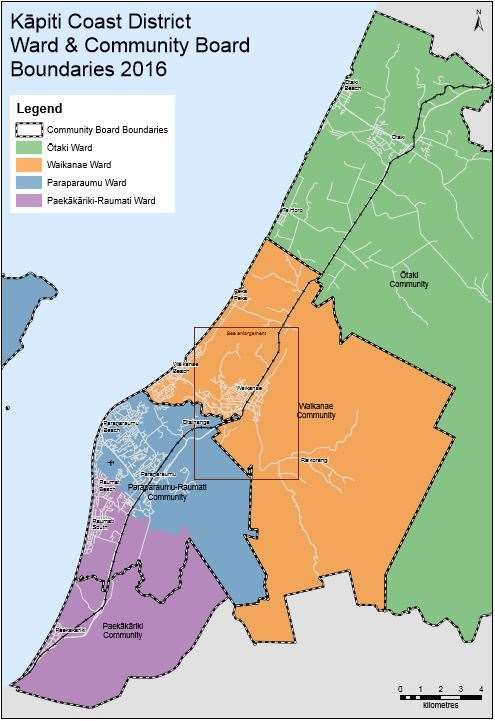
Employment growth ................................................................................................................................ 26
Initiatives relevant to the Wellington Region.......................................................................................... 27
Our partnership with iwi ................................................................................................................................. 29
Our iwi landscape ........................................................................................................................................ 29
Te Āti Awa ki Whakarongotai .................................................................................................................. 29
Ngāti Raukawa ki te Tonga ...................................................................................................................... 29
Ngāti Toa Rangatira ................................................................................................................................. 30
ART Confederation .................................................................................................................................. 30
Iwi partnership ............................................................................................................................................ 30
Memorandum of partnership .................................................................................................................. 30
Underpinning our partnership..................................................................................................................... 31
Māori demographics within Kāpiti .............................................................................................................. 33
District overview .............................................................................................................................................. 34
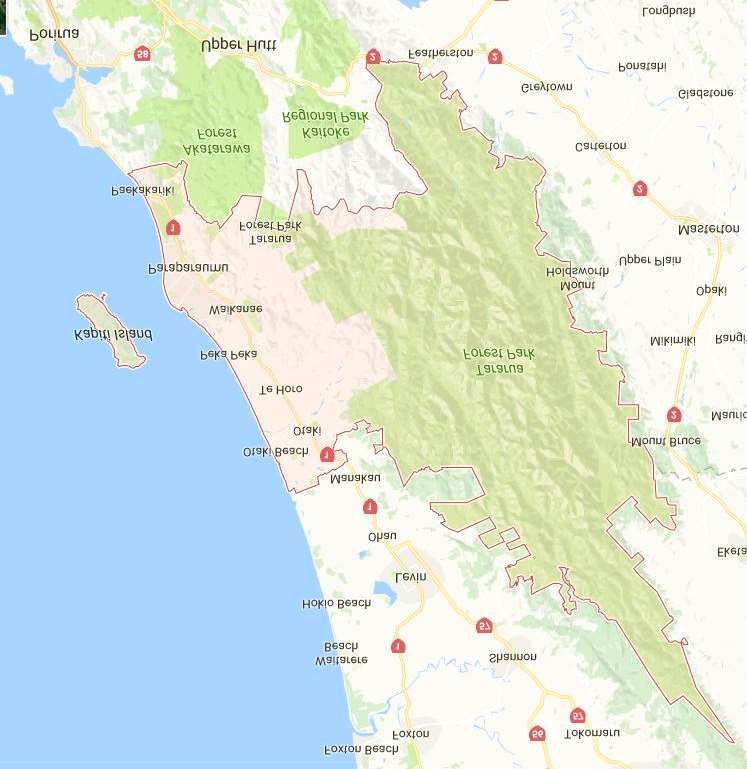
Our geographic location and natural environment ..................................................................................... 34
Our geographic location .......................................................................................................................... 34
Our natural environment ........................................................................................................................ 35
Our history ................................................................................................................................................... 36
Early settlement ...................................................................................................................................... 36
Māori and European historical influences ............................................................................................... 36
1950s to today ......................................................................................................................................... 37
Our people ................................................................................................................................................... 37
Age ........................................................................................................................................................... 39
Ethnicity ................................................................................................................................................... 41
Education ................................................................................................................................................. 42
Our homes ................................................................................................................................................... 43
Housing .................................................................................................................................................... 44
Deprivation .............................................................................................................................................. 49
Migration ................................................................................................................................................. 50
Our economy ............................................................................................................................................... 51
Employment ............................................................................................................................................ 52
Income (from all sources) ........................................................................................................................ 58
Our boundaries ............................................................................................................................................ 64
District health boards .............................................................................................................................. 64
Police districts .......................................................................................................................................... 66
3|P a g e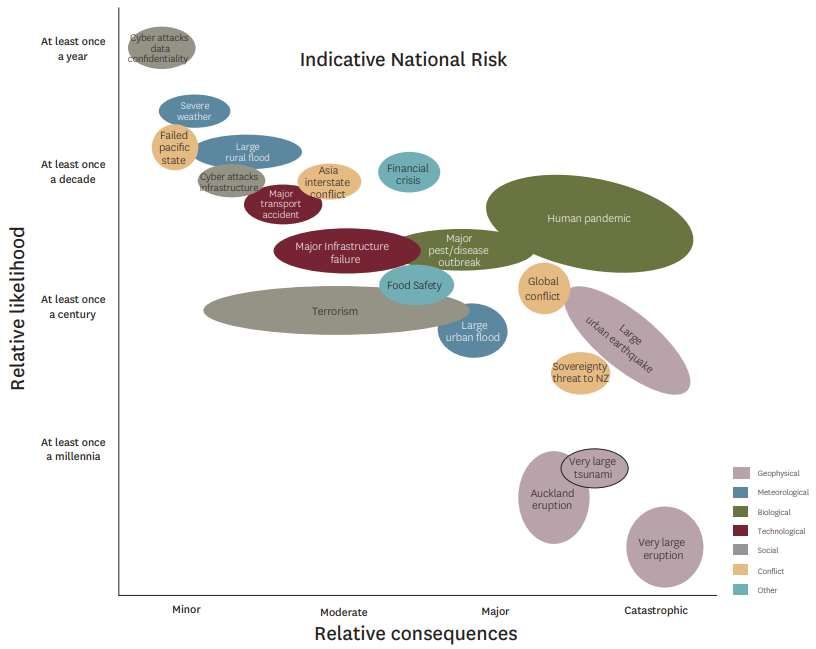
Work and Income regions ....................................................................................................................... 66
       Māori electorate seats............................................................................................................................. 66
       General electorates ................................................................................................................................. 66
       Ward and community board boundaries ................................................................................................ 67
       Iwi boundaries ......................................................................................................................................... 67
Council’s current operations ........................................................................................................................... 69
   Kāpiti within the Wellington Region............................................................................................................ 69
       Greater Wellington Regional Council ...................................................................................................... 70
       Strengthening the Wellington Region ..................................................................................................... 70
       Key regional relationships and forums .................................................................................................... 71
   Our community values ................................................................................................................................ 71
       Local Community Futures Statements (Local outcomes) ........................................................................ 71
       Resident opinion surveys......................................................................................................................... 72
       Other ways of understanding what our community values .................................................................... 72
   Our vision for our future – vibrant, diverse and thriving ............................................................................ 72
       Council outcomes .................................................................................................................................... 72
   Current service provision............................................................................................................................. 74
       Infrastructure........................................................................................................................................... 74
       Community services ................................................................................................................................ 74
       Planning and regulatory services............................................................................................................. 74
       Governance and tāngata whenua ........................................................................................................... 74
   Our financial position .................................................................................................................................. 75
       Our financial strategy .............................................................................................................................. 75
District challenges and opportunities.............................................................................................................. 77
   Changing demographics .............................................................................................................................. 77
   Affordability ................................................................................................................................................. 77
   Transport ..................................................................................................................................................... 78
   Place in the region ....................................................................................................................................... 79
   Crossing boundaries .................................................................................................................................... 79
   Natural environment ................................................................................................................................... 81
   Distinct communities ................................................................................................................................... 81

                                                                                                                                                      4|P a g e
Legislative environment
There are 78 local authorities in New Zealand – 11 regional councils and 67 territorial authorities (11 city
councils, 50 district councils and 6 unitary authorities).

Roles and responsibilities of local authorities
There are several pieces of central government legislation that establish the roles and responsibilities of
local authorities, while also shaping the environment in which they operate and setting restrictions on their
activities.1

The Local Government Act 2002 (LGA), the Resource Management Act 1991 (RMA), the Treaty of Waitangi,
and the Land Transport Management Act 2003 have some of the most significant effects on local authority
operations and strategy; however, there are many more pieces of legislation and policies that local
authorities must take into account.

Local Government Act 2002
Section 10 of the LGA states that the purpose of local government is:
    a) to enable democratic local decision-making and action by, and on behalf of, communities; and
    b) to meet the current and future needs of communities for good-quality local infrastructure, local
        public services, and performance of regulatory functions in a way that is most cost-effective for
        households and businesses.

Local authorities – city councils, district councils and regional councils – do this by performing their duties
as stipulated under the LGA. Section 11 of the LGA states that the core services that local authorities must
consider when they are carrying out their role include:
    a) network infrastructure;
    b) public transport services;
    c) solid waste collection and disposal;
    d) the avoidance or mitigation of natural hazards; and
    e) libraries, museums, reserves, recreational facilities and other community infrastructure.

The LGA also provides for local authorities to play a broad role in the performance of regulatory functions,
such as resource and building consents, and local authorities have the ability to make bylaws to protect the
public from nuisance; to protect, promote and maintain public health and safety; and to minimise the
potential for offensive behaviour in public places.

The Local Government Commission2 is an independent statutory body established under the LGA, whose
main task is to make decisions on the structure of local government, for example they make decisions on
reorganisation of local authorities, representation reviews and other council structure changes.

1
  Unless stated otherwise, all information in this chapter on the legislative environment and the roles and
responsibilities of local councils is drawn from Local Government New Zealand’s Elected members’ governance
handbook (2016), Local Government New Zealand’s Journalists’ guide to local government (2016), the Department of
Internal Affairs’ Local councils website (localcouncils.govt.nz), and the Ministry for the Environment’s resources on the
RMA and national policy statements.
2
  Local Government Commission. lgc.govt.nz

                                                                                                              5|P a g e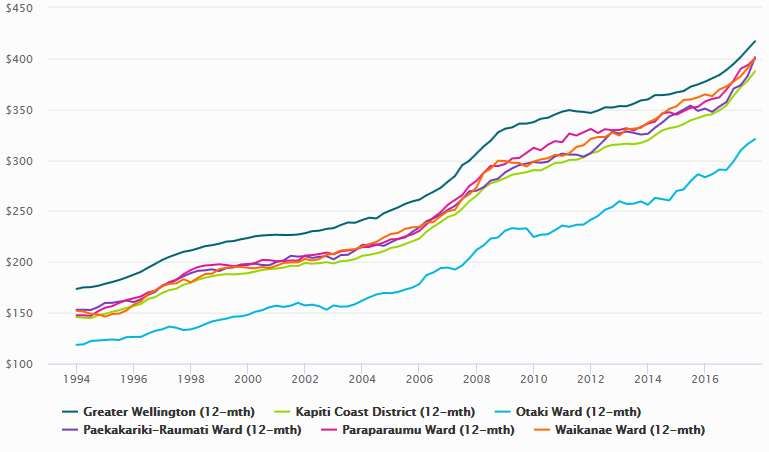
Changes to the Local Government Act 2002
The roles and responsibilities of local authorities can change in accordance with central government
requirements.
Through the 2012 and 2014 Local Government Amendment Acts, the Government began to carry out a
suite of changes aimed at improving the efficiency and effectiveness of local government. For example,
these amendments include making changes to the purpose of local government and establishing financial
prudence benchmarks3 as well as setting a new requirement under section 17A for local authorities to
regularly review service delivery models, asset management arrangements, and regulatory functions.4
A third Local Government Act Amendment Bill (Number Two) was put before Parliament in 2016, but was
not passed before the 2017 General Election. It is anticipated that the Local Government Act Amendment
Bill (Number Two) will be reintroduced to Parliament in 2018, but it could be considerably different under
the new government and may contain some reversals to the changes that were made in the 2012 and 2014
amendments.
Resource Management Act 1991
The RMA describes how New Zealand’s environment will be managed, in order to sustain New Zealand’s
natural and physical resources. Section 30 of the RMA outlines the functions, powers and duties of regional
councils, while section 31 outlines the functions, powers and duties of territorial authorities.
According to section 31, every territorial authority shall give effect to:
the establishment, implementation, and review of objectives, policies, and methods to achieve
integrated management of the effects of the use, development, or protection of land and
associated natural and physical resources of the district;
the establishment, implementation, and review of objectives, policies, and methods to ensure that
there is sufficient development capacity in respect of housing and business land to meet the
expected demands of the district;
the control of any actual or potential effects of the use, development, or protection of land,
including for the purpose of:
o the avoidance or mitigation of natural hazards;
o the prevention or mitigation of any adverse effects of the development, subdivision, or use
of contaminated land; and
o the maintenance of indigenous biological diversity;
the control of the emission of noise and the mitigation of the effects of noise;
the control of any actual or potential effects of activities in relation to the surface of water in rivers
and lakes; and
any other functions specified in the RMA.
The RMA provides local authorities with the necessary powers to manage their plans and establish resource
consenting processes.
3
Department of Internal Affairs. Factsheets for the 2012 Amendment Act. dia.govt.nz/Fact-sheets-for-2012-Act
4
Section 17A Delivery of services. legislation.govt.nz/act/public/2002/0084/latest/DLM6236168.html
6|P a g e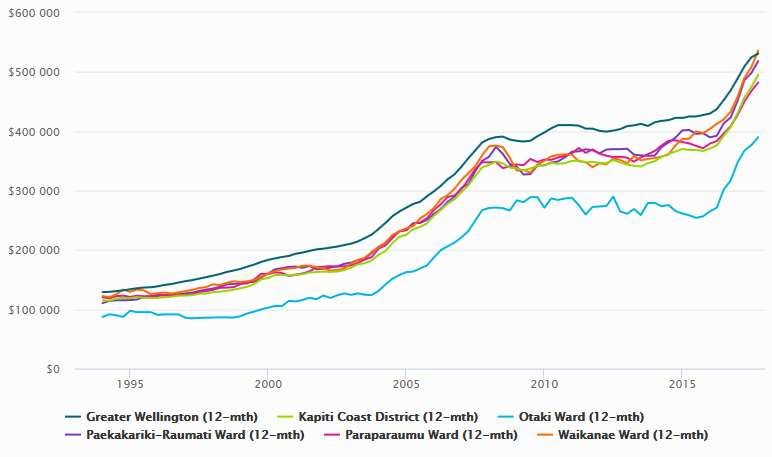
Changes to the Resource Management Act 1991
Several amendments have been made to the RMA in recent times. In 2009, reforms changed the resource
consent process and created a system to speed up nationally significant consent applications.
Further amendments were made to the RMA in 2013 to ensure the resource consent process could deliver
community planning needs, enable growth, and provide strong environmental outcomes in a timely and
cost-effective way. A six-month time limit was also put in place for processing consents for medium-sized
projects and there are now stronger requirements for local authorities to base their planning decisions on
robust and thorough cost-benefit analyses.
The Resource Legislation Amendment Act 2017 introduced:
new options for how specific resources should be managed under the RMA;
revised functions for RMA decision-makers;
changes to enhance Māori participation in the resource management process;
changes to the standard process for making and changing plans and regional policy statements;
a new optional streamlined planning process;
a new optional collaborative planning process;
changes to heritage protection under the RMA; and
a host of changes and requirements related to the consenting process.
National policy statements
Any council plans prepared under the RMA must recognise national policy statements. National policy
statements are instruments issued under section 52(2) of the RMA to state objectives and policies for
matters of national significance.
New Zealand has several national policy statements, including the:
National Policy Statement on Urban Development Capacity December 20165
Provides direction on planning for urban environments under the RMA. Its purpose is to ensure
planning decisions enable the supply of housing needed to meet demand.
National Policy Statement for Freshwater Management August 20176
Sets out the objectives and policies that direct local government management of water in an
integrated and sustainable way, through set water quantity and quality limits.
National Policy Statement for Renewable Electricity Generation May 20117
Drives a consistent approach to planning for renewable electricity generation in New Zealand, gives
clear government direction on the benefits of renewable electricity generation and requires all
councils to make provision for it in their plans.
New Zealand Coastal Policy Statement December 20108
Promotes the sustainable management of natural and physical resources in relation to New
Zealand’s coastal environment.
5
mfe.govt.nz/udc
6
mfe.govt.nz/fresh-water/regulations/national-policy-statement-freshwater-management
7
mfe.govt.nz/publications/rma/nps-renewable-electricity-generation-2011
8
doc.govt.nz/about-us/science-publications/conservation-publications/marine-and-coastal/new-zealand-coastal-
policy-statement/national-implementation-plan/
7|P a g e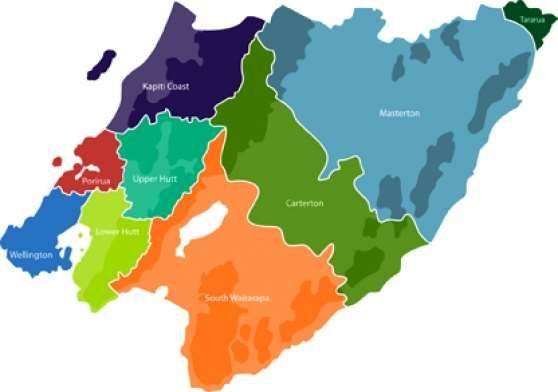
Treaty of Waitangi
The Treaty of Waitangi provides a broad statement of principles which act as a guide to establishing
meaningful relationships with tāngata whenua in a manner that ensures that tāngata whenua as kaitiaki
exercise their tikanga within the natural environment. Providing opportunities for tāngata whenua to
participate in local government is one way of applying the intentions of the Treaty.
While the responsibility for Treaty obligations lies with the Crown, Māori local government engagement
began with the reform of local government in 1989 and the passage of the RMA. The RMA devolved
environmental administration to local government, including the responsibility for involving tāngata
whenua organisations at various points in the policymaking and implementation process.
Under the RMA, councils are required to take into account the principles of the Treaty of Waitangi. This
includes duties to act reasonably and in good faith and to actively protect Māori interests. The RMA
provides directly and indirectly for tāngata whenua participation in the preparation of policy statements,
plans and decisions on resource consent applications. The RMA also enables the transfer of resource
management powers to iwi authorities and joint management agreements. In addition, recent reforms to
the RMA via the Resource Legislation Amendment Bill seek to ensure robust tāngata whenua engagement
in any resource management process through the use of formalised Mana Whakahone ā Rohe/Iwi
Participation Arrangements.
The LGA also provides principles and requirements for councils intended to facilitate consultation and
participation by Māori in local government decision-making processes. Under the LGA:
a local authority should provide opportunities for Māori to contribute to its decision-making
process; and
any significant decisions in relation to land or a body of water must take into account the
relationship of Māori and their culture and traditions with their ancestral land, water, sites, wāhi
tapu, valued flora and fauna, and other taonga.
Land Transport Management Act 2003
The Land Transport Management Act 2003 governs the planning and funding of land transport in order to
build an effective, efficient and safe land transport system.
Government Policy Statement on Land Transport
Developed as a requirement of the Land Transport Management Act, Government Policy Statements (GPS)
on Land Transport outline the Crown’s land transport strategy, priorities and desired outcomes for the
following 10 years, along with guides on how the National Land Transport Fund will be used to support
these activities.
National Land Transport Programme
The New Zealand Transport Agency then develops a National Land Transport Programme every three years,
giving effect to the Government Policy Statement on Land Transport and taking Regional Land Transport
Plans into account. The programme stipulates which activities are likely to receive funding from the
National Land Transport Fund.
Roads of national significance
Currently, there are seven roads of national significance under development throughout New Zealand. The
Wellington Northern Corridor (Levin to Wellington) – SH1 is the only one in the Greater Wellington Region.
8|P a g e
The National Land Transport Programme influences the roads of national significance projects that are
undertaken, based on available funding. These locations were selected because they were experiencing
ongoing land transport issues and, due to their close proximity to large city centres, they were determined
to be appropriate sites for new roading infrastructure.
Roads of national significance must be taken into account in the long term plans of territorial authorities,
influencing Council activities and strategy.
Regional Land Transport Plan
A Regional Land Transport Plan sets out a region’s land transport priorities and projects, to be funded or co-
funded by the National Land Transport Fund, for the following 10 years.9 The plan must include the region’s
land transport objectives, policies and measures. Regional Land Transport Plans must be consistent with
the Government Policy Statement on Land Transport, identify projects of significance, and stipulate how
the projects will be funded. Any projects that require local funding need to be incorporated into the
Council’s long term plan for approval.
Other laws
In addition to the Treaty of Waitangi, the LGA, the RMA and the Land Transport Management Act, several
other laws influence territorial authority activities, including but not limited to the:
Local Government Official Information and Meetings Act 1987;
Land Transport Act 1998;
Health (Drinking Water) Amendment Act 2007;
Waste Minimisation Act 2008;
Health and Safety at Work Act 2015;
Building Act 2004;
Reserves Act 1977;
Building (Earthquake-prone Buildings) Amendment Act 2016;
Civil Defence Emergency Act 2002; and
Local Government (Financial Reporting and Prudence) Regulations 2014.
Relationship between a territorial authority and a regional
council
Part 3 of the LGA establishes rules in relation to local authority boundaries. Most regional council
boundaries align with territorial authority boundaries, and each regional council generally encompasses
several local councils.
The relationships between regional councils and territorial authorities are formally documented in regional
triennial agreements. These triennial agreements seek to avoid duplication, strengthen relationships
between councils and ensure that the activities of each council in the region are working together to
promote the region’s best interests.
Regional councils carry out tasks that are best undertaken at a regional level, as these activities cross over
the region’s territorial authority boundaries. A regional council’s responsibilities will include activities like
environmental management, civil defence preparedness, and public transportation (
9
GWRC. 2015. Wellington Regional Land Transport Plan.
9|P a g e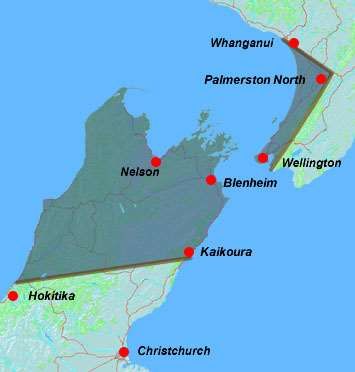
Table 1).
Table 1: Sample of regional council functions across New Zealand
Environmental protection (e.g. River and lake management, Biosecurity and pest
resource consents for including flood and drainage management
contaminant discharge) control
Coastal management Biodiversity Natural hazard management
Integrated land management Public transport Bulk water supply
Civil defence Marine regulations Port ownership
Source: Council responsibilities in the Elected Members’ Governance Handbook, 2016.
Territorial authorities are responsible for local service provision (utilities and services) and local land use
planning. Under New Zealand law, the activities undertaken by territorial authorities can differ widely
however they must have consulted with their communities in making these decisions (Table 2).
Table 2: Sample of territorial authority functions across New Zealand
Parks and open spaces Museums Drainage
Civil defence Libraries Cemeteries
Crime prevention Economic development Cultural facilities
After school care or crèches Tourism promotion Drinking water
Iwi relationships Airport ownership Wastewater
Voluntary sector grants Events Stormwater
Public health protection Sports facilities Citizens’ advisory services
Housing Business attraction Citizenship ceremonies
Community centres Coastal management Town planning
Refuse collection and disposal Local roads Local regulations
Note: The Fire and Emergency New Zealand Act 2017 transferred responsibilities for the management of lighting fires in open air
from territorial authorities to the newly established Fire and Emergency New Zealand.
Source: Council responsibilities in the Elected Members’ Governance Handbook, 2016.
Council planning
Under the LGA and RMA, councils are required to develop a suite of planning documentation10 stating their
future direction including:
regional policy statements and plans;
district plan;
long term plan;
annual plan;
annual report;
activity plans; and
asset management plans.
10
kapiticoast.govt.nz/Your-Council/Planning/
10 | P a g eThere are two national bodies, Local Government New Zealand (LGNZ)11 and New Zealand Society of Local
Government Managers (SOLGM)12, which provide guidance, support and advocacy on behalf of Local
Government. There are also a number of organisations that provide guidance and support on specific
issues, such as Water New Zealand13. The Kāpiti Coast District Council maintains relationships with these
organisations, utilises the guidance provided and participates in relevant working groups.
11
Local Government New Zealand. lgnz.co.nz
12
New Zealand Society of Local Government Managers. solgm.org.nz
13
Water New Zealand. waternz.org.nz
11 | P a g eExternal factors
External factors are described as key emerging global or national trends, strategies and concerns that may
impact on a council’s operating environment, and to which a council may choose to respond.
Demographic changes and urbanisation
The New Zealand population is ageing as a result of declining birth rates and longer life expectancies (Table
3). The average age of the New Zealand population is expected to increase from 37.1 years in 2016 to 40
years in the early 2030s. The 2013 Census determined that 14.2% of the total population was over the age
of 65, and this number is projected to increase to 20%-22% by 2032.
Table 3: National population age-sex pyramid projections
Source: Statistics NZ, Interactive population pyramid for New Zealand; Statistics NZ, National Population Projections: 2016(base)–
2068, October 2016.
In addition, the ethnic composition of New Zealand is expected to change significantly in the future, as net
migration continues to rise and birth rates among non-European ethnicities increase, such as Māori, Asian
and Pasifika (Figure 1).
Figure 1: Ethnic share of New Zealand population
Source: Statistics NZ, National Ethnic Population Projections: 2013(base)–2038 (update) [Media Release 18 May 2017].
12 | P a g eIn the future, it is projected that New Zealanders will predominately reside in cities, which could lead to an
increasing population in surrounding areas as well because some people may be unable to afford the cost
of living in the city centres. Young people are also likely to reside in cities, contributing to a higher birth rate
in these areas.14 Meanwhile, rural communities and small towns across the country are projected to
experience declining populations.15
Implications
Changing demographics will put pressure on councils to provide services and infrastructure that cater to
the changing needs of their communities. This economic pressure of providing these services will be
more pronounced in rural areas, where the median age of the population is older than in urban areas.16
Rapid technology change
Technological change is a constant feature of life in the twenty-first century and the change is gathering
pace. New technologies can present both challenges and opportunities for local authorities. On the one
hand, new technological developments can help councils be more efficient and effective; on the other
hand, new technological developments may increase demands on councils to monitor the use of new
technologies to ensure safety.
A 2015 report by the New Zealand Society of Local Government Managers (SOLGM) and the Association of
Local Government Information Management (ALGIM) considered the impact of 10 developing and evolving
disruptive emergent technologies on local authorities in the future.17 The emergent technologies that are
likely to be the most relevant for Kāpiti Coast District Council are:
Mobile technology, wearable technology and cloud computing
Mobile devices are computers that can be transported while in use, enabling people to have instant access
to information and tools in a variety of locations (e.g. smartphones). Wearable technology refers to
computing devices comfortably worn on the body, such as body cameras, or even incorporated into it, and
tends to be more sophisticated than hand-held technology. Cloud computing means storing and accessing
data and programs over the internet instead of via your computer’s hard drive.
Opportunities
People will be able to work effectively anywhere – provided New Zealand’s communication network
coverage and capacity are sufficient. The national rollout of high-speed broadband is supporting this
change. New options for employers can range from open plan office spaces to opportunities for
employees to work remotely from home on occasion, or even permanently.
While mobile technology, wearable technology and cloud computing provide opportunities for
improved local government services, councils may experience financial pressures to expand their
investments in these areas.
14
LGNZ. July 2016. The 2050 challenge: future proofing our communities.
15
Ibid.
16
Ibid.
17
SOLGM and ALGIM. 2015. Fit for the digital future. solgm.org.nz/Category?Action=View&Category_id=1180
13 | P a g eBig data and the Internet of Things (IoT)
Big data is a term that describes the large volume of data that comes into a business in their usual
operations.18 It has three key characteristics – volume, velocity and variety. The Internet of Things (IoT) is
the “internetworking of physical devices, vehicles (also referred to as “connected devices” and “smart
devices”), buildings, and other items – embedded with electronics, software, sensors, actuators, and
network connectivity that enable these objects to collect and exchange data without human
intervention”.19
Opportunities
The importance and potential of big data are not in the amount of data that is sourced, but in how
organisations turn this into meaningful information. Local governments could leverage this across their
services to analyse relationships, support decision-making or present data in creative and compelling
ways, provided the skills and capabilities are available.
IoT applications can deliver ‘real time’ data continuously with much lower reliance on site visits, and can
be used anywhere that relies on the monitoring of data. For local government, this technology provides
opportunities in asset management, demand management and regulatory applications.
The IoT is often closely linked to ‘big data’. The sheer volume of data generated can, if mined properly,
gain far deeper and richer insights into the state of the environment, or the way people use a service.
Transport
Technology and emerging innovations have been recognised by the Ministry of Transport as one factor
influencing the transport sector.20 This includes the potential for unmanned aerial vehicles (commonly
known as drones) and new energy technologies for vehicles.
Opportunities
Drones have the potential for wide application by councils. They could be used anywhere that aerial
photography (either still or moving) could be applied. This includes functions such as infrastructure
assessments. Electric vehicles are able to draw wholly or partly on electrical energy for motive power as
opposed to internal combustion (i.e. petrol or diesel). The obvious opportunities for adoption of electric
vehicle technology lie in reducing the use of fossil fuels. Mass adoption of electric vehicles would be a
significant step towards New Zealand meeting greenhouse gas targets.
Automation
Automation and mechanisation are the replacement of human labour with machine labour. Local
Government New Zealand’s (LGNZ’s) 2050 Challenge paper clearly articulates the challenges and
opportunities for local government from increased automation.21
Implications
Automation is important to local authorities as any increased automation within a local authority itself
could impact current staff and jobs, but it could also influence employment in the local authority’s
18
SAS. “Big data – what it is, and why it matters”. sas.com/en_us/insights/big-data/what-is-big-data.html
19
linux.com/news/who-needs-internet-things
20
Ministry of Transport. 2014. Future demand summary report; Henderson W. 2015. Navigating the regulatory
interface between transport and land use.
21
LGNZ. July 2016. The 2050 challenge: future proofing our communities, p26.
14 | P a g eregion so some local authorities may work alongside local business associations and education
institutions to ensure sufficient opportunities within the region for labour force (re)training and
development.
Renewable energy and distributed generation
Renewable energy is the production of energy, or electricity, using a source in such a way that the source is
not destroyed in the process (e.g. hydroelectricity), or where the source can be replaced (e.g. biomass).
While New Zealand already has substantial power generation using renewable sources, other options for
renewable energy are emerging, including marine-based generation and biomass.22 Distributed generation
is a complementary and emergent technology where electrical energy is generated at the point of
consumption.
Opportunities
Peak oil, and possibly volatile energy prices associated with peak oil, may affect councils by increasing
energy costs and making transport more expensive and difficult. Renewable energy and distributed
generation/storage could provide an affordable alternative for councils and further reduce New
Zealand’s reliance on fossil fuels as an energy source.
Affordability
Affordability is a significant concern for councils owing to their role in managing land use and capacity, the
impact of increased prices on the standard of living in their communities, and the impact of this on rate
setting.
Cost of living
New Zealanders have experienced numerous cost of living increases in recent decades and this trend is
likely to continue.
The proportion of household income spent on housing costs has been increasing since 2007.23 As an
example, although household incomes increased by 2.1% from 2015 to 2016, household costs increased by
10.7% over the same period.24 These increases in household costs were primarily due to increases in the
cost of housing (buying or renting) and increases in the costs of other goods and services, such as food,
utilities and transportation.
Significant increase in the cost of houses
New Zealand house prices rose markedly between 2001 and 2007, with residential housing values nearly
doubling over this period. In 2008, the global financial crisis led to a downturn in the New Zealand property
market; however, the market soon recovered and since 2012, house values have continued to increase.
Adjusted for inflation, residential housing values in January 2017 were 28.5% above the peak prices New
Zealand experienced in 2007.25
22
Ibid., p26.
23
Statistics NZ. Household economic survey (income): year ended June 2016.
24
Ibid.
25
QV. January 2017. Property values drop in parts of NZ as the LVR takes effect.
15 | P a g eNationally, residential property values increased by 12.5% during 2016, but the level of growth varied
between regions.26 Wellington, Nelson/Marlborough and Waikato/Bay of Plenty experienced the greatest
average price increases, to record new levels.27 The average price of a Wellington property increased by
22% in the year to December 2016, the greatest ever increase in the region’s property values over a 10-
month period.28
Rental market cost increases
Since the 1990s, the average cost of renting a home in New Zealand has continued to increase as well.29
According to tenancy bonds lodged up to December 2016, the average weekly rent had increased by 7.1%
over the previous 12 months to $425 a week, a 24.6% rise in the cost of rent over the five years to
December 2016.30 Similarly, as of December 2016, data from rental properties advertised on Trade Me
showed that the average weekly rent had increased by 7.1% over the previous twelve months to $450 a
week31, which was a 27.1% rise in the cost of rent over the last five years.32 Wellington is one of the most
expensive markets in the country and rents have increased by 13.0% in the 12 months to February 2017
and 21.5% in the five years to February 2017.33
In 2015, 50% of households living in rental properties were spending 30% of their incomes on housing.34
Other cost of living increases
Other household living costs – such as food, transport and utilities – have also continued to increase,
thereby compounding concerns over affordability. From 2013 to 2016, average household expenditure on
all living costs (combined) increased by 17.1%. During that time, weekly household expenditure on food
rose 14% and weekly household expenditure on transport rose 23.4%. Over the same three-year period,
household incomes only increased by 11.7%, which increased the proportion of household income that was
required to cover those costs.35
Other factors influencing housing affordability
In 2012 the New Zealand Productivity Commission completed an inquiry into housing affordability in New
Zealand. The inquiry was initiated because of concerns that real house prices in New Zealand had increased
significantly, and that this increase was associated with general declines in housing affordability and home
ownership rates as well as increased demand for rental accommodation and additional pressures on the
social housing sector. The report identified a number of factors influencing housing affordability, from a
demand and a supply perspective.
26
Ibid.
27
REINZ. 2017. Monthly Property Report. 2017.
28
Ibid.
29
Statistics New Zealand. July 2013. Rental affordability 1998–2012: regional distributions.
30
MBIE. Rental bond data: Mean rents by region, January 1993 – February 2017. mbie.govt.nz/info-services/housing-
property/sector-information-and-statistics/rental-bond-data
31
Trade Me. December 2016. Rent leap to end 2016 on record high.
32
Trade Me. November 2016. Little Christmas cheer for tenants.
33
Op. cit.
34
Statistics NZ. Household economic survey (income): year ended June 2015.
35
Statistics NZ. Household expenditure statistics: year ended June 2016.
16 | P a g eDemand
There are two components that determine household demand: underlying demand and effective demand.
Underlying demand is based on the size of the population, the number of households and the size of those
households. The New Zealand population is projected to grow to between 5.3 and 6.5 million by 2038.36 At
the same time, household size is projected to decrease due to the rise in one- and two-person households,
a trend that is forecast to continue over time.37 A growing population coupled with decreasing household
sizes will translate to an increase in the number of households, which will result in an increase in the
underlying demand for housing.
Meanwhile, effective demand is determined by people’s aspirations to rent or buy a house and their
financial ability to do so, which relates not only to household incomes and housing costs, but also to
mortgage lending rates and housing supply. For example, from 2015 to 2016, low interest rates made it
easier for many households to secure debt to purchase their own homes, which then contributed to an
increased demand for housing despite record property prices and increases in housing costs greater than
increases in household incomes.38
Supply
Statistics New Zealand argues that, in the year ending June 2017, the supply of new homes did not appear
to be large enough to meet growing demand.39
Supply of housing can be influenced by many different factors including regulations, new building plans, the
cost of building materials, the availability of skilled workers, the availability of other infrastructure, and
zoning rules.40
Since 1980, construction costs have increased 4.3% on average.41 According to Statistics New Zealand, this
made it less appealing for prospective home owners to build their own homes and contributed to the 21%
decline in the number of building consents issued between 1974 and 2016.42
The size of homes under construction has also dramatically increased, from an average of 110m2 in 1974 to
182m2 in 2016, reducing the number of properties that can be constructed in a certain land area.43
At a national level, one of the levers being used to address supply issues is the National Policy Statement on
Urban Development Capacity, which encourages councils to make plans that will allow their cities to grow
in the future and cater to the needs of their growing communities through the provision of infrastructure
and services.44
36
Statistics NZ. October 2016. National population projections.
37
Statistics NZ. October 2015. National family and household projections: 2013(base)–2038.
38
Quotable Value. December 2016. 2016: a year of uncertainty for the NZ property market.
39
Statistics New Zealand. 2017. Trending topics – Housing.
40
Ibid.
41
NZ Productivity Commission. March 2012. Final report on housing affordability.
42
Statistics New Zealand. October 2016. We’re building bigger 40 years on.
43
Ibid.
44
Ministry for the Environment. 2016. Proposed National Policy Statement on Urban Development Capacity:
Consultation Document.
17 | P a g eAvailability of social housing
The demand for state housing in New Zealand increased by 35% in 201645, as rising property prices and
rental costs hindered households’ abilities to afford their own homes or to rent privately.
To address this increase in demand, the government announced in 2016 that it would provide an additional
6,400 social houses by 2020, predominately in Auckland, where waiting lists are long but supply is limited.46
To fund the purchase of the new homes, the Ministry of Social Development (MSD) opted to sell many
existing properties in rural areas and small towns to community housing providers. From September 2015
to December 2017, the size of Housing New Zealand’s managed stock decreased by 3,883.47
Implications
There are two primary reasons why territorial authorities are concerned about the availability of
affordable housing and the rising costs of goods and services.
Firstly, territorial authorities themselves are not immune to the impacts of cost increases. Rising costs of
labour and materials, coupled with growing populations and ageing infrastructures, can pose financial
challenges to local authorities, who aim to provide quality infrastructure and services for their
communities.
Secondly, territorial authorities understand that high living costs coupled with insufficient housing
weaken communities. As such, many territorial authorities are currently debating their roles regarding
the provision of affordable housing, the construction of new housing, and the overall social wellbeing of
residents.
Pressures on the natural environment
Local government has a clear legislative mandate to ensure the sustainable management of our natural
resources; however, this is a significant challenge for local government because New Zealand’s natural
environment is facing a number of pressures (such as ongoing challenges to freshwater quality and threats
to indigenous flora and fauna).48
LGNZ argues that, although environmental sustainability is embedded in national legislative and policy
frameworks, it is still difficult to align environmental goals with other aims. For example, even though New
Zealand’s economy is highly dependent on the natural environment, economic aims and environmental
aims are often at odds.
Local governments must work with their communities to find ways to obtain some goals – particularly
those related to economic development and growth – without furthering harm to the environment.
Exacerbating this challenge is the fact that the increasingly visible impacts of climate change must be
managed at the same time.
45
Ministry of Social Development. September 2016. The housing register.
46
Ministry of Social Development. December 2016. Social housing purchasing strategy.
47
Housing New Zealand. Property by number of bedrooms, 30 September 2015; Housing New Zealand. Property by
number of bedrooms, 31 December 2017.
48
LGNZ. July 2016. The 2050 challenge: future proofing our communities.
18 | P a g eClimate change
The Intergovernmental Panel on Climate Change’s (IPCC) Fifth Assessment Report provides a clear, close to
unequivocal understanding of the changes occurring to the climate system and the impact of human
activity that has led to those changes.49 Climate change is already impacting how our communities live and
function, and these impacts are expected to increase in magnitude and extent over time.
A recent report from NIWA, commissioned by GWRC, agreed with the IPCC’s conclusions that the climate
system is warming, with most of the recent temperature increases due to human greenhouse gas
emissions. New Zealand has warmed about 1◦C since 1909, with more heat waves, fewer frosts and more
rain in the south and west of New Zealand; less rain in the north and east of both islands; and a rise in sea
level of approximately 1.7mm per year.50
New Zealand’s climate is ‘virtually certain to warm further’ during the twenty-first century, with:
heat waves and fire risk predicted to increase in intensity and frequency;
floods, landslides, droughts and storm surges likely to become more frequent and intense;
frosts likely to become less frequent; and
precipitation patterns leading to increased runoff in the southwest and reduced runoff in the
northeast.51
Complex and far-reaching impacts on our communities and industries
Climate change will increase the frequency and likelihood of natural hazard events affecting communities
and industries. Increased flooding and erosion in many coastal and low-lying areas, for example, will
escalate risks to low-lying ecosystems, infrastructure and housing. At the same time, changing production
zones and growing conditions for agriculture, pasture production, forestry and fisheries may shift the types
of industry that can be supported.
A strong theme in these impacts is the unequal ways our communities will be directly affected. Sea level
rise clearly affects coastal communities most (although impacts can flow inland along waterways and be
felt through a rising water table), while agricultural regions are likely to be affected in different ways.52
Implications
Action is needed to (i) mitigate our greenhouse gas emissions to help reduce the extent of climate
change, and (ii) adapt to climate change in order to reduce the extent to which these changes harm
communities and industries.
Councils have opportunities to develop strategic initiatives and practical tools to support these aims.
SOLGM argues that an integrated mix of regulatory and non-regulatory responses is needed, with many
of the opportunities for local government action falling into three broad categories:
• building community understanding and preparedness;
• developing practical processes and tools to help New Zealanders adapt; and
• strengthening resilience against adverse impacts.53
49
LGNZ. 2015. Climate change. Note: the IPCC sixth assessment report is due to be published in 2022.
50
NIWA. June 2017. Climate change and variability – Wellington Region: prepared for Greater Wellington Regional
Council, p11.
51
Ibid., pp11-12.
52
LGNZ. July 2016. The 2050 challenge: future proofing our communities.
19 | P a g eGiven the significant impact of rising sea levels and other changes on coastal environments in particular,
the Parliamentary Commissioner for the Environment published a series of reports in 2014 and 2015 to
increase understanding of how sea level rise will affect New Zealand.54 More recently, the Ministry for
the Environment released guidance for local government on adaptation to coastal hazard risks from
climate change.55
Emergency resilience
New Zealand’s wild and diverse landscape, our relatively isolated geographic location, and our reliance on
primary production means that New Zealanders are, and will continue to be, at risk from a broad range of
hazards.56
New Zealand’s integrated approach to emergency management, as described by the Ministry of Civil
Defence & Emergency Management, centres around four areas of activity known as the 4Rs.57 These are:
Reduction: Identifying and analysing long-term risks to human life and property from hazards;
taking steps to eliminate these risks if practicable, and, if not, reducing the magnitude of their
impact and the likelihood of their occurring;
Readiness: Developing operational systems and capabilities before a civil defence emergency
happens; including self-help and response programmes for the general public, and specific
programmes for emergency services, lifeline utilities and other agencies;
Response: Actions taken immediately before, during or directly after a civil defence emergency to
save lives and protect property, and to help communities recover; and
Recovery: The coordinated efforts and processes to bring about the immediate, medium-term and
long-term holistic regeneration of a community following a civil defence emergency.
Emergency management can cover a range of events from natural hazards (such as earthquakes, tsunamis,
flood or severe wind), to biological (human pandemic, major pest or disease outbreak), to technological
(infrastructure failure or cyber-attack) and social (terrorism or global conflicts). New Zealand’s position at
the border of tectonic plates makes it vulnerable to geological hazards such as earthquakes, tsunamis and
volcanic activity. Meteorological hazards such as floods also form a key aspect of New Zealand’s risk profile,
particularly due to their high frequency.
Figure 2 below illustrates the likelihood of a risk occurring over the course of one year, and the scale of the
consequences of the hazard occurring.
53
SOLGM. Climate change.
54
Parliamentary Commissioner for the Environment. 2015. Preparing New Zealand for rising seas: certainty and
uncertainty; Parliamentary Commissioner for the Environment. 2014. Changing climate and rising seas: understand
the science.
55
Ministry for the Environment. 2017. Coastal hazards and climate change: guidance for local government.
56
National Civil Defence Emergency Management Strategy 2008, p3.
57
civildefence.govt.nz/cdem-sector/cdem-framework/the-4rs/
20 | P a g eYou can also read