Strategic Plan 2015-2020 - Sacramento Regional Transit District - Exhibit A
←
→
Page content transcription
If your browser does not render page correctly, please read the page content below
Exhibit A

Sacramento Regional Transit District

       Strategic Plan
        2015-2020
Table of Contents
                                                                   Strategic Plan 2015

1.0 Strategic Plan Introduction                                                  1

2.0 Agency Background                                                            1
   2.1 History                                                                   1
   2.2 Historical Operating Characteristics                                      1

3.0 Review of 2004 Plan Components                                               5
   3.1 Review of Previously Identified Challenges                                5

4.0 Goals & Key Performance Indicator Review                                    11

5.0 Plan Update Process                                                         11

6.0 Input Opportunities & Considerations                                        12
   6.1 Outreach Efforts and Input Methods                                       13
       6.1.1 Public & Stakeholder On-site Input Opportunities and Promotional
             Efforts                                                            13
       6.1.2 Online Input                                                       15
       6.1.3 Employee, EMT & Board Member Input Opportunities                   15
       6.1.4 Other Considerations: Fittingness with other Plans, Regulations
             and Efforts                                                        15
       6.1.5 Survey Results                                                     15

7.0 Updated Plan Components                                                     19
   7.1 Mission                                                                  19
   7.2 Vision                                                                   19
   7.3 Values                                                                   20
   7.4 Challenges                                                               20
   7.5 Goals & Strategies                                                       21
   7.6 Key Performance Indicators                                               22
   7.7 Implementation & Tracking                                                24
       7.7.1 Annual Tactic Identification & Budget Accommodation                24
       7.7.2 Monthly and Quarterly Progress Reporting                           24
       7.7.3 Annual Progress Reporting                                          24
   7.8 On-going Development                                                     25

Sacramento Regional Transit District          -i-                         2015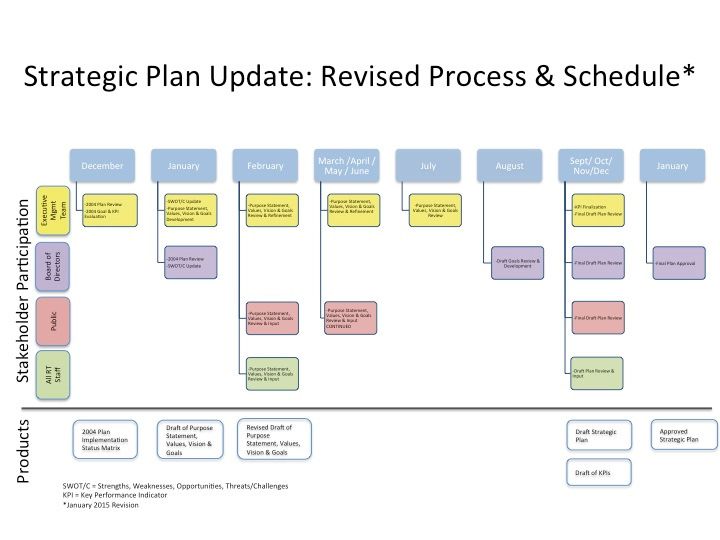
Table of Contents
                                                                  Strategic Plan 2015

                                        TABLES
Table 2.2.1: Select Operating Statistics Comparison                                2
Table 3.1.1: Household, Family Size and Owner-occupied Housing Unit
              Estimates                                                         8
Table 3.1.3: Commuting Mode Share Estimates                                     8
Table 6.1.1.1: Stops & Stations: Locations of Outreach Efforts                 14
Table 6.1.1.2: Community & Stakeholder Meetings: Locations of Outreach
               Efforts                                                         14

                                        FIGURES
Figure 2.2.1: Service Offerings: Bus and Train Car Revenue Hours by Fiscal
              Year                                                             3
Figure 2.2.2: Service Consumption: Unlinked Passenger Trips by Fiscal
              Year                                                             4
Figure 2.2.3: Service Consumption: Passenger Miles by Fiscal Year               5
Figure 3.1.1: MTP Predicted Growth Rates                                       6
Figure 3.1.2: Congested Miles Driven Per Day Per Capita: Actual (through 2008)
              and Predicted (after 2008) by MTP Update                         7
Figure 3.1.2: Percent of Population by Age Group                               8
Figure 3.1.4: Commuting Mode Share Estimates                                   9
Figure 3.1.5: Annual Funding by Source                                         9
Figure 5.0.1: Strategic Plan Update Diagram                                    12
Figure 6.1.5.1: Public Goals Input: Percent of Respondents Selecting Goal as
                Top 5 Most Important                                           16
Figure 6.1.5.2: Employee Goals Input: Percent of Respondents Selecting Goal as
                Top 5 Most Important                                           17
Figure 6.1.5.3: Employee Values Input: Percent of Respondents Selecting Goal
                as Top 5 Most Important                                        18

                                    APPENDICES
A            2004 Strategic Plan KPIs Evaluation
B            Public Online and Printed Survey Results
C            Staff Online Survey and Voting Board Results
D            2015 Strategic Plan Goals and KPIs with Responsible Division

Sacramento Regional Transit District     -ii-                               2015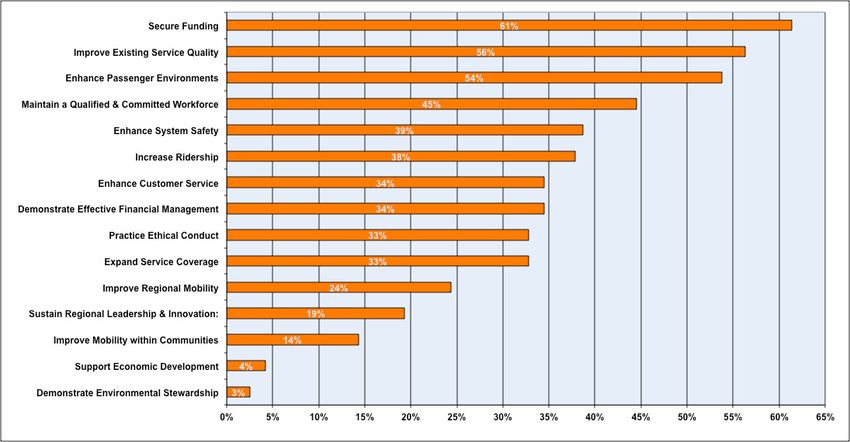
Strategic Plan 2015

1.0    Strategic Plan Introduction

Strategic plans provide a framework to guide an organization from its current position to
its desired state. With consideration of internal and external factors, strategic plans
establish goals and indicators to guide and gauge organizational change and progress.

The Sacramento Regional Transit District’s (RT) Board of Directors adopted the last
Strategic Plan in 2004. In the decade since the previous Strategic Plan was approved,
the region has experienced tremendous change. This update to RT’s Strategic Plan
provides a current framework to evaluate and prioritize potential services and efforts
included in various agency plans.

2.0    Agency Background

2.1 History
In 1971, the California State Legislature enacted the Sacramento Regional Transit
District Act, which established a new agency to provide public transit services to the
Sacramento region. The legislature found that it was necessary to establish a transit
district to:

       •   Operate a single unified public transportation system in the Sacramento
           region.

       •   Provide a comprehensive public transportation system.

The Legislature intended that the formation of the transit district would further:

       •   The concept of regional rapid transit and transit districts.

       •   The goal of developing a state network of rapid transit systems operated as a
           single coordinated statewide system.

RT began operation of transit services in 1973, becoming the largest transit provider in
the Sacramento Region. RT’s service area includes the urbanized boundary of
Sacramento County. RT currently provides transit service to the cities of Sacramento,
Citrus Heights, and Rancho Cordova, as well as bus service to portions of Elk Grove
and light rail service to Folsom.

2.2 Historical Operating Characteristics
RT currently serves a metropolitan area within Sacramento County encompassing 418
square miles and 1.4 million people, operates 67 bus routes and 38.6 miles of light rail
service. Annual ridership is approximately 28 million. The transit system includes 50
light rail stations, 31 bus and light rail transfer centers, 18 park-and-ride lots and 3,300
bus stops throughout Sacramento County. Currently under construction, RT’s 4.3 mile
light rail extension to Cosumnes River College is designed to improve public transit

Sacramento Regional Transit District         -1-                                 2015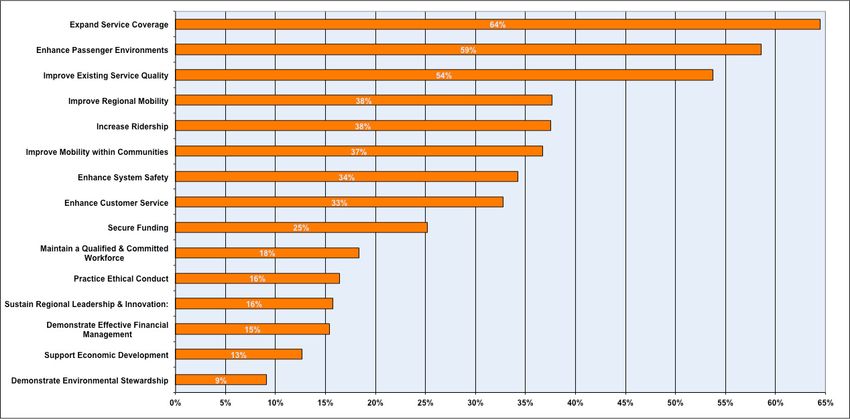
Strategic Plan 2015

service in southern Sacramento County. This rail extension is expected to begin
revenue service in September of 2015. Table 1.1 shows select current operating
statistics compared to those shown in the 2004 Strategic Plan.

RT’s entire bus and light rail system is accessible to the disabled community.
Additionally, through a contract with Paratransit, Inc., RT funds door-to-door
transportation service for thousands of elderly and disabled Sacramento area residents
who are unable to use conventional public transit services.

Table 2.2.1: Select Operating Statistics Comparison
                                            2004 - 2009
                                                                 Latest Available
                 Indicator                 Strategic Plan
                                                                    Estimate
                                          Reported Figure
 Service Area Population (millions)              1.2                    1.4
 # of Bus Routes                                 81                     67
 Active Bus Stops                               3850                   3300
 Active Bus & Light Rail Transfer
                                                  9                     31
 Centers
 Miles of Light Rail Track                      26.9                   38.6
 Light Rail Stations                             31                     50
 Park & Ride Lots                                10                     18
 Annual Passenger Boardings (millions)           28                     28
 Light Rail Miles Under Construction            10.9                    4.3

The last decade brought tremendous change to the Sacramento Region and the transit
service provided by RT. While the statistics shown in Table 2.2.1 and in the 2004
Strategic Plan provide a snapshot of the agency’s operations, the following graphs
provide information on service offerings and service consumption that better relay the
fluctuations that occurred during the last decade in relation to previous trends.

RT reports revenue hours, unlinked passenger trips and passenger miles in-keeping
with industry standards and National Transit Database definitions for estimating service
offerings and consumption. Please see the definitions provided below for more
information about these statistics.

National Transit Database Definitions
Revenue Service (Miles, Hours, and Trips)
The time when a vehicle is available to the general public and there is an expectation of
carrying passengers. These passengers either: directly pay fares; are subsidized by
public policy; or provide payment through some contractual arrangement. Vehicles
operated in fare free service are considered in revenue service. Revenue service
includes layover / recovery time. Revenue service excludes: deadhead; vehicle
maintenance testing; school bus service; and charter service.

Sacramento Regional Transit District       -2-                                2015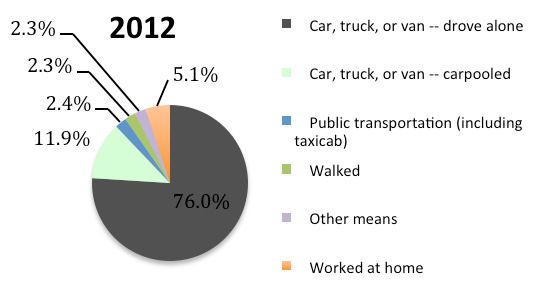
Strategic Plan 2015

National Transit Database Definitions continued
Unlinked Passenger Trips (UPT)
The number of passengers who board public transportation vehicles. Passengers are
counted each time they board vehicles no matter how many vehicles they use to travel
from their origin to their destination.

Passenger Miles Traveled (PMT)
The cumulative sum of the distances ridden by each passenger.

Figure 2.2.1 shows service offering for fixed and route deviated bus service and light rail
service as measured by bus and car train revenue hours. Current total service offerings
are similar to those provided in Fiscal Year 2003. While bus service levels have
increased since their ten-year lows in fiscal years 2011 and 2012, they are similar to
that which was provided before the turn of this century. At the time of adoption of the
2004 Strategic Plan, all of RT’s services were expanding. Bus service peaked in Fiscal
Year 2005. Light rail service levels did not see as large of a proportional decrease as
bus service during the service reductions necessitated by the Great Recession.

Figure 2.2.1: Service Offerings: Bus and Train Car Revenue Hours by Fiscal Year
Source: National Transit Database

              1.0

                      Bus    Rail
              0.9

              0.8

              0.7

              0.6
   millions

              0.5

              0.4

              0.3

              0.2

              0.1

              0.0
                    '96     '97     '98   '99   '00   '01   '02   '03   '04   '05   '06   '07   '08   '09   '10    '11   '12   '13

Service consumption as measured by unlinked passenger trips since Fiscal Year 1996
is shown in Figure 2.2.2. While unlinked passenger trip totals in Fiscal Year 2013 are
similar to the early 2000s, the trip total on bus is lowest of all years in the range shown.
Unlinked passenger trips on light rail service grew (over the shown time period) with
several light rail track extensions. In Fiscal Year 2013, total unlinked passenger trips
were split almost evenly between bus and light rail.

Sacramento Regional Transit District                                    -3-                                                    2015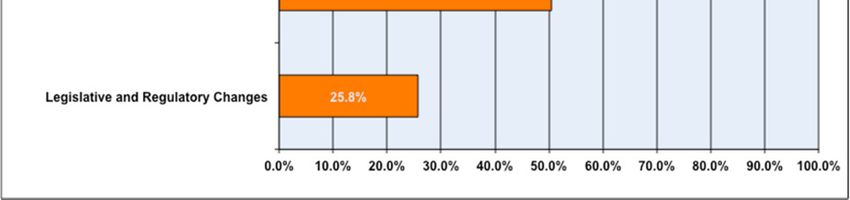
Strategic Plan 2015

Figure 2.2.2: Service Consumption: Unlinked Passenger Trips by Fiscal Year
Source: National Transit Database

            40.0

                   Bus     Rail
            35.0

            30.0

            25.0
 millions

            20.0

            15.0

            10.0

             5.0

             0.0
                   '96   '97      '98   '99   '00   '01   '02   '03   '04   '05   '06   '07   '08   '09   '10     '11   '12    '13

Service consumption as measured by passenger miles since Fiscal Year 1996 is shown
in Figure 2.2.3. Like the unlinked passenger trips total in Fiscal Year 2013, the
passenger miles total for bus and light rail service in Fiscal Year 2013 is similar to that
estimated in the late 1990s and early 2000s. Light rail passenger miles, however,
accounted for a larger percentage of passenger miles than unlinked passenger trips in
Fiscal Year 2013, which indicates that passengers are using light rail services to travel
longer distances per trip.

Sacramento Regional Transit District                                  -4-                                                     2015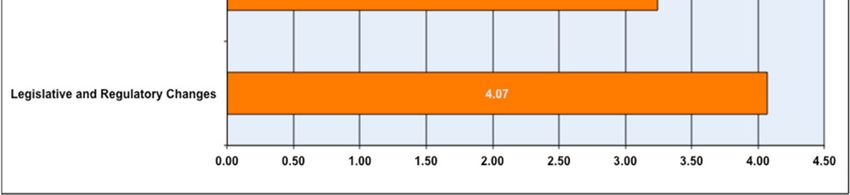
Strategic Plan 2015

Figure 2.2.3: Service Consumption: Passenger Miles by Fiscal Year
Source: National Transit Database

               160         Rail
                           Bus
               140

               120

               100
   millions

               80

               60

               40

               20

                0
                     '96         '97   '98   '99   '00   '01   '02   '03    '04   '05   '06   '07   '08   '09   '10   '11   '12   '13

3.0           Review of 2004 Plan Components

3.1 Review of Previously Identified Challenges
Six fundamental challenges were identified in the 2004 Strategic Plan. The following
discussion provides an update on the previously identified fundamental changes and
was used to determine which, if any, of those challenges are still current. Each goal
established in the 2004 Strategic Plan related directly to an identified challenge.
Evaluation of these challenges, therefore, also provides insight into the current need for
related goals.

Fundamental Challenge: Rapid Regional Growth
At the time of the 2004 Strategic Plan’s creation, the Sacramento Region was
experiencing rapid growth. Population, housing and employment forecasts predicted the
region’s rate of growth would continue swiftly and steadily with significant impacts on
traffic congestion and air quality levels. While the region has grown since 2004, it has
not achieved this growth with the continuous and steady rate that was anticipated during
the creation of RT’s 2004 Strategic Plan. The region is still forecasted to experience
tremendous growth with increases in population, employment and households expected
to grow by 34%, 39% and 35% respectively by 2035. The last updates to the
Sacramento Area Council of Government’s (SACOG) Metropolitan Transportation Plan
(MTP) have, however, included revised and lower growth rates than previous versions.
The 2035 growth forecast contained in the 2011 MTP/ Sustainable Communities
Strategy (SCS) indicates that population in the plan area is expected to grow by
871,000 people, an increase of about 39 percent, between 2008 and 2035. This

Sacramento Regional Transit District                                       -5-                                               2015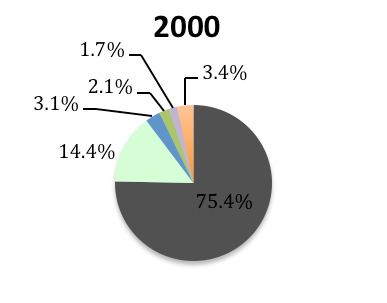
Strategic Plan 2015

forecast is lower than the 1.3 million people forecasted in the 2008 MTP, which had the
same 2035 planning horizon, but used 2005 as the base year. Figure 3.1.1 shows the
forecasted growth rates shown in the 2008 and the 2012 MTP.

Traffic congestion as measured by congested miles of travel driven per capita per day
decreased in the region between 2005 and 2008 and is currently predicted to continue
to decrease with efforts identified in the latest MTP/SCS (Figure 3.1.2). The regional
reduction in congestion since 2005 follows the national trend that is attributed to
unfavorable economic conditions. However, improving economic conditions are
predicted to increase travel demand.

Figure 3.1.1: MTP Predicted Growth Rates
Source: SACOG 2008 MTP and 2011 MTP/SCS

Sacramento Regional Transit District      -6-                              2015
Strategic Plan 2015

Figure 3.1.2: Congested Miles Driven Per Day Per Capita: Actual (through 2008)
and Predicted (after 2008) by MTP Update
Source: SACOG, 2013

Fundamental Challenge: Societal Change
The 2004 Strategic Plan predicted societal changes such as an aging population and
changes to household size and composition that were predicted to have significant
impacts on travel needs and offerings. While the region didn’t see a significant change
in household size (Table 3.1.1), it has seen an aging of the population (Figure 3.1.2).
The aging population has not yet resulted in a significant change to regional travel mode
share (Figure 3.1.3 and Table 3.1.4). This lack of change was likely impacted by lower
than predicted levels of congestion and availability of alternatives to driving alone. An
unexpected societal change was the lowering of the median household income. 2000
Census data estimates an annual median household income of approximately $60,400
(adjusted to 2012 dollars) in the Sacramento region. The annual median household
income in the Sacramento region was reported by the 2012 American Community
Survey to be approximately $52,700. While the percentage of the population between
the ages of five and 24 years of age decreased slightly between the 2000 Census and
2012 American Community Survey estimates and represents one of the largest age
ranges shown by representing a 19 year span, it represents a large portion of the
community and RT’s Executive Management Team would like to note that this may be a
segment that RT should focus on for additional outreach efforts.

Sacramento Regional Transit District       -7-                               2015
Strategic Plan 2015

Table 3.1.1: Household, Family Size and Owner-occupied Housing Unit Estimates
Source: U.S. Census Bureau, American Community Survey
Community Profile Statistic                     2000      2012        % Change
  Average household size                         2.64      2.74         3.8%
  Average family size                            3.24      3.40         4.9%
  Owner-occupied housing units                 58.20%    56.30%         -3.3%

Figure 3.1.2: Percent of Population by Age Group
Source: U.S. Census Bureau

Table 3.1.3: Commuting Mode Share Estimates
Source: U.S. Census Bureau, American Community Survey
Commuting to Work Mode                            2000    2012        Difference
   Car, truck, or van -- drove alone             75.4%   76.0%           0.6%
   Car, truck, or van -- carpooled               14.4%   11.9%          -2.5%
   Public transportation (including taxicab)      3.1%    2.4%          -0.7%
   Walked                                        2.1%    2.3%            0.2%
   Other means                                   1.7%    2.3%            0.6%
   Worked at home                                3.4%    5.1%            1.7%

Sacramento Regional Transit District       -8-                           2015
Strategic Plan 2015

Figure 3.1.4: Commuting Mode Share Estimates
Source: U.S. Census Bureau

Fundamental Challenge: Funding
The Great Recession impacted household incomes, employment rates and transit
funding levels. RT, like many other transit providers in the United States, experienced
significant reductions in local, state and federal funding levels. Since 2004, RT’s
nominal annual state and local operating revenue ranged from as high as nearly
$93,000,000 in Fiscal Year 2007 to as low as just over $58,000,000 in fiscal years 2010
and 2011 (Figure 3.1.5). During the same period, RT’s nominal annual federal
operating revenue ranged from just under $12,000,000 in Fiscal Year 2004 to as high
as nearly $31,000,000 in Fiscal Year 2010. Reductions in funding necessitated
reductions in staffing levels.

Figure 3.1.5: Annual Funding by Source
Source: National Transit Database Report, not adjusted for inflation

             160

             140
                                                            18          21

                                                                                      30                                                 29
             120                           19
                                                                                                                              24
                              24                                                                   31
                                                                                                                 23
                     12
             100
$ Millions

             80                                             93          85
                                                                                      71                                                 71
                                           79                                                                                 69
                                                                                                   58            58
                     67       70
             60

             40                                                                       4
                                                                        5                          3                                     3
                                                                                      4                          4            3
                                                            2                                      5                                     6
                                           2                            5                                        4            5
                     3                                      5
                              2            5
                     6        5
             20
                                                                        30            33           31            29           29         30
                                           25               27
                     22       21

              -
                   FY2004   FY2005     FY2006             FY2007      FY2008        FY2009       FY2010        FY2011       FY2012     FY2013

                            Fare Revenue        Contract Services   Other Revenue    State/Local Assistance   Federal Assistance

Sacramento Regional Transit District                                         -9-                                                     2015
Strategic Plan 2015 RT experienced several major internal changes in the last decade because of limited funding. Authorized staffing levels have varied greatly over the past decade with the total number of authorized positions peaking in Fiscal Year 2006 at 1,255. Fiscal Year 2011 had the lowest authorized staffing level in the last decade with 928 authorized positions. The total number of authorized positions was reduced significantly in Fiscal Year 2011 with reductions of nearly 23% from the previous fiscal year. Staffing level reduction implemented between fiscal years 2010 and 2011 were split almost evenly between administrative (including all positions represented by the American Federation of State, County and Municipal Employees, Managerial and Confidential Group, and Administrative Employee Association) and operational staff (included all positions represented by the Amalgamated Transit Union and the International Brotherhood of Electrical Workers) with a 24% and 22% reduction in positions respectively. Fundamental Challenge: System Expansion Lower than predicted funding levels necessitated lower than planned services levels. RT’s service offerings varied greatly over the past ten years. Service levels measured by revenue hours for both bus and light rail modes of service fluctuated considerably since 2004. Bus service levels decreased from nearly 697,000 annual revenue hours in Fiscal Year 2004 to approximately 506,000 in Fiscal Year 2013, while train vehicle revenue hours have increased from nearly 150,000 to over 196,000 during the same period. RT experienced an overall reduction in annual vehicle revenue hours of nearly 144,000 between fiscal years 2004 and 2013. The current trend in service levels does not fit with the Metropolitan Transportation Plan referenced during the creation of the 2004 Strategic Plan which projected transit service expansion that would double light rail mileage and double RT’s bus fleet by 2025 with an increase in local transit funding. The extension of the Gold Line to Folsom and introduction of the Green Line increased light rail mileage. The upcoming extensions of the Blue and Green lines will bring RT closer to the previously projected 2025 goal for light rail service. Bus service levels and fleet requirements are currently lower than 2004 levels. Fundamental Challenge: Local Control The desire for more direct and local control of transit services is evident in the change in composition of RT’s Board of Directors. From 2004, the RT Board of Directors was expanded to include representatives from the cities of Citrus Heights, Folsom and Elk Grove. In addition to the expansion in total board members, the number of representatives from the Sacramento City and Sacramento County was adjusted and a weighted voting system was implemented. Since the adoption of the latest Strategic Plan, the city of Elk Grove began operating transit service. Other transit services with a local focus such as the Rancho CordoVAN, the North Natomas Flyer and the McClellan Shuttle were initiated by municipalities and transportation management associations. Fundamental Challenge: System Preservation The 2004 Strategic Plan identified system preservation of infrastructure and equipment, and personnel to be a fundamental challenge. RT continues to face issues associated Sacramento Regional Transit District -10- 2015
Strategic Plan 2015

with aging infrastructure, equipment and vehicles and securing funding sources to
ensure timely replacement, updates and maintenance of these items. With the first set
of light rail vehicles nearing the end of their life cycle, the need to address this situation
is more urgent now than in 2004.

Since 2004, 456 employees have retired from RT; this represents over 40% of the
average annual number of total authorized positions during the same time period.
Retirement doesn’t represent all employee turnover, but likely represents loss of
employees with high levels of relevant work experience, and many of the employees
who were involved in the development of the 2004 Strategic Plan. RT experienced a
high rate of retirements over the past decade and has the potential to see more
employee turnover due to retirement within the next five years. Nearly 60% of the
active employees at the beginning of Fiscal Year 2013 will be eligible for retirement by
the end of Calendar Year 2018. The two employee groups with the potential for the
greatest impact from retirements are the International Brotherhood of Electrical Workers
and the Management & Confidential Group with 65% and 62% of active employees
eligible for retirement within the next five years respectively.

4.0    Goals & Key Performance Indicator Review

Strategic goals are used to move an agency towards realization of its vision. Effective
goals are specific, measurable, and realistic. Some goals may be short to mid-term
efforts with a clear end point while others may be more extending. Key performance
indexes (KPIs) are used to measure progress towards realizing the agency vision
gauging goal achievement. As was discussed in the Section 3.0: Review of 2004 Plan
Components the review of challenges serves as a review of both the previous Strategic
Plan’s challenges and goals as they were directly related. It is important to note,
however, that 68 KPIs were identified in RT’s 2004 Strategic Plan. Of these 68 KPIs, 17
were identified as vital statistics that were planned for regular reporting to gauge the
health of the agency. Of the 17 identified vital statistics, only 14 were ever reported and
only ten are currently reported on a regular basis. The implementation of these
monitoring measures highlights the need to select KPIs that are fitting and able to be
reported with a reasonable amount of resources. Appendix A contains an evaluation of
reporting on KPIs established in the 2004 Strategic Plan.

5.0     Plan Update Process

The update process began with a thorough review and analysis of the 2004 Strategic
Plan. Current conditions were identified in relationship to previously identified
challenges and goals with consideration of previous predictions and actually
experienced circumstances. Implementation of the previously identified plan was also
considered with a review of on-going reporting efforts and regular use of strategic plan
elements. Input from internal and external sources was identified as a critical
component of the update process. As such, RT provided several opportunities for RT
employees, RT’s Executive Management Team, RT’s Board of Directors and existing

Sacramento Regional Transit District        -11-                                 2015
Strategic Plan 2015

riders, community groups and other stakeholders to provide input. Figure 5.0.1 shows
the timeline for major tasks, activities and products associated with this update to RT’s
Strategic Plan.

Figure 5.0.1: Strategic Plan Update Diagram

6.0   Input Opportunities & Considerations

According to the Transit Cooperation Research Program’s (TCRP) Synthesis 59:
Strategic Planning and Management in Transit Agencies Report (2005), of all
(contacted and responding) transit agencies with strategic plans, only 35% reported
involving external stakeholders such as taxpayers, citizens and community groups. The
low percentage of agencies that reported involving external stakeholders in the strategic
planning process is likely because of the limitations on transit agencies’ mission, vision
and goals related to enabling legislation and funding sources, and lack of understanding
of plan components and purpose by the general public. TCRP’s Synthesis 59 report
also highlights the confusion that surrounds strategic plans by relaying that 57% of
agencies mistakenly reporting a long or short range transit plan as a strategic plan.
While some long and short range transit plans may contain components similar to
strategic plans, most of more narrowly focused. The confusion that was found among
reporting staff members at transit agencies likely also exists in the general public. As

Sacramento Regional Transit District      -12-                               2015
Strategic Plan 2015

community stakeholders are most familiar with giving input on transit plans concerning
service characteristics, RT staff anticipated that outreach efforts for the update to RT’s
Strategic Plan would cause some confusion among the general public. RT decided,
however, that community input and involvement is a critical component of an update
RT’s Strategic Plan. As such, RT provided over 30 on-site input opportunities around
the Sacramento Region.

RT considered efforts at the federal, state, regional and local level to ensure that this
plan was in keeping with and complementary to best practices and plans of related
efforts.

6.1 Outreach Efforts and Input Methods

6.1.1 Public & Stakeholder On-site Input Opportunities and Promotional Efforts
Staff sought public and stakeholder input concerning RT’s Strategic Plan at 13 transit
centers and light rails stations, and over 20 public and stakeholder meetings throughout
the first half of calendar year 2014. The initial round of outreach efforts focused on
receiving feedback from existing riders. The second round of outreach efforts focused
on gathering input from attendees at regularly scheduled committee meetings,
community groups and other stakeholders. At most public meetings, a brief presentation
was given concerning RT’s Strategic Plan update. Printed surveys (that were designed
to gather input concerning RT’s goals) were available at all Strategic Plan update
outreach events. Attendees who weren’t able to complete the survey at the event were
encouraged to complete an online survey. RT’s presence at these sites was publicized
on RT’s website, various social media outlets including Facebook and Twitter accounts
and RT’s newsletter. The efforts were also promoted through the distribution of meeting
agendas. Surveys were available in printed format and online in English, Spanish,
Russian, Chinese, Hmong and Vietnamese. Over 550 surveys were completed at on-
site outreach events. Interested parties were also able to give input concerning the
update effort at multiple RT Board meetings with agenda items concerning this effort.
Tables 6.1.1.1. and 6.1.1.2 show the stops, station and community meetings that
Strategic Plan Update information was presented and surveys were distributed.

Sacramento Regional Transit District        -13-                                2015
Strategic Plan 2015

Table 6.1.1.1: Stops & Stations: Locations of Outreach Efforts
                        Transit Center / Station Name
                        Meadowview Light Rail Station
                        16th St Light Rail Station
                        CSUS Transit Center
                        Fruitridge Light Rail Station
                        29th St Light Rail Station
                        City College Light Rail Station
                        7 & K Light Rail Station
                        Watt/I-80 Light Rail Station
                        Arden/Del Paso Light Rail Station
                        Mather/Mills Light Rail Station
                        Florin Towne Center Transit Center
                        Watt/Manlove Light Rail Station
                        Sunrise Mall Transit Center

Table 6.1.1.2: Community & Stakeholder Meetings: Locations of Outreach Efforts
                                 Organization Meeting
               Power Inn Alliance
               Mobility Advisory Council
               Arden Arcade CPAC
               Complete Streets Coalition
               Friends of Light Rail & Transit
               Natomas CPAC
               Carmichael/Old Foothill Farms CPAC
               South Sacramento CPAC
               Cordova CPAC
               REACH Area 6 Sunrise Ranch Neighborhood Meeting
               North Highlands/Foothill Farms CPAC
               Rio Linda/Elverta CPAC
               Orangevale CPAC
               Vineyard CPAC
               Fair Oaks CPAC
               Rancho Cordova Chamber of Commerce
               Antelope CPAC
               Oak Park Neighborhood Association
               Highway 50 Corridor Power Lunch
               Sacramento Area Council of Governments
               North Natomas TMA Board Meeting

Sacramento Regional Transit District   -14-                             2015
Strategic Plan 2015
6.1.2 Public & Stakeholder Online Input Opportunities
In addition to on-site input opportunities, an online survey was available from mid-
February through mid-April of 2014. The online survey allowed for input concerning
goals and challenges, and offered a free comment opportunity. The online survey was
promoted on RT’s website, newsletter and multiple social media outlets. Over 70
complete online surveys were submitted. The online survey was also promoted at on-
site events. Attendees were given a hand-out that contained the online survey address
and were encouraged to complete the survey online if not able to do so in-person and to
tell friends, neighbors and family members about the online survey.
6.1.3 Employee, EMT & Board Member Input Opportunities
Employees were encouraged to take an online survey designed specifically for
employees. The online survey was promoted through email notifications, electronic
bulletin board postings and verbal communications from Department heads and at an
employee quarterly meeting. Over 90 employees completed the online survey, which
sought input of RT’s mission and vision statements, goals, challenges and values. In
addition to the online survey, voting boards were available at the August 2014
Employee Quarterly meeting to allow for input on these elements for employees who
may not have regular Internet access.
RT’s Executive Management Team (EMT) had several meetings dedicated to the
update of the Strategic Plan. In addition to the input opportunities provided at several
meetings, information was also distributed electronically and EMT staff members were
encouraged to provide input electronically as well.
Information concerning this update to the Strategic Plan was presented to RT’s Board of
Directors three times prior to seeking approval of the updated plan in January of 2015.
6.1.4 Other Considerations: Fittingness with other Plans, Regulations and
Efforts
In addition to input from community stakeholders, consideration was given to related
efforts such as other planning documents, rules, regulations and environmental factors
such as economic and political conditions. All components of the updated strategic
elements are consistent with other internal and related external plans and efforts.
6.1.5 Survey Results
Online and printed surveys were available to the general public. The online survey
made available to the public was longer and, therefore, more in-depth than the printed
survey that was designed to collect input from people waiting at stops or stations, or
attending regularly scheduled public meetings. An online survey and voting board were
available for RT employees to provide input concerning the Strategic Plan Update.
Appendix B contains a complete set of public survey results. Employees were provided
access to an online survey and an opportunity to provide input through an on-site voting
board at the Employee Quarterly Meeting held in August of 2014 in RT’s main
administration building.
Sacramento Regional Transit District -15- 2015Strategic Plan 2015 The following narrative and graphs relay the key findings from input received through various methods. Figure 6.1.5.1: Public Goals Input: Percent of Respondents Selecting Goal as Top 5 Most Important* *Combination of Printed and Online Survey Input, based on 616 responses As shown in Figure 6.1.5.1, over half of all non-employee survey respondents selected the following three goals as top five (of 15 provided) most important goals for RT: expand service coverage; enhance passenger environments; and improve existing service quality. Five other goals were selected or ranked as top five most important goals by 33% to 38% of non-employee respondents; this second group of top rated goals are (listed in order of the most selected to least selected in this tier): improve regional mobility; increase ridership; improve mobility within communities; enhance systems safety; and enhance customer service. The ranking of goals by non-employees is clearly focused on enhancing transportation and mobility service and these service experiences as opposed to a direct focus on operational issues such as securing adequate funding and workforce qualifications and conduct or related benefits such as supporting economic development and demonstrating environmental stewardship. Sacramento Regional Transit District -16- 2015
Strategic Plan 2015

Figure 6.1.5.2: Employee Goals Input: Percent of Respondents Selecting Goal as
Top 5 Most Important*

*Combination of Printed and Online Survey Input, based on 119 responses

Figure 6.1.5.2 shows that over half of employee survey respondents selected the
following three goals as top five (of 15 provided) most important goals for RT: secure
funding; improve existing service quality; and enhance passenger environments. The
fourth most selected goal was to maintain a qualified and committed workforce. Six
other goals were selected or ranked as top five most important goals by 33% or more of
employee respondents; this second group of top rated goals are (listed in order of the
most selected to least selected in this tier): enhance systems safety; increase ridership;
enhance customer service; demonstrate effective financial management; practice
ethical conduct; and expand service coverage. The employee responses placed a
greater emphasis on financial issues and operational conduct than responses from the
general public and other stakeholders. Employees likely feel and understand that
public’s desire for more service offerings, but are also likely to better understand
resource constraints and limitations, and the impact of operational practices on service
quality.

Sacramento Regional Transit District       -17-                              2015
Strategic Plan 2015

Figure 6.1.5.3: Employee Values Input: Percent of Respondents Selecting Goal as
Top 5 Most Important*

*Combination of Printed and Online Survey Input, based on 118 responses

Figure 6.1.5.3 shows the percentage of employee survey respondents who selected
each shown value as being considered one of the top five most important of those
listed. Six values received top five ratings by over half of the survey respondents. The
top six rated values listed in order of most often selected to least are: quality service &
innovation; customer service; respect & professionalism; fiscal responsibility; integrity &
accountability; and quality, diverse & positive workforce.

Sacramento Regional Transit District       -18-                               2015
Strategic Plan 2015

7.0    Updated Plan Components

The following updated Strategic Plan components were created with consideration of
external and internal factors such as rules, regulations, current and currently predicted
economic and political conditions, and input received from community stakeholders.
Below is a brief explanation of each plan component.

RT Strategic Plan and Strategic Planning Component Explanation:

   •   The Mission statement articulates the agency's purpose and reason for existing.
   •   The Vision statement expresses where RT wants to be in the future.
   •   The Values are those things that an agency will not compromise and considers to
       be most important.
   •   Organization Goals will guide RT from its current to its desired state toward
       realizing its vision.
   •   Key Performance Indicators (KPIs) used to measure an agency’s progress
       towards achievement of its goals.
   •   Tactics, including programs, projects and tasks that are undertaken to achieve
       goals. These measures require resources and, as such, should be identified with
       consideration of available resources and competing initiatives. As such, it is
       recommended that this occur with RT’s annual budget process.

7.1 Mission
Mission Statement:
The purpose of the Sacramento Regional Transit District is to promote and improve
access in the Sacramento region by providing safe, reliable, and fiscally responsible
transit service that links people to resources and opportunities.

7.2 Vision
Vision Statement:
The Sacramento Regional Transit District strives to connect people to resources and
opportunities while stimulating livable communities and supporting economic
development by providing an efficient and fiscally sustainable transit system that
attracts and serves riders by offering an appealing transportation choice.

Sacramento Regional Transit District      -19-                               2015
Strategic Plan 2015
7.3 Values
Values:
• Quality Service & Innovation: RT is committed to providing safe, reliable and
cost efficient public transit services, and initiating innovative technologies to
improve service effectiveness.
• Customer Service: RT places customers first by providing quality transit
services and amenities with convenient and easily understood access at an
affordable price.
• Respect & Professionalism: RT is committed to treating its customers and
employees with dignity and respect, recognizing the importance and value of
each individual.
• Fiscal Responsibility: RT is committed to the pursuit of efficient use of
resources and of secure and stable funding sources.
• Integrity & Accountability: RT acknowledges its responsibility for actions and
performance with an uncompromising commitment to truth, honesty and high
ethical standards. RT is committed to compliance with regulatory requirements
and industry standards and efforts to improve upon existing practices.
• Quality, Diverse & Positive Work Force: RT is committed to increasing
employee effectiveness and satisfaction through effective communication,
teamwork, appropriate resource availability, appreciation of varied abilities, and
professional development opportunities.
• Regional Leadership & Coordination: RT is committed to work with area
stakeholders to create a “world class” transit system that supports livable
communities and related efforts.
• Health & Safety: RT is committed to achieve optimal level of safety for our
employees, customers and the general public by minimizing risk of injury and
property loss and promoting a sound safety culture throughout the organization.
• Sustainability: RT is committed to environmentally sensitive services and
practices.
7.4 Challenges
Challenges:
• Quality Service Demand: Meeting the demand for cost-effective transit services
that support livable communities and accommodate varying travel needs
between and within communities.
• Safety & Security: Implementing measures to prevent and quickly respond to
criminal activity.
• System Preservation: Maintaining, replacing and improving existing
infrastructure, vehicles and equipment.
• Funding: Addressing the need for additional funding to provide quality services
which meet community expectations.
• Quality Workforce: Maintain staff and expertise levels to ensure delivery of
service.
• Legislative and Regulatory Changes: Developing strategies to address
legislative changes.
Sacramento Regional Transit District -20- 2015Strategic Plan 2015
7.5 Goals & Strategies
Strategic Goals & Strategies:
Following the end of the Great Recession, RT is very aware of the difficulties that occur
with providing basic functions in times of economic crisis. Goals have been divided into
fundamental and growth goals with fundamental goals used to measure RT’s fulfillment
of its mission and preparing itself for realization of its vision. Growth goals are
necessary to move beyond fulfilling RT’s mission and measure RT’s progress towards
realization of its vision.
Fundamental Goals
• Ensure Financial Stability
o Secure Funding to Maintain Existing Service Levels, Facilities, Equipment
and Infrastructure Quality
o Seek Funding to Meet Additional Demands and Desires for Enhanced
Service, Facilities, Equipment and Infrastructure Quality
o Operate in a Cost Effective and Efficient Manner
• Meet or Exceed Expectations for Safe & Quality Service in a Cost-Effective
Manner
o Focus on Safety
• Reduce Criminal Activity
• System Operations
o Improve Reliability
• On-time Performance
• Reduce Missed Trips
o Enhance Passenger Environments
• Cleanliness
• Stop & Station Maintenance & Amenities
• Vehicle Maintenance & Amenities
o Provide Convenient and Easy Ways to Access Services with a Focus on
Technological Advances
• Fare, Route & Schedule Information
• Fare System Payment Locations and Methods
• Route & Schedule Structure
o Improve Support Facilities & Services
• Facilities & Services Maintenance & Improvements
• Operate in an Ethical Manner
o Prevent Discriminatory, Dishonest or Misleading Practices
Create Comprehensive Policies and Practices to Minimize Potential
Discriminatory, Hostile Dishonest or Misleading Environments or
Practices for Clients and Employees
o Manage RT’s Finances in an Open and Honest Environment
Sacramento Regional Transit District -21- 2015Strategic Plan 2015
Fundamental Goals continued
• Invest in the Attraction, Development & Retention of a Quality Workforce
o Minimize Employee Attrition & Turnover
o Improve Employee Satisfaction
o Improve Employee Development Opportunities
o Recruit & Attract Qualified Staff Members
Growth Goals
• Improve Access Within and Between Communities (in the Sacramento Region) in
a Cost-Effective Manner
o Expand Service Coverage: Expand service coverage to areas that can be
served effectively and efficiently
o Improve Existing Service Levels: Improve service levels with priority on
well-utilized services and consideration of competing needs
o Coordinate Activities with Organizations that Support the Advancement of
Transit
• Increase Transit Market Share (in the Sacramento Region)
o Create New and Modify Existing Services to Better Meet Community
Needs
o Promote Services to Various Groups Based on Area Factors and Market
Research
o Assist in the Development of Land Uses that Encourage Transit Use
• Adjust to Legislative & Regulatory Changes and Stakeholder & Community
Initiatives and Support Complementary Efforts
o Accommodate & Leverage Legislative & Regulatory Changes
o Engage with Appropriate Partner & Stakeholder Initiatives
o Cooperate and be Consistent with Related Efforts and Plans such as the
Sacramento Area Council of Governments Metropolitan Transportation
Plan / Sustainable Community Strategy
o Support Economic Development Activities in a Fair and Balanced Manner
7.6 Key Performance Indicators
Key Performance Indicators (KPIs) are used to measure progress towards achievement
of a strategic goal. Based on currently available data, KPIs were selected for each goal.
KPIs (and definitions) associated with each goal can be found in Appendix D. All
identified KPIs should be shown with historical information for comparative purposes
and to track progress and, when available, current industry benchmarks. KPI reports
should be created and distributed on a quarterly basis although not all KPIs are
intended for quarterly reporting; rather some will be only be reported on an annual
basis.
Sacramento Regional Transit District -22- 2015Strategic Plan 2015
KPIs are shown by reporting period below.
Monthly Reported KPIs
• Operating Cost YTD vs. Budget
• Customer Generated Fare Recovery Ratio
• Ridership
• Passenger Boardings per Vehicle Service Hour
• Security Related Complaints
• Reported Crime
• National Transit Database Reported (NTD) Accidents per 100,000 Miles
• On-Time Performance
• Percent of Completed Trips
• Mean Distance Between Service Calls (Miles)
Quarterly Reported KPIs
• Fare Revenue Year-to-Date vs. Budget
• Light Rail Fare Evasion and Inspection Rates
• Percent of Service Hours to Total Hours and Percent of Revenue Hours to Total
Hours
• Cost per Vehicle Revenue Mile and Cost per Vehicle Revenue Hour
• Percent of No Shows/Cancellation (ADA)
• Number of Customer Contacts and Website Visits
• Complaints per Million Passenger Boardings and Commendations per Million
Passenger Boardings
• Unscheduled Absenteeism
Annual Reported KPIs
• Percent of Trip Denials (ADA)
• Total Capital and Operating Funding Level by Source
• Pay to Platform Hours
• Percent of Stops with Bus Shelters and Benches
• Percent of (700s filing status) Employees Receiving Conflict of Interest and Code
of Ethics Training
• Number of Reported Code of Ethics Policy Violations
• Number of Reported Conflict of Interest Policy Violations
• Available Policies, Procedures, Programs and Training Opportunities Regarding
Ethical Conduct
• Employee Turnover Rate
• Available Training / Employee Enhancement Opportunities
• Percent of RT Managers and Supervisors Completing Skill and Management-
Related Training
• Achievement of Annual Disadvantaged Business Enterprise (DBE) Program Goal
• Percentage of Routes with Headways of 30 minutes or Less
Sacramento Regional Transit District -23- 2015Strategic Plan 2015
Annual Reported KPIs continued
• Percentage of Non-Commute Routes that Operate on Saturday and Percentage
of Non-Commute Routes that Operate on Sunday
• Promotional Activities
• Unqualified External Annual Financial Audit Report
• No Repeat Audit Deficiencies
• Satisfactory Transportation Development Act State Audit
• Employee Satisfaction Rating*
• RT Compensation Compared to Local Governmental/Peer Transit Labor Market*
• Accomplishment of EEO/AA Program Goals*
• Population within 1/4 mile of transit stop or station*
• Employment within 1/4 mile of transit stop or station*
• Commute Transit Mode Split*
• Satisfactory Federal Transit Administration Triennial Audit (no major
deficiencies)*
• Satisfactory Caltrans Audit*
* These KPIs will be shown in the annual report although changes or updated
information may not be available annually.
7.7 Implementation & Tracking
7.7.1 Annual Tactic Identification & Budget Accommodation
All efforts undertaken by RT should enable the agency to fulfill its mission and work
towards realization of its vision. As such, all efforts should be consistent with the
mission, vision and goals identified in RT’s Strategic Plan. All strategies, tactics, tasks
or efforts used to achieve strategic planning goals will require resources. To ensure that
all planned activities are consistent with RT’s Strategic Plan and that appropriate
resources have been identified to support these activities, it is recommended that the
annual budget process identify which goal or goals each budget item promotes and that
the Strategic Plan is used as the guiding document to prioritize projects for the coming
budget cycle.
7.7.2 Monthly and Quarterly Progress Reporting
Reports will be issued monthly with supplemental information quarterly with those KPIs
that are planned for monthly and quarterly reporting (as shown in Appendix D).
7.7.3 Annual Progress Reporting
It is recommended that prior to the beginning of each annual update to RT’s budget, an
annual progress report is created that shows the key performance indicators with trend
information and also contains a written assessment of progress made towards
achieving each goal during the previous year. This annual report and an analysis should
then be used to help prioritize efforts in the updated budget.
Sacramento Regional Transit District -24- 2015Strategic Plan 2015 7.8 On-going Development A comprehensive review of RT’s Strategic Plan with opportunities for public and employee input is recommended to occur every three to five years. Minor modifications and updates may also easily occur with the annual Strategic Plan progress report and RT’s annual budget update process. Upon review of the progress made on strategic goals, and changes in RT’s internal and external operating environments, the EMT should identify and submitted desired changes to the Strategic Plan. Sacramento Regional Transit District -25- 2015
Appendix A: 2004 Strategic Plan KPIs Evaluation
2004 Strategic Plan KPIs Evaluation
Currently
KPI # for Vital Comments: If not currently reported, please explain why this KPI is not
2004 SP Currently Reported Currently Previously Previously Never Never
indicated Key Performance Indicators (KPI) Statistic Definition reported. If currently reported, please relay any concerns about the use of this GM LC A FI PL OP MC FA EC
Goal # Reported in KPR? Elsewhere? Collected? Reported? Collected? Reported? Collected?
Goal # (Y/N) statistic or the accuracy of the estimate.
Where?
1 1 Operating Cost YTD vs. Budget Y Y X
1 2 Fare Revenue YTD vs. Budget Y Y X
1 3 Farebox Recovery Ratio Y Fare revenues divided by total expenses. Y NTD X
Actual operating costs divided by total S: Cost per
1 4 Cost per Vehicle Service Mile actual revenue miles. Revenue Mile
X X
Actual operating costs divided by total S: Cost per Vehicle
1 5 Cost per Vehicle Service Hour Y
actual revenue hours. Revenue Hour
NTD X X
Operating costs divided by total actual
1 6 Cost per Passengers passengers.
NTD X X
Actual passengers divided by actual
1 7 Passengers per Mile revenue miles traveled by passengers.
X
C: Cost per Pass &
Funds granted by federal, state or local
1 8 Subsidy per Passenger Y
government divided by passengers.
Farebox Recovery X X
Ratio
Total actual revenue hours plus deadhead Data not collected or reported from the Admin Division. This is likely a
1 9 Vehicle Service Hours per Employee time divided by # employees. Scheduling Department matter.
X X
S:Monthly
estimates for # of
scheduled work
Days Employees work in a year less days, % rate of
Labor Relations
1 10 Employee Availability Data (Days) Y scheduled days off and annual benefit absenteeism and
Department
X X
accrual days. the corresponding
average # of
unscheduled
absentee days. Yes Yes Yes Data collected and reported monthly from the Labor Relations Department.
1 11 Bond Ratings (if any) of A or Better X
Mean vehicle miles traveled during defined
2 1 Mean Distance Between Failures (Miles) period between the number of X X
breakdowns.
2 2 • Repeater Road Call Analysis Y X
Mean vehicle miles traveled during defined Y: Not with the
2 3 • Air Conditioning and Y period between the number of breakdown by X
breakdowns. category.
2 4 •Wheelchair Lift/Ramp Reliability Y X
2 5
% Preventive Maintenance Inspections Completed All PM inspections completed within 10%
X
On-Time of the required time or mileage.
# of employees available for the movement
2 6 Weekday AM Pull-Out Availability of a revenue vehicle from the garage to its X
first scheduled terminus or stop.
2 7 % Completed Weekday Trips X X
Percentage of demand-responsive trips
2 8 % No Shows/Cancellations (ADA) scheduled where passengers fail to take X X
the trip.
Percentage of trip requests in which
2 9 % Trip Denials (ADA) Y
service cannot be adequately provided.
X
Percentage of total one-way trips per
month departing a terminal or leaving an
2 10 % On-Time Performance intermediate time point five or more
Y X
minutes late.
Vehicle miles traveled during a defined
Miles between incidents (#Collisions/Customer
2 11 Y period, divided by the number of Y NTD X
Incidents) collisions/customer incidents.
S: # of Complaints
2 12 Complaints/Million Passengers Y
& # of PSRs
X X
2 13 Commendations/Million Passengers Y X X
The average time a customer has to wait to
2 14 Call Center Average Wait Time get a response from the call center.
X
2 15 % Calls Handled by Automated Information X
# of calls made to customer service center
2 16 % Lost Calls in shich the customer hangs up prior to X
being connected with an agent.
2 17 Response Time to Passenger Complaints Y X
2 18 • ADA Compliant Response Time X X
2 19 • Paratransit Assessments Completed On-Time X
-A1-2004 Strategic Plan KPIs Evaluation
Currently
KPI # for Vital Comments: If not currently reported, please explain why this KPI is not
2004 SP Currently Reported Currently Previously Previously Never Never
indicated Key Performance Indicators (KPI) Statistic Definition reported. If currently reported, please relay any concerns about the use of this GM LC A FI PL OP MC FA EC
Goal # Reported in KPR? Elsewhere? Collected? Reported? Collected? Reported? Collected?
Goal # (Y/N) statistic or the accuracy of the estimate.
Where?
2 20 Age of Transit Vehicles X X X
2 21 % Graffiti Removed within 48 Hours X
2 22 % Stations Cleaned On-Time X
2 23 % of Bus Shelters and Benches X
S: # of reported
2 24
# / Type / Location of Crimes Committed on RT Y
crimes, # & % of
X
System security related
comlaints.
2 25 Lost Time Accidents (per 100 Employees) Y X
2 26 Fare Evasion Rate X
C: % inspected &
2 27 • # Customers Inspected ridership estimates
X
2 28 • % Inspected without Proper Fare X
2 29 • % Cited for Fare Nonpayment Y X
3 Ridership Average (# Passenger Trips/Million)
• Daily Ridership (Weekdays, Saturdays,
3 1 X
Sundays/Holidays)
3 2 • ADA Passenger Trips X
The proportion of people who use transit in
3 3 Transit Mode Split comparison to the people who use other X
modes of transportation.
# of Environmental Initiatives developed or
3 4 Unknown X X X X X X X X X
Supported by RT Annually ? ? ? ? ? Data not collected or reported from Admin Division.
Transit Service Availability within 1/4 mile of “high Planning has
3 5 Title VI Fixed Facility Impact Analysis ? X
transit need zones” Title VI Yes ? Yes Data not collected or reported from Admin Division.
# / % Eligible Employees Receiving Timely
4 1 No No X X X X X X X X X
Performance Evaluations No No No Yes Yes Evaluations performed sporatically throughout the District.
4 2 # / % Employee Turnover As requested HR Dept X X X X X X X X X
As needed As requested As requested Data is reported as requested by GM/EMT. Data not regularly reported.
4 3 # Employee Suggestions No No Employee suggestion program officially exists byt is rarely used. Suggestions X X X X X X X X X
No Unknown Unknown are collected and reviewed by HR staff.
4 4 # / % Employee Suggestions Implemented X X X X X X X X X
Am still working on determining a response (HR issue)
# / % Employees Completing Customer Service
4 5 X X X X X X X X X
Training Data not collected or reported from Admin Division.
# / % Employees Receiving Skills Training
4 6 X X X X X X X X X
Annually Am still working on determining a response (HR training issue)
# / % RT Managers and Supervisors Completing
4 7 X X X X X X X X X
Core Don't understand the KPI. "Completing Core" what?
4 8 Management/Supervisory Training Modules X X X X X X X X X
Am still working on determining a response (HR training issue)
% Annual VTT Operator Training Completed On- Data not collected or reported from Admin Division. This is an Operations
4 9 X X X X X X X X X
Time Division question.
RT Compensation at Median of Local The District periodically has a salary survey performed on all union and non-
4 10 No No X X X X X X X X X
Governmental/Peer Transit Labor Market Yes No Yes Unknown Unknown union positions. Contract managed in HR.
% Core Positions (management/technical skills) A Succession Plan for core positions has never been established /
4 11 No No X X X X X X X X X
Covered by Succession Plan No No No Yes Yes implemented.
% Core Positions with Established Competency-
4 12 No No X X X X X X X X X
Based Model No No No Yes Yes No positions have been established on a "Competency Based Model".
4 13 Accomplishment of EEO/AA Program Goals Y Unknown EEO/AA Officer X X X X X X X X X
Yes Yes Yes Reported through the GM's office
5 1 No Code of Ethics Violations Unknown Legal Office? X X X X X X X X X
Unknown Unknown Unknown This would be reported out of the Legal Office
5 2 No Conflict of Interest Policy Violations Unknown Legal Office? X X X X X X X X X
Unknown Unknown Unknown This would be reported out of the Legal Office
# / % of Management/Supervisory Employees and
5 3 RT Board Members Trained on RT Ethics and No No HR collects and reports as requested. Not reported on a regular or consistent X X X X X X X X X
As needed As requested Yes basis.
Conflict of Interest Policies
5 4 Unqualified External Annual Financial Audit Report Unknown X X X X X X X X X
Finance Division ?
-A2-You can also read