Strategic Transformation of Ford Motor Company
←
→
Page content transcription
If your browser does not render page correctly, please read the page content below
Strategic Transformation of
Ford Motor Company

     A project submitted in partial fulfillment of the requirements for
     the degree of Master of Science (Natural Resources and
     Environment) at the University of Michigan
     December, 2006
     Tom Gladwin, Advisor

                                                       John Gearen
                                                        Sarah Hines
                                                   David Hobstetter
                                          Sathyanarayanan Jayagopi
                                                  Nikolaos Meissner
                                                     Josh Nothwang
                                                   Karen Putterman
                                                 Mitsuyo Yamamoto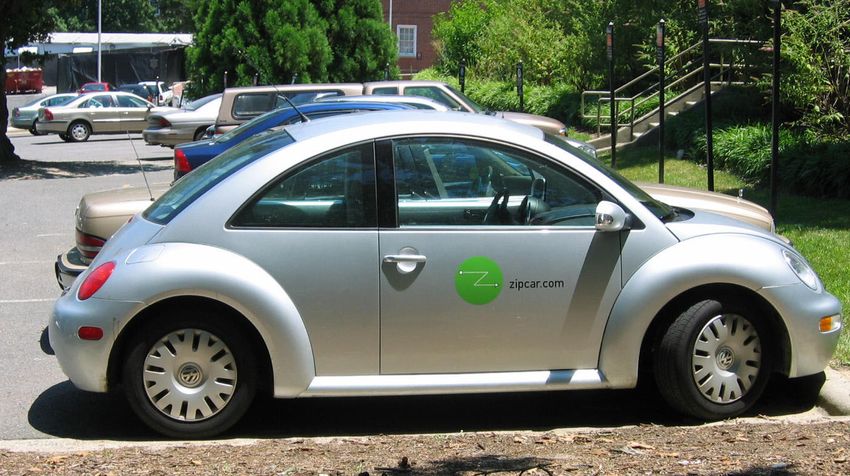
Strategic Transformation of
Ford Motor Company
From Understanding New Mobility to an
Analysis of Five Urban Markets
December 13, 2006

Ford Motor Company
University of Michigan

                         1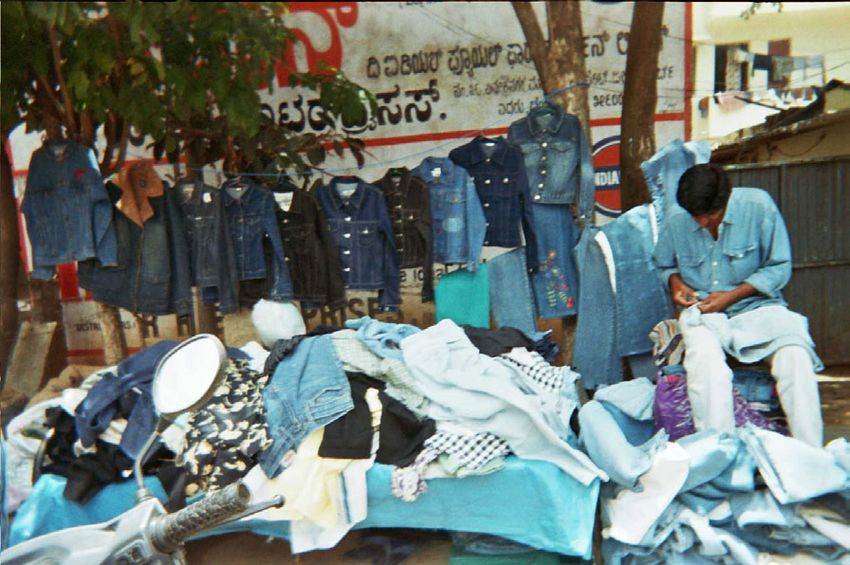
Table of Contents

Executive Summary........................................... 3

Acknowledgments ............................................. 4

Introduction ...................................................... 5

Methods ........................................................... 18

Case Study: Bangalore, India ......................... 20

Case Study: Camaçari, Brazil .......................... 30

Case Study: Hermosillo, Mexico...................... 36

Case Study: Istanbul, Turkey.......................... 47

Case Study: Shanghai, China .......................... 57

Results ............................................................. 67

Discussion and Analysis .................................. 71

Appendices ...................................................... 77

Endnotes .......................................................... 91

                                            2
Executive Summary

   New Mobility is a relatively new term used to represent an exciting and imminent reality. Our
   individual and societal transportation needs are complex and rapidly-evolving, while being
   shaped, constrained, transformed, and defined by a host of global pressures and trends.
   Within this context, New Mobility offers a fresh understanding of how we can meet
   transportation needs for both people and goods through an integrated network of products,
   services, and information technology.

   As the concept of New Mobility begins to take root, certain human-induced trends are putting
   unprecedented pressures on our global society. “Megatrends” such as climate change,
   increasing social disparity, shifting demographics, urbanization, and congestion are affecting
   the rate and degree to which populations, regions, and economies can grow and prosper.

   This project builds on the work of previous groups, including the Canadian think-tank Moving
   the Economyi and a group of three University of Michigan graduate students who, in 2005,
   produced a report for Ford Motor Company entitled New Mobility: Future Opportunities for
   Ford as a Mobility Integrator.

   Our team consists of eight MS students at the School of Natural Resources and Environment
   at the University of Michigan. Through a combination of primary and secondary research, we
   surveyed the current and future potential for New Mobility products, services, and
   technologies in five global cities, vis-à-vis the growing urgency of addressing the
   aforementioned megatrends. Our results from each city combined a conventional Market
   Attractiveness Analysis with a progressive New Mobility Market Analysis. We then overlaid
   these results with Ford’s specific strengths, core competencies, and leadership potential in
   each of the five cities. In so doing, we have created a novel new approach to business
   project evaluation.

   Our results indicate that Bangalore, India is the most attractive New Mobility market, due not
   only to the overall market size, but also to the transportation infrastructure gap which is
   rapidly emerging as Megatrend pressures intensify. However, our Discussion & Analysis
   section identifies a number of other key factors for Ford to consider when selecting how,
   when, and why to assume a leadership role in the New Mobility Market.

                                           3
Acknowledgments

   From Ford Motor Company:
   Dave Berdish

   From the University of Michigan:
   Tom Gladwin, Sue Zielinski

   From Bangalore:
   Swati Ramanathan, Ravichander, Jude Fernadez, R.S. Manjunath, Mr. Muralidharan, Kumar,
   Vikram Vilas Bidi, Sandeep N., Beena, Jayagopi Mannar,Hari Krishnamurthy, Latha Hari,

   From Hermosillo:
   Evert Gutierrez, Karem Pacheco, Cesar Bacerra, Rafa Salazar, Rodolfo Lopez, Juan Najar,
   Carlos Gabriel Labrada, Jose Carrillo Atondo, Angel Lopez Guzman, Jesus Cazares

   From Istanbul:
   Ann Larimore, Necat Sehun, Nazmiye Özgüç, Arda Ibikoğlu, Murat Guvenç Elif Ozgen, Sibel
   Koyluoğlu, Barış Yazıcıoğlu,

   From Shanghai:
   Haixiao Pan, Chen Xiaohong, Wei-Shiuen Ng

                                         4
Introduction

Evolving Transportation Needs

          At one time, a single transportation system may have been sufficient to meet society’s
          mobility needs. However, rapidly evolving needs and previously unanticipated demands
          have continued to shape the profile of mobility in both developed and developing countries.
          Figure 1 details this evolution.

     Figure 1.

     The evolution of
     transportation.

                                                  5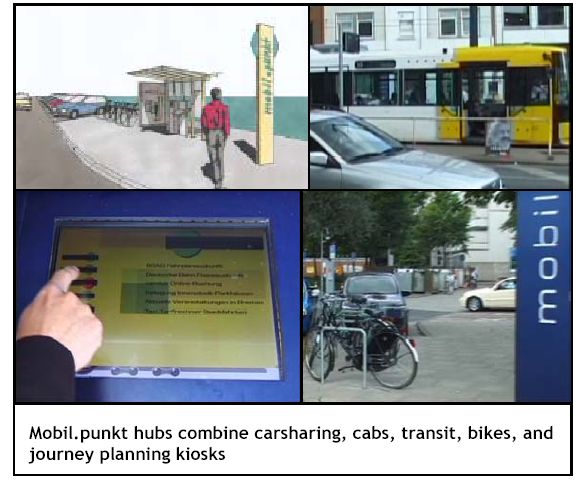
What is New Mobility?

       New Mobility is a relatively new term used to represent an exciting and imminent reality. Our
       individual and societal transportation needs are complex and rapidly-evolving, while being
       shaped, constrained, transformed, and defined by a host of global pressures and trends.
       Within this context, New Mobility offers a fresh understanding of how we can meet
       transportation needs for both people and goods through an integrated network of products,
       services, and information technology.

       New Mobility represents a highly-accessible, seamlessly-integrated, multi-modal system that
       meets individual and societal transport needs while minimizing its negative human and
       ecological impacts.ii The advancement of the principles and partnerships which are
       beginning to form the basis of the New Mobility industry has been accelerated by “the
       emergence of new fuel and vehicle technologies, and new information technologies; flexible
       and differentiated transportation modes, services, and products; innovative land use and
       urban design; and new business models.”iii

       The New Mobility industry, and the momentum behind it, first emerged in Europe in the mid-
       1990s, in response to growing concerns that transportation, traditionally a driver of economic
       growth, had begun to hinder and prevent such growth. As individuals, governments, NGOs,
       and corporations began realizing that congestion, climate change, and other factors would
       only continue to restrict economic growth and social well-being, the concept of New Mobility
       began to take root.

       It is important to note that New Mobility is just as much about moving ideas as it is about
       moving people and goods. Business partnerships and integrated information technology
       systems form the glue of a New Mobility infrastructure. While it is important to understand
       this broader definition, in this report we focused exclusively on the benefits that New Mobility
       could have for the movement of people. We define New Mobility as having the following five
       key characteristics:

           •   Reliability
           •   Affordability
           •   Accessibility
           •   Innovation
           •   Integration and Flexibility

       A sixth and overarching component to New Mobility is the concept of sustainability. We
       examined sustainability in the context of five “Megatrends” which we believe are, and will
       continue to significantly impact cities, regions, and our global society.

                                                6
Each of these New Mobility factors and the five Megatrends are defined and explained in
more detail below. These components form the basis for our understanding of how well (or
poorly) the mobility infrastructure is and will continue to function vis-à-vis Megatrend effects in
each city.
New Mobility: Five Key Characterisitcs
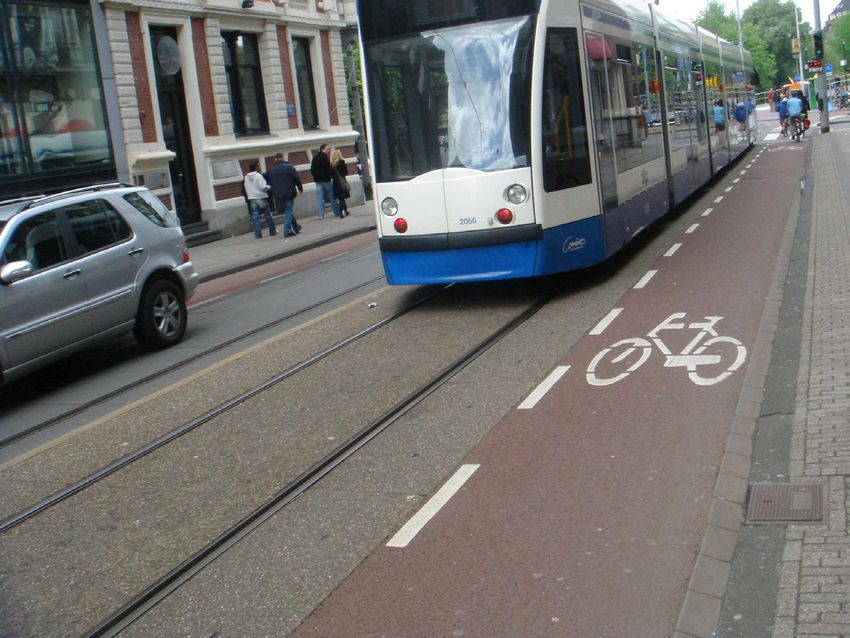
Reliability
New Mobility features reliable transportation systems that can be trusted to arrive safely and
on time. In Bogota, TransMilenio busses have dedicated lanes and exclusive right of way,
which helps to minimize delays. In addition, the bus operations are controlled and tracked in
real time with an extensive technology system.iv
v
Exclusive TransMilenio lanes in Bogota, Columbia
Affordability
Mobility options should be affordable to 100 percent of the population of towns and cities. In
Quito, Ecuador, where 1.5 million inhabitants live in a slim valley of the Andes, average
workers earn US$45 a month and only ten percent own cars. In order to cater to the rest of
the population, the city began running the Trolebus system in 1996. Customers are charged
US$0.25 which is sufficient to cover all operating costs and most capital costs. The system
carries an average of 230,000 passengers on weekdays.vi
7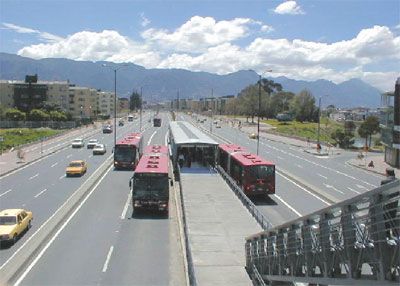
vii
                                                                                                 Quito’s Trolebus

Accessibility
         While this factor definition certainly includes and prioritizes accessibility features for elderly
         and handicapped citizens, it actually encompasses a much broader perspective. In New
         Mobility systems, accessibility also refers to “what and how much people can accomplish
         within a given timeframe and budget.” Greater accessibility can be achieved not only through
         seamlessly integrated, multi-modal transportation systems, but also through innovative and
         progressive urban layout and design, smart land-use practices, and reliance on information
         technology that can reduce or eliminate the need for mobility. “This approach favors social
         equity and environmental sustainability over speed and distance.”viii

                                                               Overall accessibility in Amsterdam, the Netherlands.

                                                   8
Innovation
          New Mobility is characterized by product, service, and technological innovation. New Mobility
          systems should capitalize on what is most progressive and innovative about our cultures and
          societies so as to better design and implement improved infrastructure. For example, Zipcar,
          the largest car-sharing company in the United States, offers a unique mobility solution;
          customers in many major US cities can access and use strategically parked cars at their
          leisure, without purchasing the whole vehicle. Zipcar’s business model reduces pollution and
          congestion and, for many users, eliminates the need to purchase a car. Zipcar estimates that
          40 percent of its customers refrain from purchasing a car or sell their car once they join.ix

                                                                                                                  x
                                                                 Zipcar parking spot in Chapel Hill, North Carolina

Integration & Flexibility
          Integration and flexibility are perhaps the most critical components to a New Mobility system.
          Integration – facilitated by information technology services – is the “glue” which connects all
          of the pieces of a New Mobility system into a progressive, flexible transportation
          infrastructure. In flexible mobility environments, users are able to choose from different
          mobility options and are able to change from different modes or types of transportation
          seamlessly. For example, a commuter in Bogota, Columbia can ride one of the city’s
          TransMilenio rapid transit express buses into a large bus hub and transfer to a local bus with
          an electronic card.xi

                                                   9
xii
TransMilenio bus, hub and payment turnstile in Bogota, Columbia
An example of Bremen’s Integrated Mobility Hub. Bremen, Germany.
While each of these factors represents a critical component of New Mobility, it is important to
realize that successful New Mobility paradigms require that all of these factors work in
synergistic coordination.
10New Mobility: Sustainability and the Five Megatrends
A sixth and overarching component to the concept of New Mobility is the notion of
sustainability. Although variably defined, “sustainability” was most famously articulated in
1987 by the UN World Commission on Environment and Development (WCED), chaired by
Gro Harlem Brundtland, as: “development that meets the needs of the present without
compromising the ability of future generations to meet their own needs.” xiii
The business of mobility, as it now exists, is far from sustainable. If the status quo persists,
the demand for personal and goods transport will continue to increase, as will levels of
transport-related emissions, congestion, vehicle-related deaths, noise pollution, and
xiv
ecological degradation. Although millions of new middle-class consumers in tiger
economies such as India and China will increasingly be able to afford access to personal
mobility options, a significant portion of the world’s growing population of poor will continue to
be excluded from mobility options. All of these factors will detract from the ability of future
generations to live and prosper in an ecologically healthy and socially stable world.
Our team engaged in multiple brainstorming and systems-thinking exercises to better define
“sustainability” as it relates to the five previously-defined components of New Mobility. We
generated a list of dozens of factors that either are currently or will imminently affect mobility
systems on a personal or societal level. With the help of our advisors, we distilled this list into
five factors – or megatrends – which will be most influential in shaping the course of societies
and civilizations within the next three decades. We then overlaid our site-specific research
with these five “megatrends” to better understand the complicated forces currently shaping
the future of the mobility landscape. The five megatrends are as follows:
Climate Change and Environment
Global climate change – caused by human combustion of fossil fuels and the resulting
emission of greenhouse gases (GHGs) – is a critical global issue with a range of potential
effects on human health, community infrastructure, ecosystems, agriculture, and economic
11activity. There is no longer debate regarding the issue – global temperatures are rising, and
will continue to rise if no action is taken. Society faces an urgent and difficult challenge: to
protect ourselves, the economy, and the environment from the impacts of climate change we
must stabilize concentrations of GHGs in the atmosphere to levels that prevent interference
with the global climate system. This requires a change in how we power the economy – away
from centuries of fossil fuel use and towards more efficient and renewable sources of energy.
There are vast challenges – and opportunities – to adopting this change, which will require
engagement by all aspects of society.
Urbanization
The world has experienced unprecedented urban growth in recent decades. In 2000, 47
percent of the world’s population – or 2.8 billion people – lived in urban areas. To put this in
perspective, in 2000, there were 411 cities with over one million inhabitants, housing 39
percent of the world’s urban population. At the same time, 15 percent of the world’s urban
population lived in agglomerations of five million or more. The number of cities with more than
five million residents will grow from 41 in 2000 to 59 by 2015; of these cities, 48 will be
located in less developed countries. As this trend continues, megacities (cities with
populations of more than 10 million) will become more common, rising from 10 in 2000 to 23
by 2015. The trend toward urbanization is fueled by both population growth in urban areas
and migration from the countryside to the city in search of a better life. Nearly all of the
expected world population growth during 2000-2030 will be in urban areas.
There are significant differences in patterns of urbanization between the more and less
developed regions of the world. While more developed regions are about 76 percent urban,
only 40 percent of less developed regions are urban. However, urbanization is occurring
rapidly in many less developed countries. It is expected that 60 percent of the world
population will be urban by 2030, and that most urban growth will occur in less developed
countries.
12In contrast to the rapid rise of the world’s urban population, the growth of the rural population
has been slowing markedly during the latter half of the twentieth century, reaching 3.2 billion
by 2000. There will be no net rural population increase from 2000-2030. Further, the most
recent World Urbanization Prospects report published by the United Nations in 2005 predicts
that the rural population growth rate will begin a slow decline post 2015, which would
eventually lead to a net decrease of the rural population post-2030. xv
Shifting Demographics
According to the United Nations Population Medium Growth Scenario, world population will
grow from 6.1 billion in 2000 to about 9
billion in 2050. About 99 percent of these
additional 2.9 billion people will be born in
the less developed regions. Yet, while
world population is expected to grow
throughout the 21st century, annual growth
rates have slowed substantially, reaching
an average of 1.22 percent for the period
from 2000-2005, compared to an average
rate of 1.76 percent for the period 1950-
2000. By 2045-2050, the annual growth
rate is expected to amount to only 0.3
percent.
As world-wide fertility rates continue to
decrease and life expectancy at birth to
increase from 2000-2050 – with the exception perhaps of Sub-Saharan Africa – the world
population will continue to age. In 2000, the median age in more developed regions was 37.3
years, compared to 24.1 years in less developed regions and 18.3 years in Africa. By 2050,
more developed regions are projected to rise to about 47 years, less developed regions to
about 35 years, and Africa to 27 years.
Social Disparity
While significant divides have
always existed between rich
and poor, many economists and
historians believe that global
income inequality is currently
greater than at any other time in
history. Adjusting for purchasing
power, the richest 25 percent of
the world’s population owns 75
percent of its wealth; more
significantly, the richest one
percent of the world’s
The Gini coefficient is a number between 0 and 1, where 0 corresponds with perfect economic
population owns as much equality, and 1 corresponds with perfect inequality (where one person has all the income, and
everyone else has zero income). Countries in red tones have more income inequality than those
wealth as the amassed wealth in green tones.
13of the bottom 57 percent of the world’s people. In the United States, the incomes of families
in the bottom 80 percent of the income distribution have grown at less than one percent
annually, while the incomes of the richest 20 percent have grown at three percent, with those
at the very top experiencing almost exponential growth – in 1980, corporate CEOs earned
roughly 42 times the salary of the average American worker, while today the average CEO
earns over 530 times the average worker’s salary. Similar extremes are prevalent in other
nations – in sub-Saharan Africa and Eastern Europe, real incomes have actually fallen over
the past 30 years, to say nothing of purchasing power parity incomes.
Such huge inequalities are beginning to serve as threats to national and global political and
economic security. Backlashes toward corporations perceived to be unjust or irresponsible
global citizens have begun to occur in the past decade, most notably in the US and Europe,
but also in Latin America and Asia. As the philosopher Plutrarch wrote almost 2000 years
ago, "An imbalance between rich and poor is the oldest and most fatal ailment of all
republics." Ensuring that the world’s citizens can achieve the economic means by which to
fulfill their basic needs is the most basic insurance policy against instability.
Congestion
There exists a direct correlation between Gross Domestic Product (GDP) and traffic
congestion – as countries become wealthier, individual citizens are increasingly able to afford
individualized
transportation, often in the
form of cars. Generally,
motorization rates begin to
significantly increase once
per capita GDP reaches
$5,000. Indeed, many
countries view motorization
rates as a key indicator of
development, progress, and
economic growth. Yet the
capacity of public
infrastructure is rarely able
to keep pace with
motorization rates: building
enough capacity to eliminate congestion would, in almost all situations, involve economic and
environmental costs that would far outweigh the associated benefits of increased personal
mobility. Despite this, governments are either passively or actively supporting policies that
encourage individual vehicle ownership. In 2001, the government of China identified auto
manufacturing as one of seven "pillar industries" of the Chinese economy, with the goal of
producing automobiles at a price that would "encourage widespread ownership." Although
China often receives the most attention, other nations in Asia and Latin America also have
soaring rates of personal vehicle ownership, even at a time when fuel prices are rising. A
2005 estimate predicts that the number of automobiles in the world is expected to double in
the next 15 years, from just over 600 million currently, to 1.3 billion in 2020.
14Although individualized forms of transportation will always have a place in our global society,
actively defining the role that cars will play is of utmost importance. Congestion pricing is one
measure that some cities – including London, Oslo, and Toronto – are using as a means to
reduce congestion. By employing recent technology to charge road users a variable fee
depending upon the amount of traffic already on the road, the individual driver is forced to
pay the full cost that (s)he imposes on other drivers – in this way, price equals marginal cost,
and demand and supply in theory reach equilibrium. Other innovative solutions to traffic
congestion include creating integrated public-private transportation networks and employing
car-sharing, among others.
The Business Case for New Mobility
Innovative companies are realizing that a new, exciting, and relatively untapped market exists
around the concept of new mobility. Whereas mobility has traditionally been equated with per
capita purchases of motor vehicles, solutions that incorporate mobility services can be just as
effective, more flexible, and less expensive. As this sector is yet-untapped, huge business
and profit potential exists for any company that is able to access, understand, and adequately
serve this market, whether by providing new mobility services, or by acting as the facilitator
and integrator of new and existing mobility options.
Meanwhile, if left ignored or unaddressed, the megatrends described above will generate
enormous negative consequences for business and society. These negative impacts may
not be immediately noticeable on a global scale, but on a local or regional level, certain
countries and cities will lose if business if political leaders are not proactively anticipating and
responding to trend effects. The consequences of some trends multiply as they are coupled
together. For example, the growing trend toward urban living in almost all regions of the
world, coupled with increased congestion caused by skyrocketing auto sales has the potential
to debilitate more traditional urban transportation infrastructure schemes in just a few short
years; the city of Bangalore, India, is just one example of this. Shifting demographics and
issues surrounding social disparity make a formidable megatrend couple: as large portions of
the population demographic age, less-agile senior citizens - many no longer able to drive -
will lack access to suitable forms of transportation; this promises to be one of America’s most
pressing transportation-related concerns as those of the baby-boom generation become
senior citizens.
Finally, and perhaps most significantly, the reality of climate change is quickly being accepted
by governments, businesses, and individuals alike as one of the most pressing issues
currently facing humanity. Response currently appears to be unhurried and gradual, as
consequences remain relatively intangible in the short-term; however, as the scientific data
becomes more certain, evidence mounts, and predictions become reality, the reaction from
all sectors of society will be swift and revolutionary. Those businesses that have not already
begun to incorporate cradle-to-cradle design, carbon credits and trading, and low- or no-
emissions products and services into their business models will undoubtedly be left behind in
the short-term, and will cease to exist in the longer-term. The long-term health and success
of a company greatly depends on its ability to anticipate solutions to tomorrow’s problems,
and begin delivering them today.
15While megatrend effects promise to revolutionize the way many companies do business, they
are not the only factors lending credence to the business case for New Mobility. The
traditional automobile industry is becoming crowded with low-cost competitors and stymied
by overcapacity. Traditional economic theory suggests that as automobiles become
increasingly commoditized, profits in the industry will shrink to zero. In the process,
companies will have to become ever-leaner and wiser or be forced out of the industry
altogether. Profits in the automobile industry, and manufacturing industries in general, are
ever-slimmer; consumers are demanding the most value at the lowest cost, have an ever-
widening array of choices from which to choose, and will direct their money to whichever
company offers the best value proposition at any given moment.
A final factor worth considering involves commodity prices. Commodity prices have always
been subject to minor, if not wild, fluctuations in cost. Especially in recent years, uncertainty
regarding the current and future supply of oil has caused significant fluctuations in the price of
gasoline, thereby affecting consumer purchasing behavior. The price of steel has also been
in flux: more stamping plants have opened, thereby increasing capacity, but the future
demand and supply equation remains uncertain. Whereas businesses cannot and should not
base their business models entirely on commodity forecasts, the increasing prices of these
raw materials, especially as they are likely to affect consumer behavior (as in the case of
gasoline) is worth considering.
Discovering New Markets: The Expanded Economic Pyramid
Another component to the business case for new mobility is rooted in the untapped potential
of markets which include consumers in the “expanded economic pyramid”. The expanded
economic pyramid can be thought of as a broader interpretation of the “Base of the Pyramid”
and consists of the approximately four billion people worldwide who subsist on only a few
dollars per day. Traditionally, these consumers have been underserved at best, and often
completely ignored by modern corporations; many companies currently or have previously
viewed these individuals – the majority of the human population – as unfortunate or
unmotivated “victims” of poverty, with little to contribute to the market economy. Some
companies, however, have begun taking a more compassionate, holistic, and accurate view
of this market segment. Such companies have begun to understand that many of these
individuals are creative and ingenious entrepreneurs who have much to give and gain by
being included in the global marketplace, and that they are eager to purchase products and
services designed to fulfill their needs. By co-creating mobility solutions based upon the self-
identified needs of people in specific cities and regions, companies have the potential to
empower and improve the lives of millions of previously ignored individuals while earning
access to new multi-billion dollar market segments.
The Business Case for Ford
For the past century, Ford has been a dominant player in the automobile manufacturing
industry. However, the pressures facing businesses in the coming century will be completely
unlike those conditions that prompted and accompanied the birth of the industrial revolution.
While automobile sales in the developing world are rapidly increasing, sales in the developed
world have remained relatively stagnant. Even developing world markets are becoming
saturated, and many environmentalists and policy analysts bemoan the fact that these
16countries are following in the footsteps of developed nations, and making the same mistakes
with respect to developing incredibly costly, environmentally destructive, individually-based
transportation infrastructure.
There is a huge potential for significant innovation within the transportation industry, and few
major companies are seeing the market potential. A recent report of by Moving the Economy
and the ICF Consulting Company indicates that New Mobility products and services already
comprise a multi-billion dollar market. The industry is still nascent, yet beginning to grow
rapidly; the value of the integrated technology services market alone is expected to reach
US$13 billion by 2010.xvi Instead of focusing solely on the battle to sell more personal
vehicles, Ford could create and develop entirely new types of mobility markets: Markets
designed to serve a greater portion of the economic pyramid, with a greater and integrated
array of both individual and group-based transportation products and services that help
alleviate negative megatrend impacts. Ford is uniquely positioned to launch into these
exciting new markets: With its impressive international presence, unsurpassed human rights
code, emphasis on Corporate Social Responsibility and leadership, ability to forge and
maintain mutually beneficial relationships with other businesses and leading environmental
and human rights NGOs alike, and newly-defined focus on “Bold Moves,” it is the ideal time
for Ford to transform itself from its current state as a developed-world automobile
manufacturer into a leader within the integrated New Mobility market.
Many of Ford’s specific organization and managerial opportunities and challenges in the New
Mobility market space will be defined vis-à-vis our city research and results. These findings
will be discussed in more detail in the Discussion & Analysis section, toward the end of this
document.
17Methods
Our eight-student team combined secondary background research with on site observations,
interviews, and expert consultations in five global cities so as to develop individual case write-
ups on the current state of mobility in these areas. Whenever possible, we tried to interview
Ford employees and managers in each of these locations. However, because of specific
Non-Disclosure Agreements and other restrictions on information exchange, we were not
able to conduct very many of these interviews.
Team members spent five to eight days on-the-ground in: Bangalore, India; Hermosillo,
Mexico; Istanbul, Turkey; and Shanghai, China. Because of extenuating circumstances, we
were unable to visit Camaçari, Brazil, and instead conducted all research remotely. We
overlaid Conventional Market Research data with our Mobility and Megatrend findings in
each city to determine where the biggest gap exists between current mobility infrastructure
and anticipated megatrend impacts. Our Results and Discussion & Analysis sections detail
our findings and recommendations.
We chose our five research sites in conjunction with members of the Sustainable Business
Strategies Office (SBS) at Ford Motor Company; we chose these particular cities either
because of Ford’s already strong presence in the region, or due to their potential to become
explosive New Mobility markets.
Once we identified our “case study” cities, we engaged in multiple brainstorming and
systems-thinking exercises to understand, explain, and define New Mobility and to determine
the “Megatrends” that will most affect the future of mobility.
To further our understanding of integrated New Mobility concepts and related business
opportunities, we relied heavily on a report entitled New Mobility Strategy, which was
produced for Ford by a team of three University of Michigan graduate students in the summer
of 2005. We also explored successful case studies and previous examples of New Mobility
market development and business model approaches; the majority of these were developed
by Moving the Economy, a Canadian public-private consortium and think tank that catalyses
integrated New Mobility innovation and business model development.
To better understand what trends are currently shaping and will continue to shape our global
society, we generated a list of over one hundred factors that are currently or will imminently
affect mobility systems on a personal or societal level. With the help of our advisors, we
distilled this list into five “Megatrends” which will be most influential in shaping the course of
societies and civilizations within the next three decades.
18In order to give on-site team members a common basis for observation and comparison, we
designed New Mobility and Megatrend matrices (Appendix 2) that solicited both qualitative
and quantitative research data, and crafted corresponding interview questions. Whenever
possible we tried to use standardized data from a common source. For example, we relied
on the CIA World Factbook for information regarding GDP and GDP at Purchasing Power
Parity (PPP) in each of our focus regions, and we used the Gini coefficient as a means by
which to measure regional socio-economic disparity. The Gini coefficient is a mathematical
ratio often used to measure the disparity in a system. In the case of income inequality, a “0”
represents perfect income equality, whereas a “1” represents perfect inequality.
Once on site, team members had to cope with different languages, logistic challenges, and
time constraints. These factors affected our research methods and the amount of information
we were able to gather in each city. For example, our Shanghai-based team member spoke
some Mandarin and was able to survey approximately 50 individuals; our Hermosillo-based
traveler relied on a translator and was able to survey approximately 20 individuals. Although
the on-site methods varied slightly, the matrices and interview questions created a strong
basis for comparison.
Finally, for each city, we distilled the data from each of the qualitative/quantitative matrices
into a multi-dimensional diagram so as to understand the current performance of mobility
systems and severity of megatrend impacts. (Appendix 5). We considered the city with the
largest gap between current mobility infrastructure and future megatrend effects to have the
biggest opportunity for improvement. We overlaid these results with a Conventional Market
Attractiveness Analysis. The cases are – and were designed to be – non-company specific.
The cases merely represent the size and attractiveness of a generic potential New Mobility
market. Overlaying these nonspecific results with information regarding Ford’s particular
strengths formed the basis for our Discussion & Analysis.
19Case Study: Bangalore, India
1 Introduction
Situated on the Mysore Plateau in southwestern Karnataka, Bangalore is the principal
administrative, industrial, commercial, educational, and cultural capital of the Indian state of
Karnataka. Bangalore enjoys a pleasant climate, making it a desirable place to live in India.
Within the past decade, Bangalore has established itself as a leading global provider of
information services and technology. As the innovation hub of India, Bangalore has
experienced a recent explosion in both population and economic growth. With a population of
6.5 million, Bangalore is India's third largest city and fifth largest metropolitan area. It is one
of the 100 fastest growing urban areas in the world, with an expected growth rate of 2.8
percent per year over the next fifteen years; at this rate Bangalore will reach megacity status
of 10 million by 2020.xvii The average population density in Bangalore is 2,985 persons per
square kilometer.
With its US$47.2 billion economy, Bangalore is one of the major economic centers in India.
Yet, Bangalore is in many ways a divided city: glass walled computer-ready office complexes,
and exclusive shopping malls and entertainment facilities stand in stark contrast to the dense
squatter settlements and shanty towns, most of them completely lacking in infrastructure,
which lie at the city’s center. Estimates suggest that ten to 25 percent of the city’s residents
live in slum-like conditions.xviii, xix Bangalore's per capita income of US$6,460 is the highest
for any city in India.xx
Prior to 1990, Bangalore was a manufacturing hub for heavy industries such as aeronautics
and electronic equipment manufacturing. The liberalization of the Indian economy in the
early 1990’s catalyzed tremendous growth in the information technology (IT) industry.
Adequate infrastructure, a highly-skilled labor force, an established science and industrial
base, and an overall favorable climate for living enabled the booming growth of the IT sector
in Bangalore. Today, Bangalore is India’s IT center, with offices of technology companies
such as Microsoft, Intel, Yahoo, Google, Wipro, and Infosys. Bangalore is home to more than
300,000 IT workers, and the city accounts for 38 percent of India's US$22 billion IT and
software export market.xxi
The Bangalore Mahanagara Palike (BMP, or Bangalore Metropolitan Council) is the
municipal corporation responsible for the city’s civic and infrastructural assets. The BMP
comprises 100 elected representatives, called “corporators,” one from each of the 100 wards
of the city. Elections to the council are held once every five years, with results being decided
by popular vote. Bangalore's rapid growth has created several problems relating to traffic
congestion and infrastructural obsolescence that the BMP has found challenging to address.
The council coordinates with the Bangalore Development Authority (BDA) to design and
implement civic projects and infrastructure systems. The BMP has been criticized by the
Karnataka High Court, citizens, media, and corporations for failing to effectively address the
capacity-strained and crumbling road and traffic infrastructure of Bangalore.
20Bangalore’s old reputation as a “pensioner’s paradise” has long vanished, replaced by a
bustling industrial megacity that attracts thousands of young professionals from all parts of
India. Approximately 65 percent of Bangalore’s population is between fifteen and 65 years
old, with 20 percent below age 15. The median age of the city is just under 25 years.xxii
Bangalore’s road system is resembles a
star-like structure with main arterial roads
leading from the outskirts to the center of
the city. There is a marked lack of
interconnections between these main
arterial roads, which is a contributing
factor to the gridlock many of the arterial
roads and intersections are suffering from
during traffic peak hours.
Bangalore’s street space provides more
than a conduit for traffic; it enables much
of the local economic activity on which the
majority of the city’s population depends.
Street vendors of all sorts, small service
businesses such as bicycle and
motorcycle repair shops are as much part
of the street space as a large variety of
motorized and non-motorized vehicles for
movement of people and goods. Streets
are also a social space where many
people live and others get together with
family, friends and neighbors.
Public transit buses and two-wheelers,
primarily mopeds and motorcycles, dominate Bangalore’s transportation system accounting
for 49 and 36 percent of the city’s daily passenger trips, respectively. However, with
phenomenal growth in the purchase of private vehicles, estimated at 700 to 900 vehicles per
day, and the inability of the city’s transit systems to provide adequate services, both the poor
quality of roads and problems related to the government bureaucracy will further cloud the
transportation outlook for the city in the short to near-term.xxiii
The city government has attempted to address these transportation issues with a three-
pronged strategy consisting of some elements of public transit expansion, transportation
management initiatives and infrastructure improvements and expansion. The bulk of the
city’s transportation budget has been directed towards improving and expanding roads,
building flyovers and adding buses to the city’s fleet. Additionally, the government recently
approved construction of a US$1.5 billion light rail metro system for Bangalore, which is
modeled after the Delhi metro system and would add a second public transit option to the
city’s portfolio.
Finally, the government is also participating in public-private partnership talks at a summit in
January 2007. The goal of these talks is to establish a public-private partnership with
participation from government, administrative agencies and business charged with preparing
a strategic long-term plan for Bangalore’s future growth, which would include a
comprehensive plan for the development of the city’s transportation system.
212 Current State of Mobility
Introduction
Vehicle ownership in Bangalore has increased tremendously in recent years. A variety of
factors, including the growth of IT sector and the associated growth in population and levels
of disposable income, have contributed to the dominance of the motor vehicle in Bangalore –
automobiles and mopeds are routinely considered the preferred mode of transportation. The
size of the registered vehicle fleet in the urban area reached 2.5 million in 2006, up from
685,000 in 1992 and only 236,000 in 1983. A large majority of private vehicles in the city are
two wheelers and it is estimated that roughly 700 to 900 vehicles are added to the roads
every day.xxiv
To date, the overstrained public bus system remains the only inner-city public transit option.
The city added more than 1,000 buses between 1998 and 2003, bringing its total fleet size to
3,859. Despite this, however, the public bus system is overcrowded and routinely operates at
overcapacity; skipped bus stops and missed schedules are part of the daily routine. Yet,
according to the Bangalore Metropolitan Transport Corporation, fleet expansion is limited due
to the city’s narrow and already congested roads; at best, these roads can only
accommodated another 1,000 buses, but even these would likely only contribute to the
gridlock. The bus system currently operates over 60,000 trips with 3.5 million passenger trips
per day.xxv Upper and middle class residents rarely use the public bus system.
Bangalore’s rapid automobile growth has caused several significant problems, all of which
are of considerable concern to the city’s residents, businesses, and local government.
These problems include severe air and noise pollution, high levels of congestion, a growing
number of often-fatal road accidents, and a severe loss of business productivity due to long
commute times.
Bangalore’s road systems are star-shaped, with radial roads extending outwards from the
city’s center; this layout only exacerbates the above-mentioned traffic-related problems.
Many arterial roads and intersections suffer from severe gridlock and average journey speeds
on the key roads in the central area are below 10 km/h during peak traffic.xxvi
In July 2004, Wipro’s CEO Azim Premji threatened to move company headquarters out of
xxvii
Bangalore because of the city’s poor transportation infrastructure. Also, in August 2005,
the Bangalore Forum for IT (BFIT) – which consists of 18 major multinational IT firms
including Sun Microsystems, Texas Instruments, Philips, HP and Motorola – threatened to
boycott the Bangalore IT convention because of the city's lack of infrastructure-
enhancement.xxviii
The state government responded to these threats and the problem of traffic gridlock by
building flyovers, creating one-way traffic routes, and reducing the size of roundabouts.
However, much of inner city is quite built-up and has very narrow roads to begin with, making
the construction of wider roads and flyovers very difficult.
Recently the city’s bus transit corporation added twenty-five air-conditioned Volvo buses to
attract high end commuters who normally rely on car for their transit. Additionally, the city
added twelve special, female-designated buses in August 2006 to offer women, who
increasingly avoid overcrowded buses, a more attractive public transit alternative. Further, in
order to reduce the pressing traffic gridlock problem in the innermost part of the city, the
government is building a rail transit system called the Bangalore Metro; the first phase is
expected to be completed by 2011.
22Current State of Mobility: Summary of Findings
Mobility Overall
Qualitative Insights Quantitative Data
Factor Ranking
• Because of high density, the general distance • 44 cars per 1,000 residents in 2002; 59 cars
between two points is low per 1,000 in 2006
• For people who rely on public transit system • Car ownership growing at 9.9% per year
their low reliability reduces accessibility • Public transport options:
3,859 buses
60,000 trips
60 passengers per trip
Accessibility • 205 two wheelers per 1,000 residents in 2002; 4
275 per 1,000 in 2006
• Two wheeler ownership growing at 9% per
year
• Percentage of households with:
Two-wheeler: 32.8%
Passenger vehicle: 9.2%
Bicycle: 29.8%
• Reliability is very low because of unpredictable • 9,101 auto deaths in 2004
traffic and road constructions • 903 traffic deaths in 2004
• People prefer two wheelers because of the • Supply-side management practice is
low reliability of public transit system employed
Reliability building flyover 3
reducing the side of roundabouts
widening of roads
• Emphasis on safety is increasing but
enforcement is difficult
• Majority of residents rely on bus and two • Many options available: bus, car, auto-
wheelers rickshaw, two wheelers
• People using the bus have limited flexibility • Percent of transportation by modes:
because of low reliability and lack of Bus: 49%
Integration
coordination among different bus transit 5
and Flexibility Two wheeler: 36%
service
Auto-rickshaw: 7.0%
Car: 5.5%
Bicycle: 2%
• Existing public transit system is fairly • Government subsidizes public transit system
affordable by all and monthly tickets are available at
Affordability • Rising income levels and greater flexibility and concessional rate 4
reliability is increasing the attractiveness of • Predominantly low-income people use bus,
two wheelers which is nearly 50% of commuters in the city
• Summit-level talks in January 2007 • Bangalore Agenda Task Force (BATF) was
• Construction of metro rail formed 2000 to develop innovative solution for
transportation problems
Innovation • Subsequent government change in 2004 led 4
to discontinuation of BATF
• Public-private forum will discuss these issues
in January 2007
Accessibility
High density of inner-city and sufficient bus routes and stops make city’s public bus
system accessible to most, but access to the eight surrounding, high-growth municipalities
remains poor.
Both the city’s high density and a large and affordable public transit system make Bangalore
highly accessible. However, for the nearly 50 percent of the population who rely on the city’s
23public transit system, problems with reliability make traveling within the city difficult. Also,
public transit system buses often operate at over capacity, which increases the physical
strain of traveling in them and becomes a great challenge for women, and the elderly and
handicapped who rely only on public transit system. Furthermore, the public transit system
does not encompass the eight municipalities surrounding Bangalore, where most economic
growth is currently taking place. Thus, a great fraction of the city’s workforce has to rely on
company bus and private vehicle options for their daily commute.
Reliability
Bangalore’s capacity-strained transportation system makes public and private traffic
options unreliable.
The reliability of Bangalore’s transportation system significantly lags that of other major metro
cities. During rush hour, road intersections are often blocked and traffic can be gridlocked for
several kilometers. Congestion has reduced the average vehicle speed from 15 to 18 km/h in
1990 to less than 10 km/h in 2001. Bus riders tend to suffer most from this congestion, as
they rarely know when to expect a bus’s arrival, never mind how to predict how long the
journey might take. Because reliability of the bus services is so poor, many commuters
prefer other modes of travel - primarily two wheelers.
The city government has numerous planned, ongoing, and completed projects – from
widening roads to building flyovers – but these projects have not made a significant impact on
traffic congestion. Moreover, these projects take a long time to complete and further obstruct
traffic while they are in progress.
Integration and Flexibility
While there are a wide range of options, the majority of Bangalore’s population relies on
the public bus system due to budget constraints.
The wide range of options ranging from bicycles to private cars provides numerous options to
the residents of the city. However, a vast majority of city’s population relies on the bus public
transit systems and there are constraints that are associated with this option. First of all, there
are many state-owned entities that operate buses in the city, but there is very little
coordination amongst them which reduces the efficiency of the public transit system in
serving the mobility needs of the people. Also, there are no real-time monitoring and display
systems at bus stops, hence waiting travelers do not know when the next bus will arrive.
These shortcomings reduce the flexibility of public transit systems and increase the
attractiveness of private vehicles for the public transit user.
Affordability
Public bus service is affordable for most, but the new metro rail may be out of reach for
certain customers.
Both the city’s high density and a large and affordable public transit system make Bangalore
highly accessible. However, for the nearly 50 percent of the population who rely on the city’s
public transit system, problems with reliability make traveling within the city difficult. Also,
public transit system buses often operate at over capacity, which increases the physical
strain of traveling in them and becomes a great challenge for women, and the elderly and
handicapped that rely only on public transit system. Furthermore, the public transit system
does not encompass the eight municipalities surrounding Bangalore, where most economic
growth is currently taking place. Thus, a great fraction of the city’s workforce has to rely on
company bus and private vehicle options for their daily commute.
24Innovation
While the new government recently suspended an innovative public-private partnership,
new talks are set to begin in January 2007.
Even though Bangalore is known as “the Silicon Valley of India,” there has been very little
innovation on the part of the city government with regard to solving the city’s mobility
problems. BATF (Bangalore Agenda Task Force) was formed by the local government in
2001 to encourage innovative solutions that addressed Bangalore’s mobility problem, but the
project was discontinued after the change of government in 2004. However, with the ongoing
construction of the Bangalore Metro, and public-private partnership discussions set to take
place in January 2007, there is opportunity to develop innovative services and solutions that
address Bangalore’s mobility challenge.
3 Regional Megatrends
Introduction
Bangalore, the “Garden City” of India, has recently become the "Knowledge City" of India by
housing many top research institutes and information, biotechnology, and consulting firms.
The population of Bangalore has grown from 4.2 million in 1991 to about 5.7 million in 2001,
and it is projected to reach 7.1 million by 2011. Bangalore is often perceived as the city of
future in India. The city has grown from 40 square kilometers in 1912 to 531 square
kilometers in 2002.xxix
The number of vehicles in Bangalore has grown with the city’s population. In 1991 there
were approximately 500,000 two wheelers in Bangalore – in 2006 this number has increased
to 1.8 million, an increase of fourteen percent per year. The number of four wheelers has also
grown in the city, increasing from 100,000 in 1991 to 382,000 in 2006 (an annual growth rate
of 9.9 percent).xxx, xxxi
The meteoric rise of Bangalore to a globally integrated location of the Indian IT industry has
brought profound changes to the metropolitan landscape creating aggravating disparities and
a highly polarized urban society. Bangalore is becoming a fragmented city where both social
and geographical barriers are reinforced. While the small number of affluent urban elite has
benefited from the city’s recent transformations, the urban poor continue to be marginalized.
Additionally, Bangalore’s public infrastructure is strained – the city’s rapid growth over the
past two decades has crippled its infrastructure and deteriorated its air quality. Moreover, the
vast majority of local residents have not yet benefited from the city’s tremendous growth.
25Regional Megatrends: Summary of Findings
Overall
Megatrend Qualitative Insights Quantitative Data
Ranking
• Mostly rich people complain about the air • PM level is160-180 µg/m3, which is three
quality times above the normal ambient air quality
• Government is encouraging LPG driven level
Local Pollution 6
automobiles especially for auto rickshaws • Task Force For Control Of Pollution In
Bangalore City was formed by the
government in 2001
• Social equity is a primary concern of the • 57% of households earned less than
Social government – many feel that the last US$1,100 in 2001 whereas average
9
Disparity government was ousted because of lack of household income was US$2,200 in 2001
attention to poor and rural household
• Population will remain young as many young • 65% of population under 25
Shifting
people from distant villages are migrating to • 10% of population over 65 3
Demographics
the city
• Many new industries have been established • Physical growth 446 square kilometers in 1991
on the city’s outskirts while workers have to 536 square kilometers in 2001
Urbanization 10
remained in the city – this increases demand
for travel and increases overall travel time
• Congestion is severe in Bangalore and is also • Average vehicle speed in city 9 km/hr
one of the major constraints to the growth of • Peak hour traffic volumes in central,
Congestion city intermediate, and peripheral zones were 10
• People from all strata of society complain 10,000, 3,000 to 7,000 and 3,000 to 5,000
about congestion vehicles, respectively
Local Pollution
Strong vehicular population growth and congestion fuel city’s local pollution levels.
Current air pollution levels in Bangalore are comparable to that in an industrial-age steel
town. Vehicular travel is one of the main sources of air pollution in Bangalore, and has
continuously increased during the last decade. Based on data published by KSPCB,
concentrations of sulfur dioxide and nitrogen oxides have continuously declined during the
last five years, indicating that emissions control measures have been very effective. On the
contrary, PM10 levels (a measure of particulate matter, called RPM in India) are almost three
times that of the Indian National Ambient Air Quality Standards (INAAQS) of 60 µg/m 3 in
Bangalore.xxxii
Social Disparity
Overall living standards are rising, but income disparity between the rich and poor remains
stark.
Bangalore, Karnataka’s “boom city” which is most closely associated with a high tech “silicon
valley” image, has also experienced massive urban and economic growth since the mid
1990s. The average household income has increased from about US$1,100 in 1991 to about
US$2,200 in 2001.xxxiii Meanwhile there has been a large decline in the number of
households with annual incomes less than US$1,100, from 87 percent in 1991 to 57 percent
a decade later.xxxiv Despite Bangalore’s reputation as a high tech city it is important to note
that the majority of employment growth comes from small scale units: local economies
actually form the employment base of urban areas in Bangalore. Bangalore is becoming a
multiply divided city where both social and geographical barriers are reinforced. Even more
dramatic differences in social equity exist between the urban and rural households of the
state of Karnataka; much of the government’s attention is now focused on rural development
and economic enhancement.
26You can also read