Structural and optical properties of Nd:YAB nanoparticle doped PDMS elastomers for random lasers
←
→
Page content transcription
If your browser does not render page correctly, please read the page content below
www.nature.com/scientificreports
OPEN Structural and optical properties
of Nd:YAB‑nanoparticle‑doped
PDMS elastomers for random
lasers
Antsar R. Hlil1,2,3*, Jyothis Thomas1, Yalina Garcia‑Puente1, Jean‑Sebastien Boisvert1,
Bismarck C. Lima4, Ando Rakotonandrasana1, Lauro J. Q. Maia5, Amirhossein Tehranchi1,
Sebastien Loranger1, Anderson S. L. Gomes6, Younes Messaddeq2,3 & Raman Kashyap1,3,7*
We report the structural and optical properties of Nd:YAB (NdxY1−x Al3(BO3)4)-nanoparticle-doped
PDMS elastomer films for random lasing (RL) applications. Nanoparticles with Nd ratios of x = 0.2, 0.4,
0.6, 0.8, and 1.0 were prepared and then incorporated into the PDMS elastomer to control the optical
gain density and scattering center content over a wide range. The morphology and thermal stability
of the elastomer composites were studied. A systematic investigation of the lasing wavelength,
threshold, and linewidth of the laser was carried out by tailoring the concentration and optical gain
of the scattering centers. The minimum threshold and linewidth were found to be 0.13 mJ and 0.8 nm
for x = 1 and 0.8. Furthermore, we demonstrated that the RL intensity was easily tuned by controlling
the degree of mechanical stretching, with strain reaching up to 300%. A strong, repeatable lasing
spectrum over ~ 50 cycles of applied strain was observed, which demonstrates the high reproducibility
and robustness of the RL. In consideration for biomedical applications that require long-term RL
stability, we studied the intensity fluctuation of the RL emission, and confirmed that it followed
Lévy-like statistics. Our work highlights the importance of using rare-earth doped nanoparticles with
polymers for RL applications.
There is significant research interest in flexible structured photonic devices based on polydimethylsiloxane
(PDMS)1. In addition to the field of materials science2,3 flexible photonic devices have also raised interest for
bio-medical applications, such as lab-on-a-chip (LOC), electronic skins, and medical p rosthetics4,5. Because of
their promising features such as high flexibility and good mechanical and chemical stability, PDMS-based devices
could be suitable as mechanical sensors. They have also been used as tunable phase masks for writing fiber Bragg
gratings6 and for tunable diffractive optic e lements7. The flexibility and stretchability of these polymers also makes
them excellent materials for random laser (RL) applications, in which lasing is obtained via multiple scattering
in a disordered s tructure8–10. In the b
ulk11, RL emission is obtained via multiple scattering of light emitting in
random directions with very low temporal or spatial coherence12. Recent studies on polymer-based random
lasers have mainly focused on their low lasing threshold and flexibility to realize compact and disposable visible-
wavelength lasers13, which are appropriate for sensing a pplications14. However, they generally suffer from issues
related to the stability of dye based RL s ystems15, which could be overcome using appropriate nanomaterials, such
as ZnO n anoparticles16. To improve the performance of polymer based RLs, more efficient pathways to design
stable systems using rare-earth-doped nanoparticles are necessary. The use of PDMS polymer allows the ease of
material fabrication and processability in view of potential applications along with the use of rare earth materials.
1
Fabulas Laboratory, Department of Engineering Physics, École Polytechnique Montréal, Station Centre‑ville, P.O
Box 6079, Montreal, QC H3C 3A7, Canada. 2Département de Chimie, Faculté des Sciences et de Génie Pavillon
Alexmoura Vachon, Université Laval, 1045, avenue de la Médecine, Quebec G1V 0A6, Canada. 3Centre d’Optique,
Photonique et Laser, Université Laval, 2375 Rue de la Terrasse, Quebec, QC G1V 0A6, Canada. 4Center for
Telecommunications Studies, Pontifical Catholic University of Rio de Janeiro, Rio de Janeiro, Brazil. 5Grupo Física
de Materiais, Instituto de Física, Universidade Federal de Goiás-UFG, Campus II, Av.Esperança 1533, Goiânia,
GO 74690‑900, Brazil. 6Departamento de Física, Universidade Federal de Pernambuco, Recife, PE, Brazil. 7Fabulas
Laboratory, Department of Electrical Engineering, École Polytechnique Montréal, Station Centre‑ville, P.O
Box 6079, Montreal, QC H3C 3A7, Canada. *email: antsar.hlil@polymtl.ca; raman.kashyap@polymtl.ca
Scientific Reports | (2021) 11:16803 | https://doi.org/10.1038/s41598-021-95921-8 1
Vol.:(0123456789)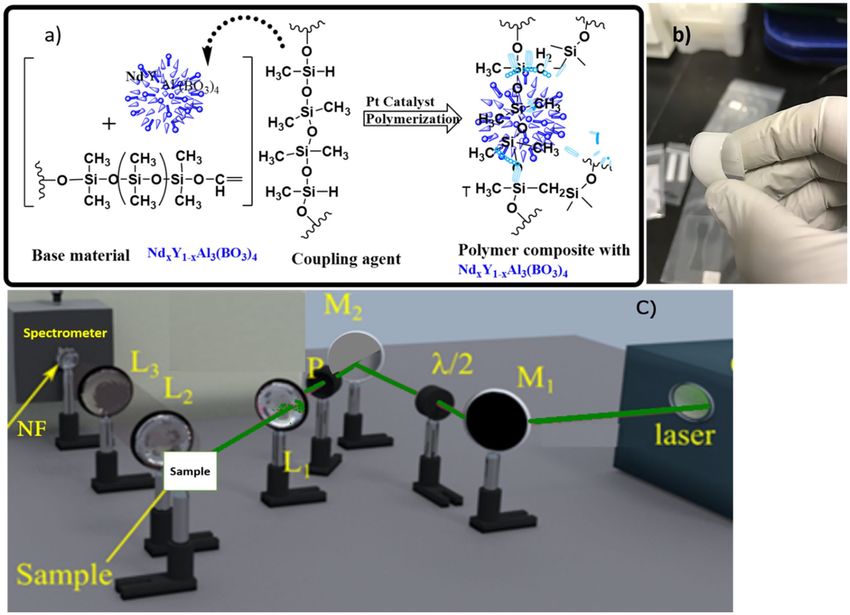
www.nature.com/scientificreports/
Composition
Polymer composite PDMS/curing/NdxY1−xAl3(BO3)4 -(3%)
PDMS-Sylgard Polymer/curing/0.5 g/0.05 g
PC0.2 (X = 0.2) PDMS/curing/Nd0.2Y0.8Al3(BO3)4 (0.1 g/0.01 g/0.03 g)
PC0.4 (X = 0.4) PDMS/curing/Nd0.4Y0.6Al3(BO3)4 (0.1 g/0.01 g/0.03 g)
PC0.6 (X = 0.6) PDMS/curing/Nd0.6Y0.4Al3(BO3)4 (0.1 g/0.01 g/0.03 g)
PC0.8 (X = 0.8) PDMS/curing/Nd0.8Y0.2Al3(BO3)4 (0.1 g/0.01 g/0.03 g)
PC1.0 (X = 1.0) PDMS/curing/Nd1.0 Y0.0Al3(BO3)4 (0.1 g/0.01 g/0.03 g)
PC0.0 (X = 0) PDMS/curing/Y1.0Al3(BO3)4 (0.1 g/0.01 g/0.03 g)
Table 1. Composition of the polymer composite with Nd:YAB nanoparticles.
A very promising application is its use as a photon source for speckle free imaging by taking advantage of its
brightness due to the laser emission as well as and its low spatial coherence17,18. Also RLs find applications in opt
microfluidics19, optical batteries20, cancer diagnostics21 etc. A recent work by N. Caselli shows that the engineer-
ing of coupled RLs sets the basis for building structures with potential to function as optical neural networks18.
Previously, we demonstrated the potential application of inorganic Nd:YAB nanoparticles with PDMS for RL
applications, and the material system demonstrated high durability22,23. This work provides a further and deeper
continuation of Ref.22, which demonstrated random lasing with PDMS composite films which contain Nd:YAB
(Nd0.8Y0.2Al3B4O12) nanoparticles around 1064.5 nm with pulsed nanosecond excitation at 808 nm and 532 nm.
In the current work, we have systematically investigated the lasing wavelength, threshold, and linewidth of the
laser by tailoring the concentration and optical gain of the scattering centres. One of the underlying questions
related to the physics of random lasing is the influence of the density of scattering centers on the random lasing
properties. This is because the mean free path of a photon is strongly affected by the correlation length, Lc24. For
this reason, tailoring the concentration and optical gain of scattering centers is of primary interest. We managed
to alter the dopant density within the PDMS-based composite to dynamically tune the distribution of the scat-
terers and gain medium by stretching the PDMS medium. Inherently stable and long-lasting lasing was realized
in this novel elastomeric composite by exploiting the dependence of the lasing emission on the scatterer density,
making them suitable for biomedical applications. We also studied the intensity fluctuation of the RL emission
and confirmed that it follows Lévy statistics.
Results and discussion
Structural and morphological characterization. The composition of the PDMS films and the polymer
composites with Nd:YAB nanoparticles are given in Table 1.
The incorporation of nanoparticles into PDMS (host polymer) as well as the structural difference between
samples with and without Nd:YAB nanoparticles were investigated by Raman spectroscopy.
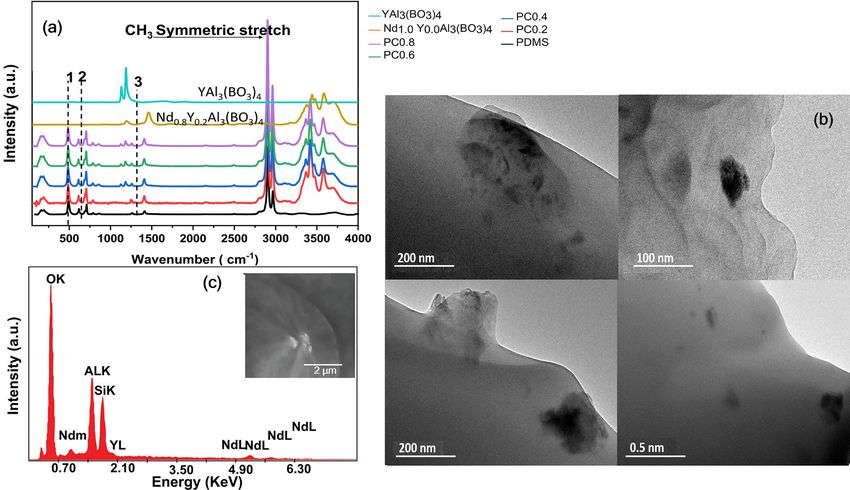
The Raman spectrum of PDMS without the N dxY1−x Al3(BO3)4 particles is shown in Fig. 1a in black. The typi-
cal vibrational modes for silicon, carbon, oxygen, and hydrogen bonds can be observed; these include symmetric
stretching (Si–O–Si, 487 cm−1), symmetric rocking (Si–CH3, 614 cm−1), (Si–C, 707 cm−1), asymmetric stretching
(Si–C) overlaps with asymmetric rocking ( CH3) at 789 cm−1, and symmetric stretching ( CH3) at 2965 cm−1 and
at 2906 cm−1. These assignments are in close agreement with those found in the l iterature25.
The Raman spectra of N dxY1-xAl3(BO3)4-nanoparticle-doped PDMS composites are also shown in Fig. 1a. New
bands appearing at 1191 and 1463 cm−1 for the PDMS + nanoparticles composite samples could be attributed to
the stretching of trigonal B O3 groups26, while the bands in the range 3300–3800 cm−1 can be attributed to the
presence of NdxY1−xAl3(BO3)4. From Fig. 1a, it can be deduced that the intensity of bands depends on the Ndx
ratio in the composites incorporated in the PDMS polymer.
From comparison of the Raman spectra of N dxY1-xAl3(BO3)4 particles in Supplementary Information Fig. S1
and the polymer composite (PC), it can be clearly seen that the vibrational band intensities, which represent
changes in the sample, decrease and disappear more slowly for the PDMS-composite (PC) compared with the
pure polymer. The changes in the intensity of all the characteristic vibrational bands are significant. From these
measurements, it can be further noted that the lack of any new major vibrational bands indicates that no new
Raman active chemical species or side products are created.
The thermal behavior of composites was measured via DSC, and the results did not show any significant
difference in the glass transition temperature between the pure PDMS and the composite samples, as reported
in Table 2. This indicated that the introduction of nanoparticles with strong polymer interaction did not affect
the glass transition temperature. The crystallization point was not clearly observed, which is in close agreement
with literature reports where PDMS chains were reported to be unable to crystallize when they are adsorbed or
in high proximity to the filler (particles)27,28.
The morphology and the cross section of the Nd0.8Y0.2Al3(BO3)4 particles embedded in the PDMS films were
analyzed at different magnifications using transmission electron microscopy (TEM) (Fig. 1b) and scanning
electron microscopy (SEM). The morphology of the powder particles embedded into the polymer were observed
using a high-resolution transmission electron microscope (TEM and HR-TEM modes) on a JEOL model JEM
2010 operating at 200 keV and is shown in Fig. 1b.
The composition of the polymer composite was determined via energy-dispersive X-ray analysis (EDX)
(Fig. 1c), and the composite were found to contain all the elements of the NPs and P DMS29. From the SEM
Scientific Reports | (2021) 11:16803 | https://doi.org/10.1038/s41598-021-95921-8 2
Vol:.(1234567890)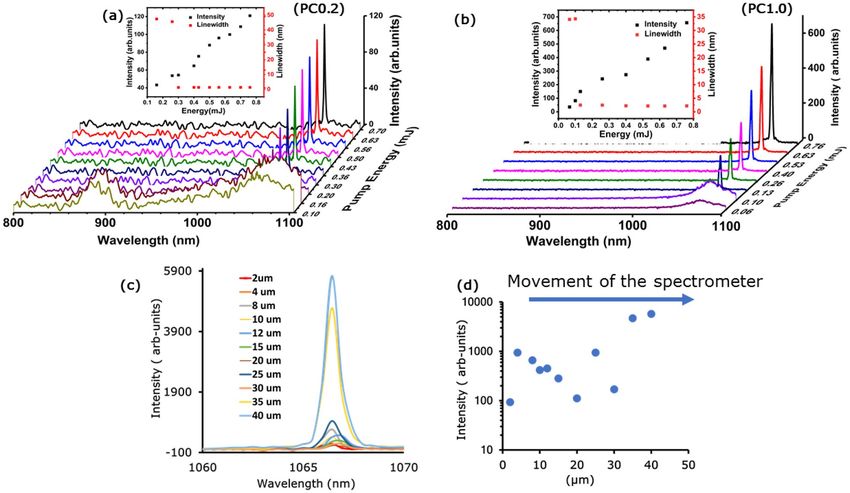
www.nature.com/scientificreports/
Figure 1. (a) Raman spectra of pristine PDMS (black curve) and PDMS nanocomposite with N dxY1−xAl3(BO3)4
(PCx) with a 633 nm pump laser. Also shown are nanoparticles and YAl3(BO3)4 without PDMS (dark yellow and
light blue lines respectively). Noted in the figures are (1) Si–O–Si Symmetric stretch peak at 487 c m−1, (2) the Si–
CH3 symmetric rocking at 687 cm−1, and (3) the Si–CH3 symmetric bending 1260–1400 cm−1, (b) TEM Images
of PDMS composites with ultrafine particle incorporated with PDMS, (c) energy-dispersive X-ray analysis of
PC0.8. The inset shows an SEM image of the sample with 5 µm scale.
DSC TGA
Polymer composite (Ndx)a Tgb (°C) ∆Cpc J/(g K) 5% (weight lost)d Total% (lost at 600 °C)e
PDMS-Sylgard − 123.1 0.167 396 − 57.1
Y1.0Nd0Al3(BO3)4 PC0.0 − 123.0 0.157 397 − 45.59
PC0.2 − 122.1 0.153 408 − 27.18
PC0.4 − 122.0 0.154 403 − 28.1
PC0.6 − 121.8 0.151 400 − 30.7
PC0.8 − 121.6 0.151 400 − 30.7
PC1.0 − 121.6 0.151 403 − 28.8
Table 2. Thermal properties of polymer composite with Nd:YAB. a Polymer composite containing Nd
concentrations of NdxY1–xAl3B4O12 with x = 0.2, 0.6, 0.8, and 1.0. b,c Obtained by DSC under a helium
atmosphere with heating rate of 10 K/min. d,e Obtained by TGA under 25 mL/min stream nitrogen atmosphere
with constant heating ramp of 10 °C/min.
images shown in the inset of Fig. 1c it can be seen that the Nd nanoparticles were randomly distributed in the
PDMS substrate and the broad dispersion and present a larger particle quantity between 100 and 300 nm. The
SEM image with 1 µm magnification is provided in Supplementary Information Fig. S3.
The heat capacity ∆Cp data listed in Table 2 were determined from the DSC curves given in the supplementary
materials (Supplementary Information Fig. S4). The data did not show any significant differences in the ∆Cp
for the polymer composites.
In the glassy state, a high degree of cooperativity between the chain segment is required, which is associated
with a high energy barrier in the early stages of transition. As the temperature increases, the molecular motion
increases, hence, the degree of cooperativity decreases, which consequently led to a decrease in the effective
activation energy.
The glass transition for pure PDMS and PDMS with nanoparticles were similar, which indicated that the
presence of nanoparticles that had a strong interaction with the polymer did not affect the glass transition
Scientific Reports | (2021) 11:16803 | https://doi.org/10.1038/s41598-021-95921-8 3
Vol.:(0123456789)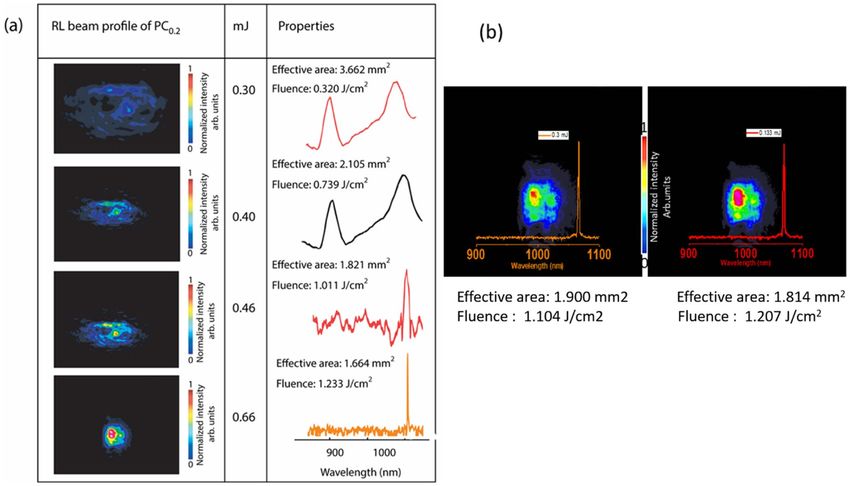
www.nature.com/scientificreports/
Figure 2. (a) The emission spectra obtained from the Nd0.2Y0.8Al3(BO3)4 polymer composite, and the threshold
is 0.30 mJ. On further increasing the pump energy, a narrow peak emerges in the emission spectra with a
linewidth of 1.31 nm. The inset shows the FWHM (red circles) and maximum emission integral intensity (black
circles) vs. pump energy, (b) emission spectra obtained from the Nd1.00Al3(BO3)4 polymer composite, with an
emission threshold of 0.13 mJ. On further increasing the pump energy, narrow peaks emerge in the emission
spectra with a linewidth of 2.21 ± 0.1 nm. The inset shows the FWHM (red squares) and maximum emitted
intensity (black circles) vs. pump energy. The higher noise in Figure is due to the different scaling which is
normalized to the highest peak in each figure, (c) the lasing spectrum of PC0.8 as the spectrometer is moved in
same direction (µm), which increases or decreases depending on the position of the spectrometer. The (d) shows
the change in the laser intensity with varying position of the spectrometer.
temperature. TGA was used to evaluate the thermal stability of the prepared polymers composites. The thermal
decomposition of the PC samples was evaluated at different percentages of weight loss (5% and at the maximum),
and the results are summarized in Table 2. Supplementary Information Figure S5 shows the thermogravimetric
analysis, i.e., TGA curves of the PDMS-Sylgard polymer and the composites with Nd:YAB, which were heated to
800 °C at a constant rate of 10 °C min−1 under a 25 mL min−1 nitrogen stream. The PDMS displayed weight‐loss
stages located in the 220–450 and 450–580 °C ranges, which can be attributed to PDMS degradation.
Random lasing emission. The RL emission spectra of the PC0.2 polymer composite sample is shown in
Fig. 2a for different excitation energies, which range from below to well above the RL threshold. The obtained
linewidth, i.e., the full width at half maximum (FWHM) of the emission spectra, for the same sample composi-
tion as a function of pump energy is shown in the inset of Fig. 2a. A Gaussian fit was used to calculate FWHM.
An example fitting for Nd1.0Y0.6Al3B4O12 polymer composite for ASE and RL are provided in supplementary
information (SI3—Fig. S6). The emission linewidth is strongly reduced, ranging from 48 nm just before lasing
begins (amplified spontaneous emission (ASE)) to 1.3 ± 0.5 nm (spectrometer bandwidth limited), as the excita-
tion pump energy is increased from below to well above the excitation threshold (~ 0.30 mJ). A detailed analysis
of PC0.2 and PC1 can be found in Supplementary Information Figs. S8 and S11.
The PC1 sample is shown in Fig. 2b and it displays similar behavior but with a much higher emission intensity
and lower threshold. It can be noted that ASE generated at ~ 900 nm becomes negligible at higher Nd nanoparticle
ratios. The increase in the Nd3+ concentration is correlated with the RL wavelength because it corresponds with
the maximum of the gain at 1064 nm. Additional spectra for samples PC0.4 to PC0.6 are available in the sup-
plementary material (Supplementary Information Figs. S9, S10). The shift of the random lasing emission spectra
change in the linewidth as well as the lasing threshold depends on the N d3+ concentration and correlates to the
RL wavelength because it corresponds to the maximum of the gain curve. Tuning of the laser in the case of the
narrow bandwidth of Nd is possible in terms of directionality, ASE and lasing. There is only limited wavelength
tunability due to the narrow gain bandwidth of Nd. A detailed study on the absorption and photoluminescence
spectra of the gain material were already provided in previous paper (Ref.30) and is reproduced in the SI (Fig. S7).
Scientific Reports | (2021) 11:16803 | https://doi.org/10.1038/s41598-021-95921-8 4
Vol:.(1234567890)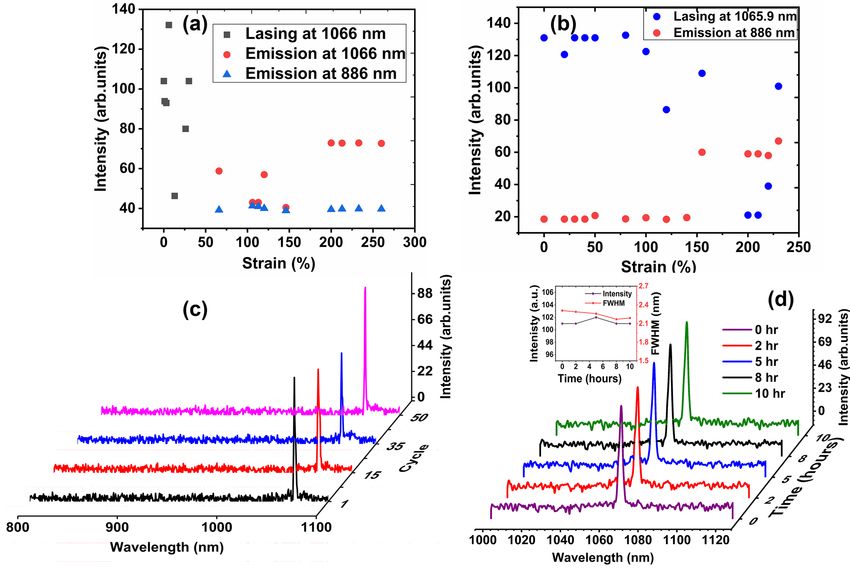
www.nature.com/scientificreports/
Sample Lasing wavelength (nm) Threshold (mJ) Lasing linewidth (nm) Lifetime (µs)
PC0.2 1066.4 ± 0.50 0.30 1.3 40
PC0.4 1065.9 ± 0.50 0.26 0.9 26
PC0.6 1065.9 ± 0.50 0.20 0.9 23
PC0.8 1064.0 ± 0.50 0.20 0.817 19
PC1.0 1066.9 ± 0.50 0.13 2.2 18
Table 3. The obtained lasing wavelength, threshold, and linewidth for the polymer composites (PC0.2–
PC1.0).
Figure 3. (a) Properties of the observed RL beam profile for polymer composite PC0.2 at different excitation
energies, (b) the random laser beam profile of sample PC1.0 and lasing emission at pump energies of 0.16 and
0.3 mJ.
The RL emission spectra varied with observation angle, which is because the RL device emits in multiple
directions with various intensities. The lasing spectra for sample PC0.8 observed while moving the spectrometer
in the same direction is shown in Fig. 2c. The lasing intensity in different directions, with a constant pump power,
can increase or decrease depending on the position of the spectrometer which demonstrates the multi-directional
operation of the RL as shown in Fig. 2d. The lasing parameters for each sample are described in Table 3.
The transition from spontaneous emission to the lasing regime was demonstrated by the decay time meas-
urements of the 4F3/2 level. The measured lifetimes are described in Table 3 and detailed results are available
in the supplementary material (Supplementary Information Fig. S12). Above the threshold, the pulse width
was determined to be 10 ns. The obtained lifetimes for all the polymer composites are in good agreement with
previous reports for the corresponding nanocrystalline powders30. As expected, the lifetimes of the polymer
composites are almost similar to the nanocrystalline powders30. Due to ion-ion interaction and energy transfer
between ions, the lifetime decreases as the doping concentration is i ncreased31.
The RL beam profile of PC0.2 along with the emission spectra and properties are provided in Fig. 3a. The
beam profiles were obtained using a coherent Laser Cam HR beam profiler (Coherent). Firstly, the lasing emis-
sion was verified using the spectrometer, which was then replaced with the beam profiler to record the image.
The color bars represent relative intensities from low to high.
When the excitation energy was increased from 0.3 to 0.66 mJ the effective beam area reduced from 3.6
to 1.6 mm. The observed RL beam profile for sample PC1.0 at an input pump energy of 0.16 and 0.30 mJ are
shown in Fig. 3b. The effective area of the beam crossection and the fluence were 1.900 m m2 and 1.104 J/cm2,
respectively, using a pump energy of 0.16 mJ. However, above the threshold, the effective area and fluence were
measured to be 1.814 m m2 and 1.207 J/cm2, respectively.
Scientific Reports | (2021) 11:16803 | https://doi.org/10.1038/s41598-021-95921-8 5
Vol.:(0123456789)www.nature.com/scientificreports/
Figure 4. (a) The spectroscopic response intensity of the PC0.2 device for different strain values up to 260%
with 532 nm laser excitation. Each point in Figure is an average of the peak spectral power density over different
strain values. Lasing ceases for strain values above ~ 60% and only amplified spontaneous emission (ASE) can
be observed instead, with one new peak appearing at 886 nm, (b) spectroscopic response intensity of the PC0.4
RL device for different strains up to 230%, (c) RL emission of PC1.0 by applying a maximum strain of 100%
for several cycles, (d) the PC1.0 RL emission as a function of time of continuous operation, the inset shows the
intensity and linewidth (FWHM) of the lasing emission as a function of time of continuous operation.
Stretching, stability and repeatability studies on polymer composites. The RL emission inten-
sity as well as the wavelength tunability were investigated by stretching the polymer composite. This was per-
formed by increasing the distance between two translation stages holding each edge of the polymer strip. The
percentage stretching is defined by L L × 100 i.e., ratio of change in the length to the original length of the
polymer composite.
Laser decrease and stop during the stretching process due to mode hoping. As shown in Fig. 1, the nano-
particle has no specific orientation. Stretching process changes the orientation of the polymer chains, not the
nanoparticles and this can lead to change in the intensity. We have explored the number of scatterers/unit volume
by stretching of the polymer host and demonstrated that the random phases of the scatter and also the variability
in the gain from the different particles of rare earth element, Neodymium, influences not only the wavelength
of emission (albeit limited as the RE used does not have a wide gain bandwidth), but also lasing, and the direc-
tion of emission. The sum of the phases of the scattered radiation determines if the RL is going to lase. Hence,
at some strain values, lasing does not occur.
The RL emission of the PC0.2 device at 1066.4 ± 0.5 nm was sustained up to 30% of stretching. However,
lasing stops at strain values > 60% and amplified spontaneous emission (ASE) occurs instead, with one new
peak appearing at 886 nm (Fig. 4a). This is because during each stretching event, the phase of the scattered
light changes and phase matching can be lost. In addition, the stretching process changes the orientation of the
nanoparticles in the polymer. Furthermore, at certain strain values the amplitude of the RL emission reduces,
however, lasing does not stop.
The linewidth (FWHM) of the lasing at 1066.4 nm was measured to be 1.31 nm for 0–30% strain. The ASE
bandwidth at 1066 nm was 61.22 nm for 60–250% of strain. The ASE peak at 886 nm has a linewidth of ~ 30 nm.
For the present composition, lasing could not be observed above 50% strain.
A new emission line at 886 nm appeared for PC0.4 at strain > 155%, but only amplified spontaneous emission
(ASE) is observed. The new emission line (ASE) appeared at 886 nm for PC0.4 at strain > 155%. The emergence of
this peak is due to the 4F3/2 to 4 I9/2 fluorescence transition32. We could observe this only in PC0.2 and PC0.4. In
all other samples, the lasing peak at ~ 1064 nm (due to 4 F3/2 to 4I11/2 transition) was dominant. The spectroscopic
Scientific Reports | (2021) 11:16803 | https://doi.org/10.1038/s41598-021-95921-8 6
Vol:.(1234567890)www.nature.com/scientificreports/
response of the RL device for different strains is shown in Fig. 4b, which represents the intensity versus strain
at 1064 and 886 nm.
A perfectly uniform and adiabatic stretching will change the defects’ position scaling but will not change the
orientation, which will lead to a linear phase change, hence a shift in the emitted w avelength17. However non-
uniform change (which is more likely to happen) will change the random distribution of defect, hence changing
the lowest threshold localization mode, leading to a mode-hop. This is why we expect the emission bandwidth
to change.
If a mode hop occurs, then the threshold, linewidth and emission direction may change somewhat as the
random media has a large number of possible modes with different quality factors. However, as a general rule of
thumb for the sample measured and which our data supports, stretching the material lowers the lasing threshold,
possibly through a better phase matching condition, and is detailed in Table 3. Since lower pump power is now
closer to threshold, the linewidth increases slightly according to the Schwalow–Townes r elation33. Also increasing
the concentration of Nd could increase the gain of the system and reduce the threshold. A detailed statistical study
of the intensity fluctuation versus strain with emission bandwidth as well as the mechanical properties (for e.g.:
tensile strength) on the tuning of the laser wavelength is being studied in detail and will be reported in the future
article. A detailed statistical study focusing on the effect of stretching as well as the mechanical properties (for e.g.:
tensile strength) on the tuning of the laser wavelength is being studied in detail and will be reported in future.
The average thickness of all samples we used are ~ 0.3 ± 0.1 mm. Although we do not have a fixed cavity in
the random laser, the mean free path of the photons depends on the particle density. Therefore, by stretching the
sample, the effective area under illumination increases, leading to a decrease in effective density. As the mean
free path is inversely proportional to particle density, it increases in the present case.
For PC0.6, the RL emission at 1065.95 ± 0.5 nm was sustained up to 270% strain, while it could be sustained
up to 300% stretching for PC1. However, the intensity reduced suddenly above 200% strain. Detailed RL spectra
at various strains is available in the Supplementary Information Figs. S13–S16. The different lasing regimes can
be attributed to the random scatterer density that influences the random lasing behavior with stretching. In addi-
tion, the RL emission wavelength and intensity could be gently restored when the strain was released from 100
to 0%, which demonstrates good repeatability. This was estimated by measuring the RL spectrum during each
cycle of applied strain, i.e., continuously applying a strain up to 100% and then releasing it to 0% strain for ~ 50
cycles at a pump energy of 0.30 mJ. The observed highly repeatable and strong lasing spectra shown in Fig. 4c
demonstrates that our polymer composite has excellent stability even after repeated stretching. Organic materi-
als are unfortunately known for their poor stability over time, and hence, we studied the lasing operation over a
long period. The stability of the N d1.0Al3(BO3)4 composite was investigated by monitoring the RL emission with
continuous laser excitation for 10 h at an excitation energy of 0.30 mJ, which is far above the threshold (Fig. 4d).
The intensity and linewidth variation are shown in Fig. 4d and demonstrate that the sample had good stability
in terms of its emission intensity and FWHM. The combination of stable inorganic Nd:YAB nanoparticles with
PDMS enabled extended stability of the material system for long-term experiments and measurements without
degradation17.
There are many advantages for stretchable random lasers. Firstly, we can tune the laser intensity, wavelength
or threshold just by stretching the lasing m aterial34. Secondly, it can be useful for developing flexible structure
photonics devices, particularly for use in display technology as well as optical sources for biomedical applica-
tions, wearable devices etc.35.
It should be noted that each polymer composite was found to exhibit unique RL emission characteristics.
Finally, we compared the lasing performance of all the polymer composites and found that PC1.0 was the most
suitable composition for RL applications. This is the most striking finding of this study, i.e., that sample PC1.0,
which contains a large amount of scattering and gain particles, exhibits a lower lasing threshold (0.1 mJ) than
other samples. In addition, the measurements show that PC1.0 has a lifetime of 18 µs (lower than the lifetimes
of the other polymer composites), which is desirable because it can facilitate the lasing process. Along with these
properties, the observed highly repeatable and stable random lasing spectrum, even with repeated stretching
of the polymer, allowed us to conclude that PC1.0 is the best RL media among the investigated composites. For
PC1.0, the RL emission at 1066.9 ± 0.5 nm was sustained up to 270% of stretching, which was not observed
for other samples. The observed results are consistent with previous reports on Nd:YAB ( NdxY1−xAl3(BO3)4)
nanocrystalline powders30.
We performed experiments on a novel RL device to study its intensity fluctuation and spectral correlation
via analysis of the distribution of the maximum emission intensities. Our previous work on PC0.822 was the first
experimental study of the probability distribution function (PDF) of the emitted intensities in a SERL (stable
elastomer random laser) system. Lévy-like statistics of the intensities and photonic spin glass behavior were also
demonstrated in this open cavity random laser.
For the PC0.8 polymer composite, on increasing the pump energy from below to above the RL threshold, a
transition from a Gaussian statistical regime to a Lévy-like one was observed, followed by a return to the Gaussian
statistical regime (Supplementary Information Fig. S17). The PDF of the emission intensities was determined by
studying the RL output intensity fluctuations. A replica symmetry-breaking above the RL threshold was observed
and the photonic spin-glass behavior of the RL emission was e stablished22.
Conclusion
A near infrared (NIR) random laser composed of Nd:YAB nanoparticles in an elastomeric polymer was dem-
onstrated. Lasing at a wavelength of ~ 1065 ± 1 nm was observed from the Nd:YAB nanoparticles under 532 nm
excitation. It was verified that the Nd:YAB nanoparticles and the gain medium act as scattering centers, while the
PDMS polymer acts as a highly stable host substrate. Additionally, the polymer composites could be stretched by
Scientific Reports | (2021) 11:16803 | https://doi.org/10.1038/s41598-021-95921-8 7
Vol.:(0123456789)www.nature.com/scientificreports/
Figure 5. (a) The composition of the polymer composite, and (b) THE synthesized flexible polymer composite,
(c) Experimental setup used to excite the samples and collect the RL emission. The source of excitation is a
Nd:YAG laser at 532 nm. The beam intensity is controlled through a half-wave plate (HWP) and a polarizer (P)
and is focused on the sample by lens L 1. The light signal is collimated by lens L
2 and focused on the spectrometer
entrance by lens L
3. The signal is detected using a spectrometer.
up to 300% to control the emission. Benefitting from their unique properties, such as a lower lasing threshold and
highly repeatable and stable RL spectrum, the polymer composites PC0.8 and PC1.0 were found to be excellent
candidates for RL applications compared to the other investigated samples. In particular, they are suitable for the
development of flexible lasing devices, which are still technologically challenging and expensive. One potential
application is in the field of bio-photonics, where the stability of the RL is of importance, and where our SERL
could possibly emulate flexible biomaterials, with PDMS being a highly bio-compatible material. In principle,
based on the requirements for random laser device requirements, the optical properties of different rare-earth
doped RLs can be tuned by varying the RE concentration and the pumping wavelength.
Materials and methods
Synthesis of nanocrystal powders. NdxY1−xAl3(BO3)4 nanocrystal powders, with Nd ratios x = 0.2, 0.4,
0.6, 0.8, and 1.0 were synthesized via the polymeric precursor method, as previously d escribed30. Briefly, in a
typical reaction, aluminum nitrate (Al(NO3)3·9H2O) and neodymium nitrate (Nd(NO3)3·6H2O) were dissolved
in aqueous citric acid (C5O7H8) solution at room temperature. The resultant mixture was then added to an
aqueous solution containing D-sorbitol (C6O6H14) and boric acid (H3BO3). Dried resin was produced by polym-
erization of the blend at 150 °C, with the molar ratio maintained at 3:1 for citric acid and elements (boron with
metal), while the d-sorbitol/citric acid ratio was 2:3. The dried resin was first calcinated at 400 °C for 24 h, and
then annealed at 700 °C for a further 24 h, and finally heated at 1100 °C for 5 min under abundant oxygen supply.
Fabrication of the PDMS/NdxY1‑x Al3(BO3)4 composites
The PDMS (Sylgard 184) was obtained from Ellsworth Adhesives Canada. PDMS along with its respective cur-
ing agent (Component B) at a ratio of 10:1 was used with the Nd:YAB nanoparticles (PC) for preparation of the
polymer composites shown in Fig. 5a. The PDMS prepolymer containing di-vinyl-terminated (Sylgard-184: Base
material) was poured into an acrylic container in which 3% (w/w) of the previously prepared NdxY1−xAl3(BO3)4
particles were dispersed with extensive mixing and subsequent ultrasonication for 15 min. The blend was
kept under vacuum for 30 min to remove bubbles produced during the mixing process. Next, a curing agent
Scientific Reports | (2021) 11:16803 | https://doi.org/10.1038/s41598-021-95921-8 8
Vol:.(1234567890)www.nature.com/scientificreports/
(Component B) containing Si–H groups along with a platinum catalyst was added to the blend, and it was further
sonicated for 1–2 min. Flexible films (Fig. 5b) were then obtained by either: spin-coating the polymer composites
on pre-cleaned glass slides with an initial speed of 100 rpm for 30 s, followed by 200 rpm for 30 s, and finally, the
samples were cured at 90 °C for 1 h; or, by pouring the blend into a 5 × 1 cm mold of thickness (1 mm, 0.3 mm,
0.2 mm) followed by curing in an oven at 90 °C for 1 h. The dispersion of nanoparticles in the PDMS monomer
prior to polymerization was a better approach for avoiding nanoparticle a ggregation18.
Characterization
The structural and optical properties of the polymer composites were investigated and characterized. Diffuse
reflectance spectra (DRS) in the range of 250–1500 nm were collected using a UV/Vis/NIR spectrophotometer
(PerkinElmer: Lambda WB 1050) equipped with the Praying Mantis attachment.
The Raman spectra were recorded with a Renishaw in Via spectrometer coupled with a Leica DM2700 micro-
scope. A back-scattering geometry was used in the frequency range of 50–4000 cm−1. The excitation light source
was a horizontally polarized laser operating at 633 nm and a Syncerity detector (Model 1024X256-OE, Horiba).
The Raman spectroscopy measurements were performed with a 100× objective (Olympus MPL—NA = 0.90).
Thermogravimetric measurements were performed using a Mettler-Toledo Q500 TGA/DSC (Columbus,
Ohio, USA) instrument, and 5–8 mg samples placed in alumina crucibles were heated up to 800 °C at a constant
rate of 10 °C min−1 under a 25 mL min−1 nitrogen stream.
Differential scanning Calorimetric (DSC) curves were recorded using Netzsch, DSC–404F3 Pegasus in-line
with a liquid nitrogen cooling unit. For the measurements, 20 mg samples packed in aluminum pans with highly
sensitive type E sample carrier were introduced in a silver furnace with a heating rate of 10 K/min under a helium
atmosphere. The glass transition temperatures (Tg) are reported based on the temperature at the middle of the
thermal transition from the second heating scan.
The RL emission spectra of five polymer composites were measured under identical experimental conditions
at room temperature using a pulsed Nd:YAG laser (150 Hz, 10 ns, λ = 532 nm), delivering a maximum energy of
0.76 mJ. Programing automates data collection using labVIEW2019SP1 software.
The emission signal was collected and analyzed using an Ocean Optics USB4000 spectrometer (spectral
resolution ∼ 0.5 nm) (Fig. 5c).
The beam profiles of the RL were acquired using a coherent Laser Cam HR beam profiler.
The emission decay curves upon excitation at 532 nm were acquired using a fast oscilloscope (Tektronix). A
Thorlabs SM05PD1B photodiode was used to record the signal.
Received: 11 May 2021; Accepted: 26 July 2021
References
1. Ma, H., Jen, A. K. Y. & Dalton, L. R. Polymer-based optical waveguides: Materials, processing, and devices. Adv. Mater. 14,
1339–1365. https://doi.org/10.1002/1521-4095(20021002)14:19%3c1339::Aid-adma1339%3e3.0.Co;2-o (2002).
2. Hoinka, N. M., Ostwald, C. & Fuhrmann-Lieker, T. Two-dimensional wrinkle resonators for random lasing in organic glasses. Sci.
Rep. 10, 2434. https://doi.org/10.1038/s41598-020-59236-4 (2020).
3. Reddy, J. W., Lassiter, M. & Chamanzar, M. Parylene photonics: A flexible, broadband optical waveguide platform with integrated
micromirrors for biointerfaces. Microsyst. Nanoeng. https://doi.org/10.1038/s41378-020-00186-2 (2020).
4. Li, C., Wu, P. M., Han, J. & Ahn, C. H. A flexible polymer tube lab-chip integrated with microsensors for smart microcatheter.
Biomed. Microdevices 10, 671–679. https://doi.org/10.1007/s10544-008-9178-3 (2008).
5. Schwartz, G. et al. Flexible polymer transistors with high pressure sensitivity for application in electronic skin and health monitor-
ing. Nat. Commun. 4, 1859. https://doi.org/10.1038/ncomms2832 (2013).
6. Poulin, J. & Kashyap, R. Novel fabrication of fiber bragg gratings using silicone rubber phase-mask stamp on the cladding. J.
Lightwave Technol. 27, 5602–5606. https://doi.org/10.1109/jlt.2009.2033015 (2009).
7. Yang, C., Shi, K., Edwards, P. & Liu, Z. Demonstration of a PDMS based hybrid grating and Fresnel lens (G-Fresnel) device. Opt.
Express 18, 23529–23534. https://doi.org/10.1364/OE.18.023529 (2010).
8. Lau, S. P. et al. Flexible ultraviolet random lasers based on nanoparticles. Small 1, 956–959. https://doi.org/10.1002/smll.20050
0098 (2005).
9. Liao, Y.-M. et al. Highly stretchable label-like random laser on universal substrates. Adv. Mater. Technol. 1, 1600068. https://doi.
org/10.1002/admt.201600068 (2016).
10. Hu, H. W. et al. Wrinkled 2D materials: A versatile platform for low-threshold stretchable random lasers. Adv. Mater. 29, 1703549.
https://doi.org/10.1002/adma.201703549 (2017).
11. Tehranchi, A., Iezzi, V. L. & Kashyap, R. Power fluctuations and random lasing in multiwavelength brillouin erbium-doped fiber
lasers. J. Lightwave Technol. 37, 4439–4444. https://doi.org/10.1109/jlt.2019.2925588 (2019).
12. Wiersma, D. S. The physics and applications of random lasers. Nat. Phys. 4, 359–367. https://doi.org/10.1038/nphys971 (2008).
13. Zhai, T. et al. Ultra-thin plasmonic random lasers. Opt Express 24, 437–442. https://doi.org/10.1364/OE.24.000437 (2016).
14. Hokr, B. H. et al. Single-shot stand-off chemical identification of powders using random Raman lasing. Proc. Natl. Acad. Sci. U.S.A.
111, 12320–12324. https://doi.org/10.1073/pnas.1412535111 (2014).
15. Albuquerque de Oliveira, M. C. et al. A random laser based on electrospun polymeric composite nanofibers with dual-size distri-
bution. Nanoscale Adv. 1, 728–734. https://doi.org/10.1039/c8na00277k (2019).
16. da Silva-Neto, M. L. et al. UV random laser emission from flexible ZnO-Ag-enriched electrospun cellulose acetate fiber matrix.
Sci. Rep. 9, 11765. https://doi.org/10.1038/s41598-019-48056-w (2019).
17. Redding, B., Choma, M. A. & Cao, H. Speckle-free laser imaging using random laser illumination. Nat. Photonics 6, 355–359.
https://doi.org/10.1038/nphoton.2012.90 (2012).
18. Caselli, N., Consoli, A., Mateos Sánchez, Á. M. & López, C. Networks of mutually coupled random lasers. Optica. https://doi.org/
10.1364/optica.413223 (2021).
19. Shivakiran Bhaktha, B. N., Bachelard, N., Noblin, X. & Sebbah, P. Optofluidic random laser. Appl. Phys. Lett. https://doi.org/10.
1063/1.4757872 (2012).
20. Rand, S. C. Bright storage of light. Opt. Photonics News. https://doi.org/10.1364/opn.14.5.000032 (2003).
Scientific Reports | (2021) 11:16803 | https://doi.org/10.1038/s41598-021-95921-8 9
Vol.:(0123456789)www.nature.com/scientificreports/
21. Polson, R. C. & Vardeny, Z. V. Cancerous tissue mapping from random lasing emission spectra. J. Opt. https://doi.org/10.1088/
2040-8978/12/2/024010 (2010).
22. Hlil, A. R. et al. Rare earth doped PDMS elastomeric random lasers. Opt. Mater. https://doi.org/10.1016/j.optmat.2019.109387
(2019).
23. Hlil, A. R. et al. OSA Advanced Photonics Congress (AP) 2020 (IPR, NP, NOMA, Networks, PVLED, PSC, SPPCom, SOF) (2020).
24. Letokhov, V. S. Quantum statistics of multi-mode radiation from an ensemble of atoms. Soviet Phys. Jetp 26, 1246–1251 (1968).
25. Atanasov, P. A. et al. Properties of ns-laser processed polydimethylsiloxane (PDMS). J. Phys: Conf. Ser. 700, 012023. https://doi.
org/10.1088/1742-6596/700/1/012023 (2016).
26. Oreshonkov, A. S. et al. Structural, electronic and vibrational properties of YAl3(BO3)4. Materials (Basel) 13, 545. https://doi.org/
10.3390/ma13030545 (2020).
27. Lee, C. et al. Calorimetric studies on the phase transitions of crystalline polysiloxanes. I. Polydimethylsiloxane. Polym Prepr (ACS,
Div Polym Chem) 10, 1311–1318 (1969).
28. Llorente, M. A., Andrady, A. L. & Mark, J. E. Model networks of end-linked polydimethylsiloxane chains. XI. Use of very short
network chains to improve ultimate properties. J. Polymer Sci. 19, 621–630. https://doi.org/10.1002/pol.1981.180190406 (1981).
29. Araújo, C., Gomes, A. & Raposo, E. Lévy statistics and the glassy behavior of light in random fiber lasers. Appl. Sci. 7, 644. https://
doi.org/10.3390/app7070644 (2017).
30. Carreño, S. J. M. et al. Interplay between random laser performance and self-frequency conversions in NdxY1.00−xAl3(BO3)4
nanocrystals powders. Opt. Mater. 54, 262–268. https://doi.org/10.1016/j.optmat.2016.02.047 (2016).
31. Maia, L. J. Q., Mastelaro, V. R., Hernandes, A. C., Fick, J. & Ibanez, A. Er:YAl3(BO3)4 glassy thin films from polymeric precursor
and sol-gel methods: Waveguides for integrated optics. Thin Solid Films 517, 6584–6587. https://doi.org/10.1016/j.tsf.2009.04.040
(2009).
32. Jiangbo She, R. N., Sun, X. & Peng, B. Second International Conference on Photonics and Optical Engineering (2017).
33. Schawlow, A. L. & Townes, C. H. Infrared and optical masers. Phys. Rev. 112, 1940–1949. https://doi.org/10.1103/PhysRev.112.
1940 (1958).
34. Dai, G., Wang, L. & Deng, L. Flexible random laser from dye doped stretchable polymer film containing nematic liquid crystal.
Opt. Mater. Express. https://doi.org/10.1364/ome.10.000068 (2019).
35. Sun, T. M. et al. Stretchable random lasers with tunable coherent loops. ACS Nano 9, 12436–12441. https://doi.org/10.1021/acsna
no.5b05814 (2015).
Acknowledgements
The authors thank Wagner Correr for the scanning electron microscopy (SEM) analyses. The authors would
like to acknowledge the Natural Sciences and Engineering Research Council of Canada, Fonds de recherche du
Québec—Nature et technologies (FRQNT), Merit scholarship program for foreign students (PBEEE Quebec-
India), The Brazilian agency: CAPES—Finance Code 001, CNPq, and FAPEG for their financial support. The
authors also thank LabMic/UFG for their technical support for TEM measurements and EDX analysis.
Author contributions
A.H.—Data curation, Formal Analysis, Investigation, Methodology, Writing—original draft; J.T.—Investiga-
tion, Methodology, Review and editing; Y.G.—Visualization, Review and editing; J.B.—Review and editing;
B.L.—Visualization; A.S.R.—Software; L.J.Q.M.—Methodology, Review and editing; A.T.—Review and editing;
S.L.—Review and editing; A.G.—Resources, Review and editing; Y.M.—Supervision, Resources, Review and
editing; R.K.—Conceptualization, Resources, Supervision, review and editing.
Competing interests
The authors declare no competing interests.
Additional information
Supplementary Information The online version contains supplementary material available at https://doi.org/
10.1038/s41598-021-95921-8.
Correspondence and requests for materials should be addressed to A.R.H. or R.K.
Reprints and permissions information is available at www.nature.com/reprints.
Publisher’s note Springer Nature remains neutral with regard to jurisdictional claims in published maps and
institutional affiliations.
Open Access This article is licensed under a Creative Commons Attribution 4.0 International
License, which permits use, sharing, adaptation, distribution and reproduction in any medium or
format, as long as you give appropriate credit to the original author(s) and the source, provide a link to the
Creative Commons licence, and indicate if changes were made. The images or other third party material in this
article are included in the article’s Creative Commons licence, unless indicated otherwise in a credit line to the
material. If material is not included in the article’s Creative Commons licence and your intended use is not
permitted by statutory regulation or exceeds the permitted use, you will need to obtain permission directly from
the copyright holder. To view a copy of this licence, visit http://creativecommons.org/licenses/by/4.0/.
© The Author(s) 2021
Scientific Reports | (2021) 11:16803 | https://doi.org/10.1038/s41598-021-95921-8 10
Vol:.(1234567890)You can also read