Studies in Applied Finance - INVESTMENT THESIS FOR TRIPADVISOR, INC. (NASDAQ: TRIP) - Johns ...
←
→
Page content transcription
If your browser does not render page correctly, please read the page content below
SAF/No.17/June 2017

              Studies in Applied Finance

                INVESTMENT THESIS FOR
                   TRIPADVISOR, INC.
                    (NASDAQ: TRIP)

                                        Arshad Ajani

  Johns Hopkins Institute for Applied Economics,
Global Health, and the Study of Business Enterprise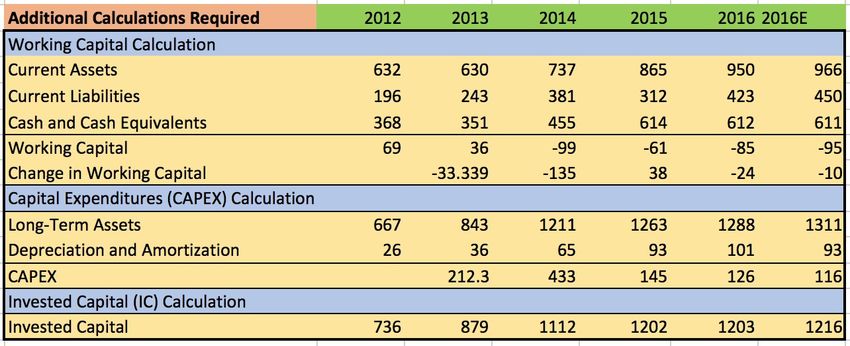
Investment Thesis for TripAdvisor, Inc. (NASDAQ: TRIP)
                                        By Arshad Ajani

Disclaimer: These research reports are primarily student reports for academic purposes and are
not specific recommendations to buy or sell a stock. Potential investors should consult a
qualified investment advisor before making any investment. This study was completed on May
4th, 2017.

                                         About the Series
The studies in Applied Finance Series is under the general direction of Professor Steve H. Hanke
(hanke@jhu.edu), Co-Director of The Johns Hopkins Institute of Applied Economics, Global
Health, and study of Business Enterprise and Dr. Hesam Motlagh (hnekoor1@jhu.edu), a Fellow
at The Johns Hopkins Institute of Applied Economics, Global Health, and study of Business
Enterprise.

This working paper is one in a series on applied financial economics, which focuses on company
valuations. The authors are mainly students at The Johns Hopkins University in Baltimore who
have conducted their word at the Institute as undergraduate researchers.

                                              Author
Arshad Ajani (aajani2@jhu.edu) is a rising senior at The Johns Hopkins University. He conducted
the research for this paper while serving as Prof. Hanke’s research assistant at The Johns
Hopkins Institute of Applied Economics, Global Health, and study of Business Enterprise during
the Spring of 2017. This summer, he will be an Investment Banking Summer Analyst at BNP
Paribas. Arshad is graduating in May 2018 with a major in Economics.

                                             Summary
The working paper is an in-depth financial analysis of TripAdvisor, Inc. (TRIP). Our analysis
examines the resilience in TRIP’s business model by exemplifying great potential to grow and
gain market share in the years to come. This analysis is combined with our proprietary
Discounted Cash Flow (P-DCF) model and a Monte-Carlo simulation. This results in distributions
of probable free cash flows. In addition to these quantitative factors, we also examine
compensation plans of TripAdvisor’s executives to assess the degree to which the executives’
compensation incentives are aligned with the objective of creating shareholder value.

                                     Acknowledgements
Many thanks to Prof. Steve Hanke, Dr. Hesam Motlagh, and Charlie Bushnell for guidance and
draft comments.

Keywords: TRIP, TripAdvisor, Inc., Travel, Discounted Cash Flow, Free Cash Flow, Monte-Carlo
Simulations, Investment Thesis, Compensation.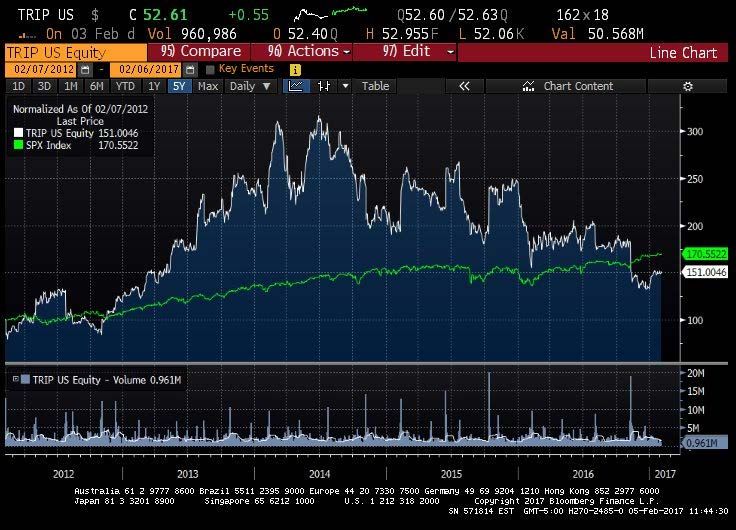
Investment Thesis for TripAdvisor, Inc. (NASDAQ: TRIP) by Arshad Ajani

                   Rating: Buy – Average Free Cash Flow per Share: $53.41

                                   Company Name            TripAdvisor, Inc.
                                               Date             5/4/17
                  Fiscal year ends (current period)   12/31/2017 (Q3 - Ends 9/17)
                                      Current Price             $45.50
                               52 week high (date)         $71.69 (7/28/16)
                                52 week low (date)        $40.645 (3/02/17)
                                       Market Cap             $6,423.7M
                                  Enterprise Value            $5,848.7M
                                         Total Debt            $171.0M
                                               Cash            $746.0M
                        Net Debt/Enterprise Value               -9.83%
                                          Dividend                N/A
                          Shares Outstanding/Float         128.4M/109.7M
                                       Current P/E              57.25x
                                     2018 P/E (EPS)        20.20x ($2.252)*
                                     2018 P/E (EPS)        31.49x ($1.445)*
                                     2017 P/E (EPS)        37.76x ($1.205)*
                                          2016 EPS             $1.40**
                                          2015 EPS             $2.05**
                                          2014 EPS             $1.93**
                      *Consensus Estimates from Bloomberg as of 5/4/2017
                                     **Adjusted EPS used

                                                                                    1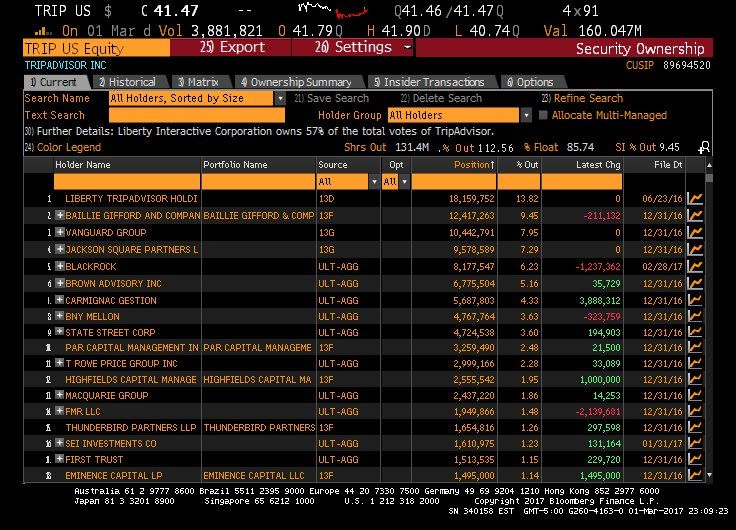
Investment Thesis for TripAdvisor, Inc. (NASDAQ: TRIP) by Arshad Ajani

Table of Contents
Executive Summary ............................................................................................................... 3
Catalysts and Risks ................................................................................................................ 3
Company Description and Historical Performance.................................................................. 3
   Business Segments .........................................................................................................................4
   Historical Performance...................................................................................................................5
Model Assumptions............................................................................................................... 8
   Balance Sheet and Income Statement Trends .................................................................................8
   Value Drivers .................................................................................................................................9
   Model Results ..............................................................................................................................10
Qualitative Analysis ............................................................................................................. 12
   A. Capital Sources Analysis ...........................................................................................................13
   B. Historical Allocation Analysis ....................................................................................................14
   C. Compensation and Corporate Governance ................................................................................16
Conclusion........................................................................................................................... 21

                                                                                                                                                 2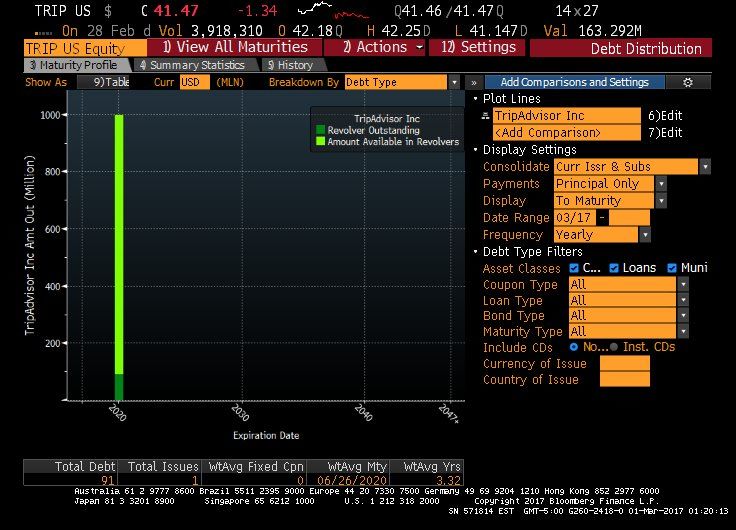
Investment Thesis for TripAdvisor, Inc. (NASDAQ: TRIP) by Arshad Ajani

Executive Summary
TripAdvisor, Inc. (NASDAQ: TRIP) owns and operates a portfolio of leading online travel brands.
TripAdvisor’s website is the world’s largest travel site with the goal of providing help to plan,
book, and experience the perfect trip. Using historical performance statistics, we have
determined through a Probabilistic Discounted-Cash-Flow (P-DCF) model that the Company is
fundamentally worth approximately $53.41/share representing a 18.66% discount to the
current market price. Through investigating their current business model and expansion
techniques we find that TripAdvisor is in a transitional period, which although does not bode
well for current investor confidence, presents an interesting opportunity to invest given that
the transition is not fully incorporated into the share price. Further, inspection of management
compensation reveals that it is aligned with investor interests through the use of large portion
of variable and performance based compensation. Thus, we rate TRIP a BUY.

Catalysts and Risks
   •   Foreign Currency Exchange rates.
   •   Slow-down in site and mobile visits.
   •   Reduction in advertising by advertisers.
   •   Consumer adoption of mobile use.
   •   Government internet privacy regulation changes.

Company Description and Historical Performance
TripAdvisor is a global travel site that uses their various platforms including the TripAdvisor
website, app, or travel partner site or apps to enable users to compare real-time pricing and
availability for multiple experiences including but not limited to: booking hotels, flights, cruises,
vacation rentals, tours, activities, and attractions. The company operates in the global travel
industry segment, with a focus in online travel activity and online advertising. The market size
for this industry is calculated through the total global travel spending which is expected to be
around $1.3 trillion in 2017 (which is a 5% increase from 2016) and of which 43% is online travel
expenditure. TripAdvisor’s internet presence reaches 48 markets and 28 languages worldwide.
The average monthly user visits is around 390 million during peak season. The website currently
features 465 million reviews and opinions on 7 million places to stay, eat, and things to do.

Currently headquartered in Needham, MA, TripAdvisor was co-founded in February 2000 by
Stephen Kaufer (President and CEO). Later, in 2004, TripAdvisor was acquired by
InterActiveCorp who later spun-off all its travel brands including TripAdvisor into a separate
corporation called “Expedia”. In December 2011, Expedia then completed its own spin-off of
TripAdvisor and shortly thereafter, TripAdvisor completed its Initial Public Offering and began
trading on NASDAQ under ticker TRIP. Liberty Interactive Corporation then purchased 4.8
million in shares of TRIP from Barry Diller (former Chairman of Board of Directors) and bought
him out of his positions. Total Liberty currently owns about 18 million common stock (13.8% of
total common stock) as well as 12.8 million Class B shares (100% of Class B Common Stock).

                                                                                                   3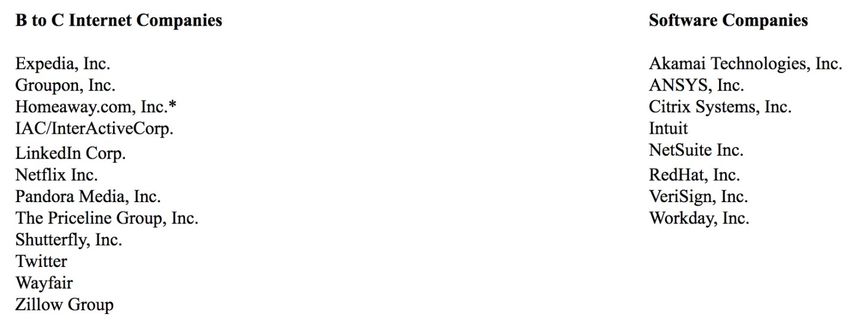
Investment Thesis for TripAdvisor, Inc. (NASDAQ: TRIP) by Arshad Ajani

Common stocks are allocated 1 vote per stock whereas Class B stocks are allocated 10 votes per
stock. Because of this distributed voting rights, Liberty Interactive Corporation currently has
56.4% voting power in TripAdvisor.

Despite a very one-sided voting share power, TripAdvisor has continued to show strong ability
to grow. Through a four-pronged approach, TripAdvisor not only states how they plan to grow
in the future, but also address their shortcomings as well. The company takes pride and
believes in the following four growth strategies: delivering a great user experience, increasing
traffic, enhancing mobile offerings, and growing attractions, restaurants and vacation rental
businesses.

Business Segments

As a global online travel company, TRIP reports two operating segments:

   1. Hotel – including all advertising and revenue for hotel based content
   2. Non-Hotel – advertising and other revenue generated through Attractions, Restaurant,
      and Vacation Rental content

A closer look at these business segments allows us to understand that the growth of the non-
hotel sector is a recent development that has started gaining traction over the last couple of
years. Including the effects of acquisitions, large growth rates have reached even over 100%
during the past few years as the new business segment finds a growth spurt.

In the figure below (Figure 1) it can be seen that although the hotel segment makes up a
majority of the revenue share today, the non-hotel segment is growing at a much faster pace.
Since 2012, non-hotel segment has grown from 4.06% of total net sales to around 20% in 2016.
This growth rate has been largely organic with introduction of rental, dining, and attraction
options.

Further, there have also been large decreases in the hotel segment revenue that has lead TRIP
to leverage marketing channels to increase their consumer base through paid and unpaid
options. TRIP has also been hurt from the increased use of mobile devices. Because users are
more heavily reliant on their mobile devices, more bookings and traction come from mobile
access compared to desktop access. This hurts the company as advertisements are less
abundant and cause a decrease in monetization.

The non-hotel segment revenue has been increasing steadily. TRIP has tried to strategically
invest in improving the user experience on all devices as well as in building inventory of global
supply of bookable attractions, restaurants, and vacation rentals. This is a relatively new
venture for TRIP and management expects this segment to continue growing around 2016
growth numbers.

                                                                                                    4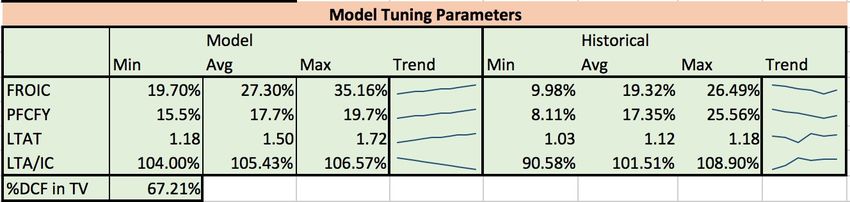
Investment Thesis for TripAdvisor, Inc. (NASDAQ: TRIP) by Arshad Ajani

Figure 1: TRIP Net Sales
Blue bars indicate Hotel segment revenue compared to a much smaller portion of Non-Hotel revenue (orange
bars). This figure also shows the increasing size of Non-Hotel segment even as a proportion of total net sales.

Source: TRIP 2016 10-K

Historical Performance

TripAdvisor’s general stock performance compared to the S&P 500 is outlined in figure 2.

Figure 2: Historical 5 Year Stock Performance
TRIP’s (white line) 5 year stock performance against SPX Index (green line).
Source: Bloomberg  Accessed 2/3/2017

                                                                                                                  5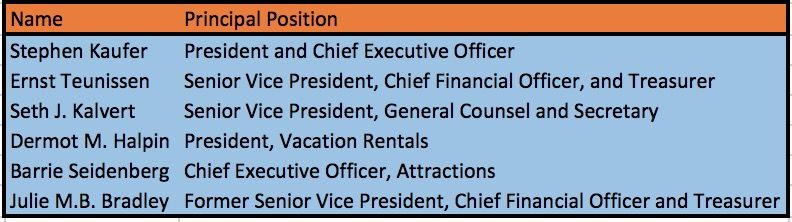
Investment Thesis for TripAdvisor, Inc. (NASDAQ: TRIP) by Arshad Ajani

Figure 3: TRIP Net Sales Growth
TripAdvisor total combined net sales across both Hotel and Non-Hotel business segments.

Source: TRIP 10-K

TripAdvisor’s historical performance is laden with strong growth especially compared to the
S&P 500 index. As a growth company, TRIP has shown that it does have strong potential to
achieve this growth in its stock price. However, due to unforeseen circumstances with certain
revenue generation techniques, TripAdvisor has experienced a decrease in 2016. This has
resulted in a downward trend that can be seen in figure 2 where the S&P index finally realizes
stronger growth.

Figure 3 helps relay the stagnation that was experienced in 2016. With strong double digit
growth rates from 2013 to 2015 of 24%, 32%, and 20%, respectively, 2016 total net sales
growth was stunted to -0.8% achieving a record low rate over the past five years. Figure 3
represents the absolute magnitude of total net sales for each year which draws a picture that
confirms the direct correlation between the stock price and revenue.

The current trends that TripAdvisor has experience are outlined as follows.

In 2015, TRIP fully rolled out their Instant Booking feature which allows users to instantly book
promoted deals from the website directly. However, because the monetization on this instant
booking feature was only through click-based advertisement, the ads monetized at a lower
revenue per hotel compared to the older metasearch feature. This resulted in a dilutive first
half of 2016 because click-based advertisements only generated revenue upon clicking on the
link and other forms of revenue generation were lagged behind and not implemented till later.
Moving forward, we expect this type of advertisement to grow revenues when click-based
revenue increases with the addition of timed revenue for longer stays. Although we expect

                                                                                                    6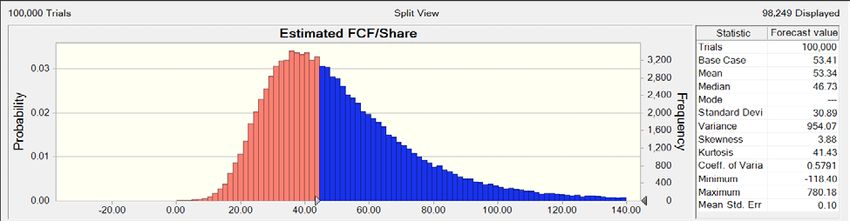
Investment Thesis for TripAdvisor, Inc. (NASDAQ: TRIP) by Arshad Ajani

sales from the instant booking feature to increase, it is important to consider the 10% decrease
in click-based advertisements during 2016 because of this small delay.

Moving on to the second type of advertising, an increase in price for display-based advertising
has lead TRIP to increase the number of display-based advertisements on their website over the
last four years. Peaking growth in 2014 with a rate of 96%, the display-based ads gained
traction from a large number of hotels, airlines, and cruises. Because display-based ads
promote specific hotel, airline, and cruise brands TRIP has seen an increase in customer
retention rates within each of these brands that TRIP promotes. Customers are likely to return
to the TripAdvisor website and book with the same hotel or airline that they previously
experienced.

Finally, there has been a large increase in “Other Revenue”. This segment includes: revenue
from click-based ads, display-based ads, and room reservations from non-TripAdvisor sites such
as smartertravel.com, independenttraveler.com, and bookingbudding.com. This segment also
contains the non-hotel segment. Attraction, restaurants, and vacation rental businesses have
increased from an increase in supply of these attraction listings and partnerships. This new
market is opening up into TripAdvisor’s online booking system. With many new partnerships to
make in this new segment, the opportunities for new advertisement deals are abundant. Thus,
it is not uncommon that we see a 91% growth of this advertisement segment in 2014. Looking
at 2015 and 2016 we notice that revenue growth is still strong at around 54% and 17%
respectively. Management suggests that although a 16.97% is nothing to scoff at; they believe
they can achieve above 20% growth rate in their “Non-Hotel” segment. To clarify, the bulk of
TripAdvisor’s “Subscription, transaction and other” is now included in their new “Non-Hotel”
business segment.

Looking at the breakdown of Hotel vs. Non-Hotel revenue we notice that 2016 has resulted in a
negative growth rate for the year across the Hotel revenue segment. Management has
suggested that this 5.78% decline is related to various macroeconomic and geopolitical
situations such as: foreign currency, terrorist events, etc. However, through looking at specific
types of advertisement, it is clear that TripAdvisor has experienced a large decrease in traction
through all forms of ads during 2016. Click-based ads are the leading source of this decrease in
Hotel revenue. With the failure of fully rolling out this type of ad with their Instant booking
feature, TripAdvisor (as mentioned previously) left a lot of monetization opportunities on the
table and has thwarted the growth of the Hotel segment.

This stunt in growth is not, however, without a resolution. With the combination of a fully
implemented Click-based ad in TripAdvisor’s instant booking feature and with hopefully stable
macroeconomic and geopolitical situations in 2017, management believes that the company
will gain a boost in their net sales and put them back on track to see large, yet sustainable,
growth.

                                                                                                 7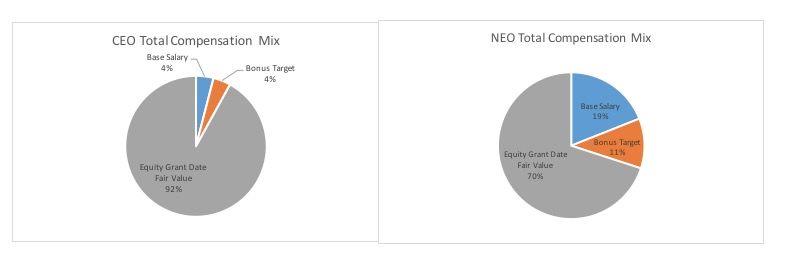
Investment Thesis for TripAdvisor, Inc. (NASDAQ: TRIP) by Arshad Ajani

Model Assumptions
Now that we have qualitatively quantified the historical performance of TRIP, we turn to the
model that will be the foundation for our quantitative analysis. The P-DCF uses historical
averages and standard deviations of growth and margins as the underlying basis of our future
projections. For TripAdvisor, we projected revenue across each of the companies operating
segments. We find that TRIP models better when broken up into multinational business
segments rather than multi-business geographies as per its management structure and
historical growth averages per segment. Further, data that was provided on the 10-K SEC filings
for revenue growth were better organized for each business segment rather than each region.

Balance Sheet and Income Statement Trends
The results are contained in the ‘Balance Sheet’ and ‘Income Statement’ tabs of the
accompanying spreadsheet.

The first thing we notice upon glancing at the balance sheet is the steady Cash and Cash
Equivalents growth from $368 million in 2012 to $614 million 2015. However, from 2015 to
2016 we see a stagnation in the amount of cash. Further questioning reveals that this is a result
of a reliance on various credit facilities to finance the company rather than cash. This has lead
to a small increase in the growth rate of Working Capital from -1.62% in 2015 to -0.66% in 2016.
With this dependence on credit facilities extending to the future, we expect Working Capital to
continue to increase and hit positive growth in fiscal year 2017.

Further, TripAdvisor clearly lists out their uses of cash in their 10-K filings as a means to fund
working capital requirements, CAPEX, and to meet long-term debt obligations and other
financial commitments. However, with the introduction of credit facilities in 2011 and then a
renewal in 2015, we see the reliance on cash decrease. TRIP states that if cash is scarce and
there is not enough to provide for the various operating factors, management will take on debt
from the remaining $906 million of borrowing capacity under the 2015 Credit Facility. The
company states this as their first action plan followed by a reduction in CAPEX and a scale back
of the scope of business growth initiatives.

The large increase in Property and Equipment is mainly a result of increasing their various office
spaces. With 49% of employees outside of the US, there is a need to grow office space
domestically and internationally. Currently there is 465,000 square feet in office space around
the world. Special attention is placed on the new headquarter office in Needham, MA. With a
280,000 square feet building opened in 2015, there is a large increase in Property and
Equipment in 2014 and 2015 due to the recognition of this large investment.

Current portion of the debt decreases rapidly in 2015 because of the initiation of 2011 Credit
Facility repayment. As a result, TRIP is not expected to have any residual debt from the original
2011 Credit Facility but will consequently have debt from the 2015 and 2016 Credit Facilities.

                                                                                                 8
Investment Thesis for TripAdvisor, Inc. (NASDAQ: TRIP) by Arshad Ajani
2016 Credit Facility will take on a $76 million value and 2015 Credit Facility will bare a $290
million burden to repay the 2011 Credit Facility.
Turning our attention to the Income Statement, we notice strong top-line revenue growth
around 19%. However, a huge stunt is also noticeable from 2015 to 2016. This is because of the
previously mentioned delay in implementation of click-based advertisement in 2016. Overall,
during the past five years, it is easily seen that TripAdvisor is in a strong growth stage where
they are still making progress in entering new markets within both of their business segments.
Management believes that although 2014-like revenue growth of 31.85% is not sustainable, a
more reasonable 20% growth estimate is likely.
Moving down the Income Statement, we move on to the Cost of Revenue. This line item
includes: direct costs and personnel and overhead costs. These costs increased by a total of $13
million during 2016 because of an increase in transaction costs from acquiring growth in
Attraction and Vacation Rentals. Although management states that these costs were
mandatory during 2016, we expect this not to turn into trend in the future and expect long run
Cost of Revenue to decrease with lower frequency in new business acquisitions.
With the large acquisition of online traffic - through new Attraction and Vacation Rentals
mentioned in the above paragraph - Selling and Marketing has increased over the last couple of
years. These costs totaled $79 million in 2016 but were offset by a decrease in TV
advertisement of around $50 million that was initiated in 2015. There has been a strong
correlation with increased online traffic and Selling and Marketing costs and we expect this to
continue.
Moving on to the Income Tax, we can see a uniquely low effective tax rate of just 20.5%. To
better understand this, we must comprehend the average corporate tax rate in America of 34-
35%. This lower than usual tax rate is due to a large amount of business that is conducted and
revenues are also realized abroad. In 2016, about 46% of total sales were from regions outside
of the United States. During recent years there has also a slight increase in the percent of
revenue that comes from abroad. In 2016, there was a 7% increase in these foreign
transactions.
Value Drivers
The results are contained in the ‘P-DCF’ tab of the accompanying spreadsheet.
Although we have seen large top-line sales growth, the consistency of such strong numbers is a
bit flawed. To better understand this fluctuation, we notice the average 13.92% standard
deviation that is associated with total net sales. This high standard deviation is especially due to
high growth in 2014 from a large boost in Non-Hotel revenue followed by a large slump in 2016.
2014 revenue was also especially due to the inorganic growth through the acquisition of Viator
(a leading resource in researching and booking destination activities around the world) for $192
million. This acquisition along with six other acquisitions totaled $208 million in cash and was
9Investment Thesis for TripAdvisor, Inc. (NASDAQ: TRIP) by Arshad Ajani
booked in 2014. This large increase in sales created a large separation from the average
revenue that TripAdvisor had been expecting and has further added to the standard deviation.
In a broad analysis of the value drivers, it can be seen that the operating costs from year to year
seem to be increasing due to the proclaimed idea that increasing costs is a natural part of
growth. This might not be an issue if operating costs were only increasing in absolute value,
however we notice increasing costs even as a percentage of sales. The largest increase in
operating costs can be attributed to selling & marketing. However, from 2015 to 2016 there has
been around a 5% increase in selling & marketing and around a 2.5% increase in technology and
content yet total net sales have decreased 0.8% during this same period. Although this negative
correlation between increased costs and decreased revenue is worth mentioning it must be
taken with a grain of salt.
TripAdvisor has found a new niche in the form of Non-Hotel revenue which management
suggests still has a lot of potential to grow as it is still relatively new to the company’s business.
Although we have seen large increase in expenses from various forms of operating costs, the
risk-reward could be well worth it. For our long-run assumptions we turn to the next section –
Model Results.
Model Results
Values are contained in the P-DCF and MC tabs of the accompanying spreadsheet
The assumptions on the P-DCF tabs are as follows.
For Hotel revenue we took into consideration that the instant booking feature monetized at a
lower rate than expected during 2016. However, during the 2nd half of 2016, click and
transaction based growths did improve. This improvements during the latter half of 2016
indicates strong growth into 2017 and in the long run. We cannot expect significant growth (like
we do in the Non-Hotel segment) because this segment is well established as a part of TRIP but
we can assume that solid growth rates continue onto the next decade. For these reasons along
with management’s guidance that includes steady revenue streams due to better economic
situations next year and various obstacles that were experienced in 2016 that will not be
repeated, we set Hotel revenue growth to 13%.
Non-hotel revenue is a relatively new segment for TripAdvisor and is where we expect a bulk of
the large growth rate occurring. The 27% growth from 2016 indicates where TRIP believes it
should be. Management guidance suggests that the revenue growth seen in 2016 is not
unexpected or an anomaly but rather will be the norm for the next few years as TRIP continues
to grow their customer base through increased services in this sector. New services include:
increased customer experience and building new inventory of global supply. We here set the
assumption at 25%, then decrease the assumption to 20% for 2018 to 2019 and then assume
15% for 2020 and 2021, then finally assume a long-term growth rate at 13.64% (equivalent to
Hotel segment long-term growth rate) starting in 2022.
10Investment Thesis for TripAdvisor, Inc. (NASDAQ: TRIP) by Arshad Ajani
Display-based advertisement has seemed to lose its traction in the past few years. Unlike click-
based advertisements, management provided no growth reversal of the downward trend
apparent in display-based advertisements over the past few years. Because of this lack of
guidance, we estimate there be a lower growth rate from this segment. We do not zero-out this
line because there is a believed increased in the overall growth of the hotel segment as
TripAdvisor continues to grow their market share into the travel industry. This will, as a
consequence, also naturally increase display-based advertisements.
Operating costs were kept as average values because trends that we have seen in the past are
expected to continue in the future. With earlier discussion of these costs, we assume that with
the growth of TripAdvisor business segments, there will be a slight upward trend in these costs.
Finally, while comparing the model Free Cash Flow Return on Invested Capital (FROIC),
Potential Free Cash Flow Yield (PFCFY), Long Term Asset Turnover (LTAT), and Long Term
Asset/Invested Capital (LTA/IC) we see that we are relatively within the bounds of historical
values. Although our model pushes the historic average trends, we are hypothesizing a growth
play. According to TRIP management, we can expect company growth especially in the Non-
Hotel revenue segment as TRIP continues to show new growth initiatives through capitalizing
on mobile and phone use and branching out into new segments (attractions, restaurants, and
vacation rentals).
From figure 4 below we can see that average model FROIC has been pushed to 27.30% which
hits the historical max. This can be justified by noticing the assumption on revenue growth.
Because 2016 exhibited poor performance compared to the past four years, historic FROIC was
brought down significantly. We expect an upward trend FROIC and believe that by letting
average model FROIC be similar to historic highs we get a fair valuation of where the company
is expected to grow.
PFCFY, LTAT, and LTA/IC all are within historic ranges. LTAT has been very stable since 2012
with a minimum of 1.03 and a maximum of 1.18. These stable conditions show that TripAdvisor
has set a baseline for its growth yet expects stronger growth to come. Although PFCFY hit
25.56% in 2012, these rates have been decreasing ever since then. Slowing its downward trend
in 2014, we expect stability in long run PFCFY rates at historical averages. Finally, LTA/IC has
been on an upward trend ever since 2012. Starting at 90.58% in 2012, PFCFY has increased to
over 100% by 2014 and still continues to rise. Because of this strong upward trend, we feel
comfortable with a slightly high LTA/IC average in our model.
11Investment Thesis for TripAdvisor, Inc. (NASDAQ: TRIP) by Arshad Ajani
Figure 4: Model Tuning Parameters
Compares various model tuning parameters (FROIC, PFCFY, LTAT, LTA/IC) between our model
and historic data. Used to compare validity of our assumptions.
Source: Calculated through TRIP 10-K and 10-Q data
Lastly, the free cash flow per share obtained from these assumptions is $53.41. The current
price upon this evaluation is $45.01 per share. This represents a 18.66% upside to this
investment. To asses how well-determined these forecasted values were, we performed a
Monte-Carlo (MC) Simulation (see figure 5).
Figure 5: TRIP Monte Carlo Distribution Simulation
These are the results from 100,000 Monte-Carlo simulations of TRIP’s P-DCF. The data ranges
from -$40.00 per share to around $140.00 per share. The pink portion to the left indicates the
probability of a stock price below the current market price. The blue portion represents the
opposite, the probability of TRIP’s stock price coming above the current market price.
Source: Monte-Carlo Simulation, Crystal Ball.
The current price during this analysis falls into the 53rd percentile of this simulation. This
indicates that there is a 53% chance of long-term free cash flow per share exceeding today’s
market price. This shows that there is great potential value in an investment made today to see
returns in the future. Because of these large margins that are observed, there seems to be a
strong value proposition today as the value behind this Company is largely deflated by weak
2016 results.
Qualitative Analysis
12Investment Thesis for TripAdvisor, Inc. (NASDAQ: TRIP) by Arshad Ajani
A. Capital Sources Analysis
Although currently not highly leveraged, TripAdvisor uses debt to finance most of its deals and
day to day activities. The company has a Net Debt/EV of -9.35%. This is a result of $746.0
million in cash and cash equivalents on its books versus its current $91 million in debt. Over the
past half a decade, TripAdvisor has taken on about $461 million in revolving debt and $370
million came to maturity this past December (12-20-2016).
The Egan-Jones rating for TripAdvisor’s senior unsecured loan is an A+. Total outstanding debt is
currently $91 million. The company also has a $1 billion revolver agreement with JP Morgan
Chase Bank since 6-26-2015. This revolver has a $3,500 transfer fee with a minimum transfer
amount set to $5,000,000 and a Commit Fee of 20 basis points. No further debt has been taken
on by TripAdvisor.
Figure 6: Debt Distribution
The current portion of the revolver being used (dark green, bottom) is a small portion of the
total available revolver (light green, top). Further, debt is minimal and is accessed only through
a credit revolver.
Source: Bloomberg Accessed 2/28/2017
From previous years, we have seen that management is not afraid to take on debt and use their
revolver to make important M&A deals happen. We have seen this occur when TripAdvisor
13Investment Thesis for TripAdvisor, Inc. (NASDAQ: TRIP) by Arshad Ajani
took on $400 million in debt on 12-27-2013 in anticipation of their acquisition of Viator Inc. This
deal was TripAdvisor’s largest acquisition at $200 million in cash. Further, in October of 2016
TripAdvisor paid $15.5 million in cash to acquire Eatigo. Although no explicit plans of future
acquisitions have been stated, through looking at historic acquisitions we expect that
TripAdvisor will continue to grow through mostly bolt-on acquisitions.
TripAdvisor also uses Credit Facilities to finance many of their operations. These Credit Facilities
are credit agreements that allow for immediate borrowing by TripAdvisor as well as repayment
date set by the lender or lenders. Further, no interest will accrue unless there is outstanding
debt taking on by TripAdvisor after the date of the repayment is set by the lenders. The 2015
Credit Facility took on a $290 million value that was immediately borrowed which was used to
pay of the 2011 Credit Facility. More recently, the 2016 Credit Facility provided a $73 million
unsecured revolving debt. Chinese Credit Facilities in addition to the 2015 and 2016 Credit
Facilities provide short term borrowings of $7 million in 2016 and $1 million in 2015 (see figure
6, above).
Inspection of the equity reveals that extra equity has been added to the company. We must be
careful in assessing TripAdvisor’s equity growth as with increasing number of investors, an
investment made today might be diluted tomorrow due to offering of more shares. The
company seems to have offered additional shares since its IPO through the “Amended 2011
Plan” which has stated that up to 32,400,000 shares will be awarded with the Compensation
Committees’ discretion to directors, officers, employees, and consultants of TripAdvisor. This
initiative will be used as a stock option compensation program to help garner support in the
company by internal members. As a disclaimer, according to the DEF-14A filling for TRIP, the
“exercise price may not be less than the fair market value” 1 which essentially means that these
shares may appreciate but cannot depreciate in value. This additional shares award program
will not dilute any equity stake that we may take in this company as this was strictly a one-time
program closely correlated with TripAdvisor’s IPO.
B. Historical Allocation Analysis
Here, we focus our attention to Fiscal Year End 2013 and 2014. In 2013, we first notice a large
decrease in Working Capital. This is likely a result of the introduction of the $370 million loan
they took on through the revolver debt. With this debt we notice a large increase in cash which
increases the “Cash and Cash equivalents” line in figure 7 below. With a higher cash value and
considering that “Working Capital = Current Assets – Current Liabilities – Cash and Cash
Equivalents”, our Working Capital is brought down by the addition of more cash (which
decreases the value of Current Assets – Cash). Next, we notice a large increase in long-term
assets as a result of an increase in marketable securities, goodwill, and PP&E from a number of
smaller acquisitions and debt acquisitions in 2013. CAPEX and Invested Capital also follow in
these footsteps, resulting in large upward swings (see figure 7).
1TripAdvisor (2017). Form DEF-14A 2016. Retrieved from SEC Edgar website
https://www.sec.gov/edgar/
14Investment Thesis for TripAdvisor, Inc. (NASDAQ: TRIP) by Arshad Ajani
Figure 7: Additional Calculations
This figure shows the calculation of Working Capital and Change in Working Capital, Capital
Expenditures, and Invested Capital.
Source: TRIP 10-K
As mentioned previously, TripAdvisor has a history of mostly doing bolt-on acquisitions which
allows them to add new services to their existing platform. Some of their key acquisitions are
Viator in July of 2014 and Eatigo in October of 2016. Viator was a $200 million cash deal that
allowed TripAdvisor to expand its reach. Unfortunately, no information about its market
premium has been released, however with such a seamless transition into TripAdvisor, Viator
was able to create a positive impact on TripAdvisor (seen through a jump in revenue and sales
numbers). Eatigo, Bangkok’s number one dining deals and restaurant reservation portal, has
not only allowed TripAdvisor to expand on their services into the food industry but has also
created a new customer base. Through tapping further into the Thailand and Singapore
markets, TripAdvisor more deeply exemplifies its tendency to do vertical integration bolt-on
acquisitions rather than horizontally expanding their business line and diving into completely
new industries.
Finally, we must also note that in December 2012, Liberty Interactive Corp acquired 4.8 million
shares of TRIP. This was a result of Barry Diller’s stepping down as the chairman of TripAdvisor
as he sold his stake in the company. Liberty Interactive paid $300 million in cash which is
around $62.50 a share (about a 63% premium over the current $38.39 stock price).
It is also worth noting that TripAdvisor does not give out dividends on their TRIP common stock.
However, in February of 2013, the board of directors did authorize the repurchase of $250
million in common stock under the repurchase program. A total of 1,651,957 common shares
were repurchased at an average price of $50.76. Further, as of December 31, 2016, there have
15Investment Thesis for TripAdvisor, Inc. (NASDAQ: TRIP) by Arshad Ajani
been a total of 4,123,065 common shares repurchased at an average price of $60.63. Lastly, on
January 25, 2017, Board of Directors authorized a $250 million stock repurchase under a new
share repurchase plan. Next we will discuss whether certain compensation techniques lead to
specific business related decisions.
C. Compensation and Corporate Governance
To introduce the executive officers that will be mentioned throughout this section of the
investment thesis we turn to figure 8 below that reveals the names of the Chief Executive
Officer (CEO) and other Names Executive Officers (NEO) followed by their role or title in the
company.
Figure 8: Executives and respective titles
Figure displays the names of all executives who are mention in TRIP’s DEF-14A and their
corresponding titles to the right of their names.
Source: TRIP DEF-14A
TripAdvisor takes pride in not only portioning their compensation through variable means but
also through long-term incentive devices. The CEO, Stephen Kaufer, has a compensation plan
that is 96% variable and 4% fixed annually. Other NEOs lean a bit more towards fixed
compensation at around 19% but still mainly rely on their 81% variable compensation. These
statistics show that TripAdvisor tries and keeps management on their toes with each year’s
compensation uniquely adjusted as per guidelines and metrics that will be explained later.
Further, the long-term growth and stability is better protected through high stakes in long-term
compensation. The CEO’s compensation is 96% long-term whereas NEO’s compensation is
about 85% long-term. This suggests that TripAdvisor is cautious with taking risk for short-term
gains in the company. Whether these short- and long-term metrics correctly align with our
analysis beliefs, we will see in the next few paragraphs.
16Investment Thesis for TripAdvisor, Inc. (NASDAQ: TRIP) by Arshad Ajani
Figure 9: Compensation Mix
The pie chart on the left represents the percentage of CEO pay that aligns with the specific
compensation type whereas the right pie chart represents the NEO percentage per
compensation type.
Source: TRIP DEF-14A
TripAdvisor executives are mostly compensated through equity positions through stock options
and Restricted Stock Units (RSU). The figure above (figure 9) displays the large percent of
compensation that is allocated to these equity compensation devices. RSUs hold specified
vesting time periods, strict performance criteria, and or have requirements to stay employed
with TripAdvisor for a longer period of time. Vesting period for each executive’s compensation
is handled on a case by case basis however it cannot last longer than 10 years and is usually set
to around four years. Longer vesting periods around four years or more suggest good long-term
incentives for executives. Equity awards are granted after review of the following factors:
1. TRIP business and financial performance
2. Dilution rates
3. Non-cash compensation as a percentage of EBITDA
4. Peer company equity compensations (see figure 10 for peer companies)
5. General economic conditions
6. Competitive market compensation
The list above is shown for illustration purposes of the vague nature with which TripAdvisor
describes their exact criteria. Although not disclosed, stock options are adjusted with major
changes each year in accordance with figure 11 that summarizes overall compensation by year.
Large dips in stock award for a majority of NEOs in 2015 suggest that compensation is aligned
with performance.
17Investment Thesis for TripAdvisor, Inc. (NASDAQ: TRIP) by Arshad Ajani
Figure 10: TripAdvisor Peer Group
Figure lists the competitive peer group that TripAdvisor uses to make market-competitive
compensation decisions.
Source: TRIP DEF-14A
Since TripAdvisor does provide a large amount of equity based compensation, there is a
Clawback policy in place. TripAdvisor reserves the right to reclaim equity securities of common
stock or demand for the repayment of the aggregate value of all shares of common stock.
Transitioning to cash awards, we see more clarity with exact targets.
Cash bonuses are based on TripAdvisor’s “pay for performance philosophy”. This suggests that
all aspects of compensation are based on the company’s performance during the given period.
Short-term incentives and eligibility for Annual Cash Bonus is allocated if two requirements are
met:
1. “The revenues of TripAdvisor in any of the three consecutive calendar quarters
beginning with the second quarter of 2015 must be at least 10% higher than the
revenues in the corresponding calendar quarter 12 months before, excluding the
benefit of any acquisitions by TripAdvisor during this period” 2
2. “The closing price per share of TripAdvisor common stock must be at least 5%
higher than the closing price of TripAdvisor’s common stock on February 5, 2015,
which was $70.58 per share, on any 30 trading days during the period beginning
February 6, 2015 and ending December 31, 2015” 3
As a quick note of the metrics used, TripAdvisor uses no adjusted metrics in their calculation of
Qualified Performance-Based Compensation under Code Section 162(m). Although the exact
2 TripAdvisor (2017). Form DEF-14A 2016. Retrieved from SEC Edgar website
https://www.sec.gov/edgar/
3 TripAdvisor (2017). Form DEF-14A 2016. Retrieved from SEC Edgar website
https://www.sec.gov/edgar/
18Investment Thesis for TripAdvisor, Inc. (NASDAQ: TRIP) by Arshad Ajani
guidelines for the current fiscal year can be a bit vague, the metrics they use are GAAP
measurements and not adjusted.
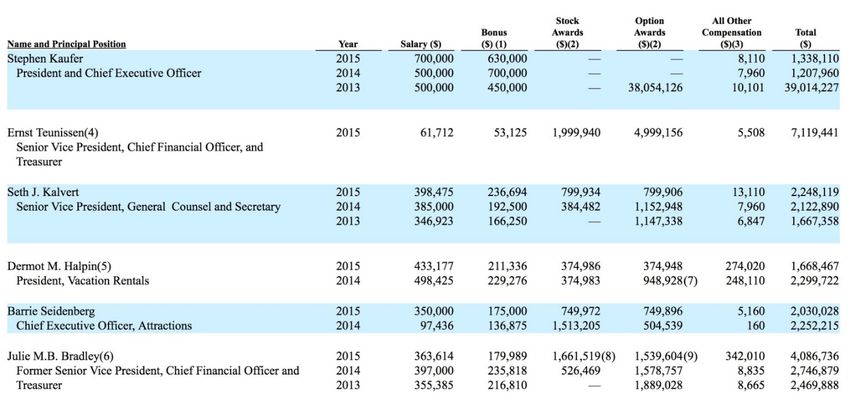
Although exact compensation metrics and targets are a bit vague, exact compensation values
based on TripAdvisor’s techniques are exhibited in the figure below. An overall summary of
management compensation from 2013 to 2015 are outlined in figure 11. We can see that in
August 2013, Mr. Kaufer was awarded $38,054,126 in stock options. Although seemingly
alarming, Mr. Kaufer has elected to not participate in equity awards until the end of fiscal year
2017. Further, his shares will vest in equal installments of 4 and 5 years to keep long-term
equity awards protected.
Figure 11: Summary of Executive Compensation
Figure displays executive total compensation broken down into various segments.
Compensation is displayed for 2013, 2014, and 2015.
Source: TRIP DEF-14A
The top 18 shareholders of TRIP stock are listed in figure 12 below. This figure shows that
Liberty TRIP, Baillie Gifford and Company, Vanguard, Jackson Square Partners, and BlackRock
are the top five shareholders owning 13.82%, 9.45%, 7.95%, 7.29%, and 6.23%, respectively.
Further we notice that there has not been a great deal of insider trading recently. A detailed
timeline of all open market insider trading over the last 12 months are detailed in figure 13
below.
19Investment Thesis for TripAdvisor, Inc. (NASDAQ: TRIP) by Arshad Ajani
Figure 12: TRIP Institutional & Insider Shareholders
The figure shows TRIP’s largest shareholders. TRIP has a total of 131.4 million shares
outstanding
Source: Bloomberg Accessed 3/1/2017
Figure 13: Insider Transactions
This figure shows TRIP’s Open Market transactions for the trailing twelve months. The red flags
indicate a sell transaction while the green flags indicate a buy transaction.
Source: Bloomberg Accessed 5/11/2017
20Investment Thesis for TripAdvisor, Inc. (NASDAQ: TRIP) by Arshad Ajani
Conclusion
We believe that TripAdvisor is a company with potential to increase their growth in the years to
come. Today, TRIP is experiencing great changes within their company with major changes from
new credit facilities, implementation of more non-hotel based revenue, as well as newer
advertisement monetization technologies. Although this transitional period has resulted in
weak results for 2016 it shows the company’s ability to take risks and strive for long-term
growth. 2016 has been burdensome on TripAdvisor through many macroeconomic situations
occurring in domestic and international regions, that we expect not to reoccur during the
coming years. In the end, the fundamental value of the company largely comes from its ability
to tap into new segments and sustain their high-growth claims which we believe TRIP will have
minimal trouble achieving.
For these reasons along with our P-DCF model calculating a 18.66% upside margin to an
investment today, I rate TRIP a BUY.
21You can also read