Study of Manifestation of Civil Unrest on Twitter - ACL Anthology
←
→
Page content transcription
If your browser does not render page correctly, please read the page content below
Study of Manifestation of Civil Unrest on Twitter
     Abhinav Chinta∗ and Jingyu Zhang∗ and Alexandra DeLucia and Mark Dredze
          Center for Language and Speech Processing, Johns Hopkins University
          {achinta3, jzhan237, aadelucia, mdredze}@jhu.edu

                                          Anna L Buczak
                         Johns Hopkins University Applied Physics Laboratory
                                  Anna.Buczak@jhuapl.edu

                      Abstract
    Twitter is commonly used for civil unrest de-
    tection and forecasting tasks, but there is a lack
    of work in evaluating how civil unrest man-
    ifests on Twitter across countries and events.
    We present two in-depth case studies for two
    specific large-scale events, one in a country
    with high (English) Twitter usage (Johannes-
    burg riots in South Africa) and one in a coun-
                                                          Figure 1: Example tweets from Johannesburg riots in
    try with low Twitter usage (Burayu massacre
                                                          South Africa. The tweets were found through their use
    protests in Ethiopia). We show that while there
                                                          of event-related hashtags. Paraphrased for privacy.
    is event signal during the events, there is little
    signal leading up to the events. In addition to
    the case studies, we train n-gram-based mod-            such as Twitter capture activities around civil un-
    els on a larger set of Twitter civil unrest data
                                                            rest. Previous work has considered the task of pre-
    across time, events, and countries and use ma-
    chine learning explainability tools (SHAP) to           dicting protests or riots using social media, often
    identify important features. The models were            with the aid of news sources (Alsaedi et al., 2017;
    able to find words indicative of civil unrest that      Ramakrishnan et al., 2014; Osborne and Dredze,
    generalized across countries. The 42 countries          2014; Islam et al., 2020; Edouard, 2018; Korolov
    span Africa, Middle East, and Southeast Asia            et al., 2016; Ranganath et al., 2016; De Silva and
    and the events range occur between 2014 and             Riloff, 2014; Littman, 2018).
    2019.
                                                               In this paper we consider how these activities
1 Introduction                                              manifest themselves on Twitter. Specifically, we
                                                            consider events across a range of countries to under-
Citizens utilize public demonstrations, protests, stand how Twitter is used by different populations.
and in extreme cases, riots, to express dissatisfac- Our analysis has two facets: (1) qualitative case
tion over the current political or social state in their    studies focusing on two specific events in coun-
country. Some of these movements successfully               tries with different civil unrest rates and Twitter
achieve government reforms, many do not. These              usage patterns and (2) a quantitative analysis to
movements are often driven from the ground up, by           find indicators of civil unrest that generalize across
grassroots advocacy that snowballs into social and          countries and events.
political change. Understanding the factors that               For the case studies, we look at the 2019 Johan-
drive sociopolitical change can help policy makers          nesburg riots in South Africa and the 2018 Burayu
and advocates petition for and advance their causes. Massacre and subsequent protests in Ethiopia. We
   Since these causes emerge from the public, chose these events because they were significant
studying them requires data on public attitudes, per- within those countries and received global attention.
ceptions, and actions around previous movements. Their scale should mean they are reflected on so-
In particular, understanding the factors behind civil       cial media. Furthermore, these countries have high
unrest based on social media posts can reveal im- (South Africa) and low (Ethiopia) Twitter usage,
portant trends. However, while social media data            and the majority of their tweets are in English. For
reflects many public attitudes, it’s unclear how sites      each event we ask: (1) is the event discussed on
    ∗
      Equal contribution.                                   Twitter? (2) is there any noticeable buildup to the
                                                         396
 Proceedings of the 2021 EMNLP Workshop W-NUT: The Seventh Workshop on Noisy User-generated Text, pages 396–409
                         November 11, 2021. ©2021 Association for Computational Linguistics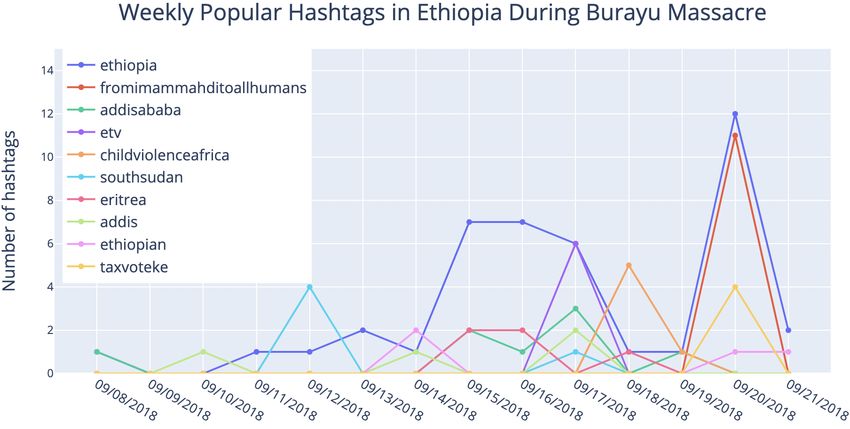
event? (3) who is talking about the event? (4) do                     data collection (Alsaedi et al., 2017). The num-
tweets reflect the issues that motivated the events?                  ber of tweets by country before and after filtering
   We then take a quantitative approach to find gen-                  for language and relevance are shown in Figure 2.
eralizable indicators of civil unrest across time,                    Only a small number of these countries have a large
events, and countries. This focus on general-                         number of English tweets, and we consider many
izability is motivated by previous work that de-                      to be “low data" countries. This low amount of data
tects/forecasts unrest across countries or regions                    can be due to low country internet usage in gen-
(Alsaedi et al., 2017; Ramakrishnan et al., 2014;                     eral, low popularity of Twitter in the region, or low
Islam et al., 2020; Korolov et al., 2016; Ranganath                   prevalence of English. The language breakdown of
et al., 2016), and the desire to have a single model                  each country is in Appendix Figure 8.
perform well across countries. For this analysis we
introduce n-gram models trained on a new dataset,                     2.2    Civil Unrest Ground Truth
Global Civil Unrest on Twitter, or G-CUT, which                       We use a combination of ACLED and Wikipedia
spans 42 countries from Africa, the Middle East,                      to determine whether a riot or protest occurred.
and Southeast Asia, and riots and protests from                       We are focused on events that are reflected in
2014 to 2019. We evaluate model generalizabil-                        these sources and also appear on Twitter. We se-
ity by checking not only the overall performance,                     lect ACLED instead of other civil unrest event
but also the per-country performance. Also, we                        databases (e.g., GDELT (Leetaru and Schrodt)) be-
use AI explainability tools (SHAP) to analyze the                     cause it is freely available, manually curated by
top indicators and ensure they are not country- or                    regional experts, and provides simple event catego-
event-specific.                                                       rization.
   All data (tweet IDs), models, and code will be                        From ACLED we select events of the types Riots
made publicly available at https://github                             and Protests for our automated analysis. Data was
.com/AADeLucia/civil-unrest-case                                      downloaded from 2014-2019 using the data export
-study.                                                               tool3 . The events in ACLED range from small- to
                                                                      large-scale, but the scope of the event is not clearly
2     Data                                                            reflected in ACLED. For the case studies we uti-
We analyze Twitter since it is a widely used social                   lize Wikipedia, since it contains information about
media platform, with many public posts about ma-                      large-scale events that likely appear on Twitter. The
jor events in real-time. For ground-truth data on                     ACLED coverage information for each country is
civil unrest we use the Armed Conflict Location &                     in Figure 2. Most countries have at least 500 events
Event Data Project (ACLED) (Raleigh et al., 2010),                    in the 6 year period.
a manually curated database tracking civil unrest
events.                                                               3     Case Studies

2.1    Twitter Collection                                             We focus on two countries with differing levels
                                                                      of available English tweets and civil unrest levels
We collected geotagged tweets from the Twitter                        according to ACLED: South Africa and Ethiopia.
streaming API from 2014 to 2019 (inclusive) for                       South Africa is a high-data country (i.e., has an
42 countries from Africa, the Middle East, and                        abundance of English tweets) with high rates of
Southeast Asia. We selected English tweets us-                        civil unrest (almost 2,000 events in the 6 year pe-
ing langid (Lui and Baldwin, 2012).1 Appendix                         riod), and Ethiopia is a low data country with rela-
Table 4 lists the number of tweets per country.                       tively lower rates of civil unrest (almost 600 events).
   To focus on relevant tweets we filter our data us-                 These two countries are not representative of all
ing the BERTweet civil unrest tweet classifier from                   countries, but do provide insight on issues that may
Sech et al. (2020).2 We keep tweets with prob-                        arise when using Twitter data from high and low
abilities above 0.5. Previous work has achieved                       data countries for civil unrest detection and fore-
this filtration using keywords (Muthiah et al., 2015;                 casting.
Ramakrishnan et al., 2014) or focus on post-event
                                                                         For each country, we select a single event and
    1
      Twitter provided language identification was not available      ask: (1) is the event discussed on Twitter? (2)
for the early years in our dataset.
    2                                                                   3
      The model has a test F1-score of 0.81 for identifying civil         https://acleddata.com/data-export-to
unrest-related tweets.                                                ol/
                                                                    397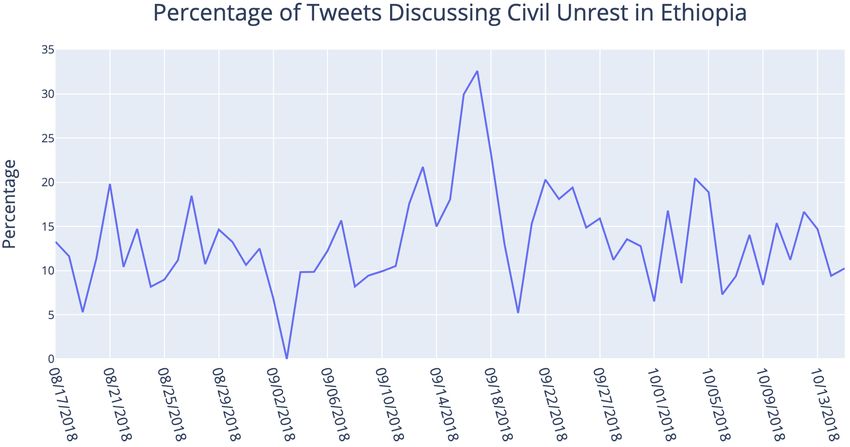
platform in the country. We examine the 2019 Jo-
hannesburg riots, a large-scale event that took place
in Johannesburg, South Africa, during the period
September 1-5, 2019. The riots were the culmina-
tion of two unrelated incidents: (1) the murder of
a taxi driver by an immigrant and (2) the sexual
assault and murder of a college student, Uyinene
Mrwetyana, on August 24, 2019.4 The close timing
of the incidents caused uproar about xenophobia
and gender-based violence in the country.
We first explore if the event is discussed on Twit-
ter. Figure 3a shows the ratio of civil unrest-related
Figure 2: The average number of tweets in the dataset tweets (i.e., filtered tweets) during the week of the
per ACLED event for the selected 42 countries. Counts riots. The ratio is highest during the riots (Septem-
for English tweets and filtered English tweets are ber 2-5). On September 3 almost 30% of all tweets
shown. Events are limited to ACLED types Riots and were civil unrest-related, though the civil unrest
Protests. score from the filtration model does not determine
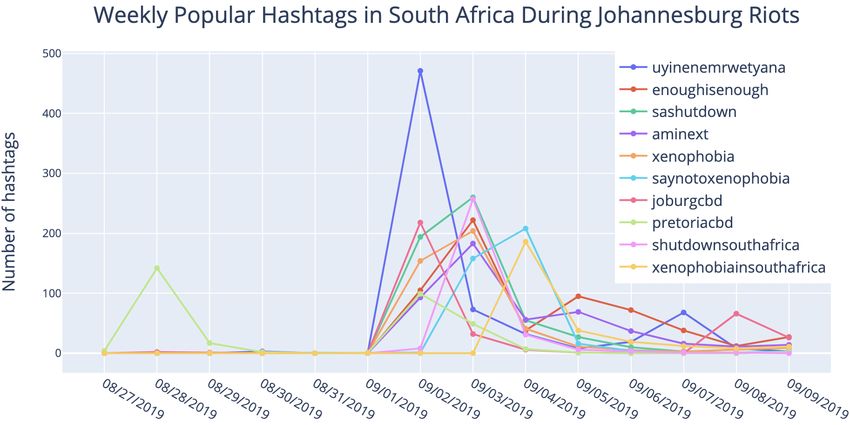
if the tweets discuss the event in question. We next
use hashtags to measure popular topics and find
is there any noticeable buildup in Twitter activ-
that the top hashtags correspond to the riots (Figure
ity prior to the event? (3) who is talking about
4a). Hashtags are counted using only the filtered
the event? We limit our study to events with a
tweets, but the top hashtags from all tweets are in
clear start and end date (e.g., a specific protest)
Appendix Figure 9a. All hashtags were lowercased
as opposed to general sociopolitical movements
to ensure accurate counts across hashtag variation.
with a buildup over years (e.g., a Black Lives Mat-
Some of the hashtags are popular enough to be in
ter (BLM) protest in the US versus studying the
both filtered and unfiltered analysis.
BLM movement). For (1) we look at the ratio of
civil unrest-related tweets to all tweets (the rele- Conversations about both the rise of xeno-
vance classifier discussed in §2) and then proxy phobia and gender-based violence are visible
the Twitter discussion through popular hashtags. from the hashtags, some even calling to “shut
The analysis for (2) is important for systems that down" the country in a state of emergency
aim to forecast civil unrest. To approximate event (e.g., #shutdownsouthafrica). The
“buildup" we expand our scope from the day of the gender-based violence discussion centers around
event to a few days before and after. This analysis the victim’s name and other slogans which
looks at the emergence of event-related hashtags questions the safety of women in the country
and whether Twitter is used in event buildup or is (e.g., #aminext and #uyinenemrwetyana).
more reactionary. For the question of who is talk- The xenophobia discussion centers around
ing (3), we use user verification status and rates hashtags containing “xenophobia", such as
of likes and retweets as a heuristic for influential #xenophobiansouthafrica. The loca-
users. Only users active in the one week time frame tions of large protests are also identified, with
are included. joburgcbd (Johannesburg central business
district) and #pretoriacbd (Pretoria central
After the case studies, we test how well post-
business district). The riots started in Pretoria and
event knowledge can help with data filtration.
then spread to Johannesburg, and this is shown in
Other work uses location, time, keyword, or hash-
the hashtag popularity for the week. An example
tag information gathered through post-event analy-
tweet from the event is in Figure 1.
sis (Littman, 2018; Alsaedi et al., 2017). For this
experiment, we use the provided ACLED descrip- While the rise in civil unrest tweets corresponds
tions of the events to query event-related tweets. to the dates of the protest, we see that there is no
gradual rise in the unrest. This may be due to bias
3.1 South Africa: Johannesburg Riots in data collection or the time needed to rally around
South Africa is prominent in our dataset due to the 4
https://en.wikipedia.org/wiki/2019_J
widespread use of English and the popularity of the ohannesburg_riots
398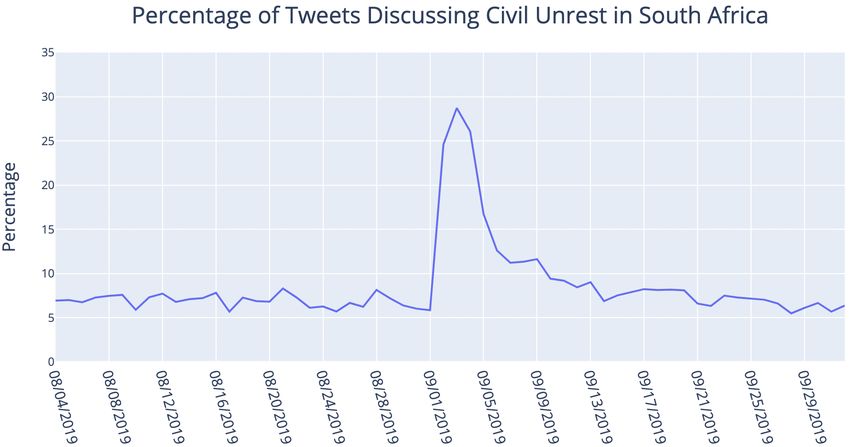
(a) South Africa Johannesburg Riots, September 1-5th 2019.     (b) Ethiopia Burayu Massacre, September 14-16 2018.

Figure 3: Ratio of civil unrest-related tweets in South Africa and Ethiopia around the time of large-scale protests.
In both countries, the civil unrest-related tweets spike around 30%, but that spike corresponds to thousands of
tweets in South Africa and only 150 in Ethiopia.

central hashtags. The hashtags remained popular af-           the three day period there were clashes between
ter the event, indicating people were still discussing        ethnic groups and targeted looting of business. The
the event and/or dealing with the aftermath.                  activities led to 23 deaths and many injured and
   The hashtag analysis lends insight as to what is           displaced people.7 On September 17, thousands of
being discussed, and we are also interested in who            people marched in the capital in protest of the poor
is leading the conversation. We find these “influen-          government handling of the looting and violence.
tial" users based on verification status and the num-            From Figure 3b, we see a clear spike in civil
ber of likes their tweets received over the one week          unrest tweets on the last day of the looting and
period. We found that verification status did not             on the day of the protest in the capital. However,
necessarily mean they were popular users, hence               the perceived volatility of civil unrest discussion in
the inclusion of number of likes to measure engage-           Ethiopia is due to the low data. Even at the peak
ment. After manual analysis of the screen names               where over 30% of tweets are civil unrest-related,
and descriptions (not included here for privacy con-          that corresponds to only 150 tweets. The low data
cerns), we found that these users were entertainers,          is also obvious when analyzing hashtags, where
reporters, and activists. The entertainment accounts          even the most popular only appeared 12 times (Fig-
did post content about the protests, often in support.        ure 4b). Out of the top hashtags, none directly use
News organizations were not among the top 10 ac-              keywords about the situation (i.e., no “massacre",
counts, which confirms the discussion is led by the           “death", “violence", or “Burayu"), and event re-
people and not organizations. This is important to            lated hashtags were only determined after manual
know for systems that use social media to “beat the           analysis of tweets. The hashtags containing rele-
news" (Ramakrishnan et al., 2014).                            vant information were #etv, #addisababa,
                                                              #addis, which reference the Ethiopian public
3.2    Ethiopia: Burayu Massacre Protests                     broadcast station and the capital where protests
Compared to South Africa, Ethiopia has consid-                occurred. The other top hashtags were irrelevant
erably less English Twitter (see Appendix Table               to the event, but still civil unrest-adjacent in nature
4), despite having almost double the population5 .            (e.g., #southsudan and #eritrea were dis-
Despite the low prevalence of English in the coun-            cussing a peace treaty between South Sudan and
try,6 it is the language of choice for the majority of        rebel groups hosted in Ethiopia).8 The discussions
tweets (see Appendix Table 8). A large-scale civil            surrounding #etv were interesting since they con-
unrest event from Ethiopia is the Burayu massacre,            cerned the coverage of the protesters and treatment
which took place on 14-16 September 2018 in Bu-               from the police. An example tweet found through
rayu, a town near the capital, Addis Ababa. During
                                                                 7
                                                                   https://en.wikipedia.org/wiki/Burayu
   5
    https://www.worldometers.info/world-                      _massacre
population/population-by-country/                                8
                                                                   https://www.reuters.com/article/us-s
  6
    https://www.cia.gov/the-world-factbo                      outhsudan-unrest/south-sudans-president-
ok/countries/ethiopia/#people-and-societ                      rebel-leader-sign-peace-deal-idUSKCN1LS2
y                                                             PW
                                                          399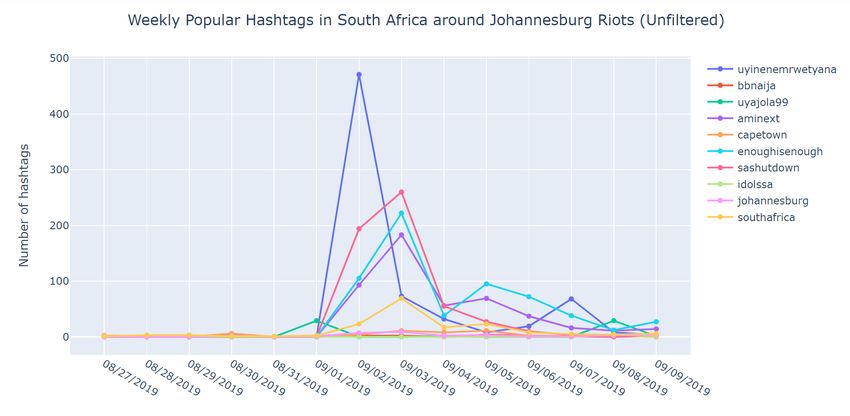
(a) South Africa                                         (b) Ethiopia

Figure 4: Popular hashtags in South Africa and Ethiopia from the one week period of the Johannesburg riots and
Burayu Massacre, respectively. Hashtag frequency is calculated from filtered tweets only.

                                                          resent the tweets and the ACLED event. Tweets
                                                          and event descriptions were pre-processed with the
                                                          GloVeTweetTokenizer from littlebird
                                                          (DeLucia, 2020). Although the embeddings are not
                                                          meant for the formal writing style in the descrip-
                                                          tions, we decided to prioritize the tweet representa-
                                                          tion.
                                                             As seen in Table 1, the tweets with the highest
Figure 5: Example tweet from the events following the     cosine similarity to the event description explicitly
Burayu massacre in Ethiopia. Tweet was queried based      discussed the protests, indicating success. This is a
on its event-related hashtags. Paraphrased for privacy.   useful approach for those who want an automated
                                                          method to filter a general collection of tweets. As
hashtag analysis is in Figure 5.                          seen from the case studies, even reducing tweets
  The influential users around the time of the            to those that are just civil unrest related was not
protest were mostly activists. Only a few di-             enough to only have event-specific tweets. And
rectly referenced the massacre, and those tweets          gathering tweets through post-hoc analysis as in
mostly condemned the violence, especially against         (Littman, 2018; Alsaedi et al., 2017) requires ex-
women.                                                    tensive knowledge of keywords and hashtags, not
                                                          just the time and location of the event. This auto-
3.3   Filtering Tweets using Event Descriptions           mated method can help discover more search terms
In our case studies we observed an increase in civil      and event-specific hashtags. An important note is
unrest tweets during the event time period. How-          while the most similar tweets were relevant, they
ever, the civil unrest filtration method was general      only had a cosine similarity of 0.3 with the event
and could not limit the tweets to those discussing        description. An automated approach would have to
the specific event of interest. Other work uses post-     tune this similarity threshold.
event knowledge such as keywords or hashtags                 A scaled-up version of this experiment cover-
(Littman, 2018; Alsaedi et al., 2017), but we lever-      ing the entire month of September is in Appendix
age the ACLED event descriptions to query related         C. The matching results were subpar, indicating
tweets. We test this method on tweets from the            events could not be accurately paired with their
Johannesburg Riots.                                       corresponding days. We believe this is due to the
   For the query process we created embedding rep-        sheer amount of data hiding an event signal, since
resentations of each tweet from September 3, 2019         South Africa has many tweets.
in South Africa (the peak of the protests) and of
                                                        4 General Indicators of Civil Unrest
the aggregated event descriptions from the same
day in ACLED, and then used cosine similarity           In §3 we determined that for two specific events
between event and tweet representations to find         in different countries (South Africa and Ethiopia),
the relevant tweets. We used the average Twitter        there is signal in the country’s Twitter activity that
GloVe embedding (Pennington et al., 2014) to rep- a civil unrest event occurred. Those case studies
                                                     400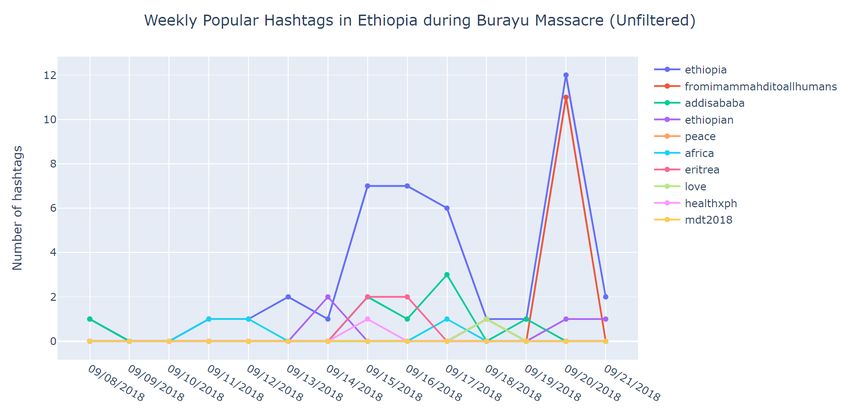
ACLED Event Descriptions
             Foreign nationals demonstrated and barricaded roads in Rosettenville (City of Johannesburg, Gauteng).
             Some sources reported demonstrators held weapons, in case they were attacked. The demonstration was
             in response to nationals attacking foreign nationals.

             Students, mainly female, demonstrated at the University of Cape Town, disrupting classes. The demon-
             stration was in response to the rape and murder of student, calling for more safety for students.
             Most Similar Tweets
             Is the @SAPS investigation of the alleged murder of the Pretoria taxi driver by undocumented immigrants
             over yet?

             Glad something is happening but maybe they should have waited longer for investigations... but where are
             the police?!

Table 1: Example ACLED event description and corresponding tweets, according to highest cosine similarity for
South Africa on September 3, 2019. Only some of the 8 event descriptions for this day are shown. The tweets all
have cosine similarity around 0.3 to the event representation. Tweets are paraphrased for privacy.

were very manual, which is not practical for large-               ity, we split the Twitter data by year, where 2014–
scale analyses across events, time, and countries.                2016/2017/2018–2019 are the train/validation/test
Also, the identified relevant tweets and hashtags                 sets.
from the two events were very different (e.g., #etv                  We use a random forest model because it is both
vs #shutdownsouthafrica). Are there gen-                          simple enough to be interpretable and powerful
eral trends/indicators of civil unrest across many                enough to capture relevant features from the data.
countries and events? We answer this question by                  For comparison, we utilize a random baseline that
training an interpretable9 n-gram model and ana-                  predicts the positive class with the probably of
lyzing its per-country performance and feature im-                the positive class in the train set. Since 29% of
portance with SHAP, a popular explainability tool                 the country/date samples were positive from 2014–
SHapley Additive exPlanation (SHAP) (Lundberg                     2016, the random classifier predicts the positive
and Lee, 2017).                                                   class 29% of the time. The models were evalu-
                                                                  ated with precision-recall metrics. To encourage
4.1 Experimental Setup                                            model generalizability across countries we remove
We formulate the civil unrest event detection task as             location-specific tokens from the data, focusing on
a binary classification problem to predict whether                country names and locations mentioned in ACLED.
an event occurred in a particular country on a par- Details are in Appendix §D. In addition to combat-
ticular day. The ground truth is the ACLED labels                 ing country bias by removing location words, we
from §2, where a day is “positive" if at least one                also sampled the dataset to ensure equal represen-
event occurred. For easily understandable features, tation of countries.
we use n-gram (token) counts from Scikit-learn                       The n-gram model achieved an F1 score for the
(Pedregosa et al., 2011). All tweets are grouped                  positive class of 0.45, with precision close to 0.60.
by their country and day of origin and assigned                   This score greatly outperforms the random base-
a positive or negative label depending on if that                 line, which only achieves an F1 of 0.29 (see Table
country and day is present in ACLED.10 Only fil- 3). The non-debiased n-gram model performed
tered tweets are included (see §2), and days with- slightly better than the n-gram model (0.50, an
out corresponding tweets are removed. To make                     improvement of 0.05 F1), however this increase
computation tractable, we only consider the top                   in performance came at the cost of less informa-
10,000 tokens from the training set. The tweets                   tive features. We attribute this low F1 score to
were tokenized with littlebird. Each day in a                     noisy data and labels. While the tweets are fil-
country is represented as the raw count of the ag- tered to those civil unrest-related, as discussed in
gregated tweet tokens. For temporal generalizabil- §3, that does not mean the tweets are all related
                                                                  to the ACLED event(s) reported on the day. In ad-
    9
      “Interpretable” referring to the simplicity of the model    dition, while ACLED is a human-curated dataset,
and easily understandable features, i.e., token counts
   10
      “Country of origin" is present in all tweets since only     the event granularity varies from small-scale events
geotagged tweets are in the dataset.                              in a single town to large-scale events in populous
                                                               401
cities. Both cases provide a positive label for the
day in a country, despite the probable difference
in signal. Once the model was trained, we used
SHAP values to find the most important features,
or tokens, according to the model.
The SHAP value of a feature estimates the
marginal contribution of that feature to the model
output across different combinations of other fea-
tures, essentially a feature “importance" (Lundberg Figure 6: Tweet representative of civil unrest in Myan-
et al., 2020). A negative SHAP value means the mar. Queried using aggregate SHAP feature impor-
feature pushes the prediction towards the negative tance as token weight. Paraphrased for privacy.
class, and a positive value pushes it towards the
positive class. Although SHAP operates on a sin- prised only 2.4% of the test set.
gle instance, the aggregation of SHAP values can To find tweets representative of civil unrest in
provide insights on the overall impact of a feature. Myanmar, we use the average SHAP feature values
The magnitude of a feature’s impact is the sum of as weights for each token and query the tweets
its SHAP values across many examples, regard- with this weight system. The result provided very
less of its positive/negative impact (absolute value). relevant tweets, as seen in Figure 6.
We chose SHAP because it worked better with the We also evaluate whether the country “debias-
sparse count-based features than LIME (Ribeiro ing" improved the generalization of the model.
et al., 2016). From Table 3 we see the non-debiased model
(with location stopwords) outperforms the debi-
4.2 Features Indicative of Civil Unrest
ased model across train, validation, and test sets.
The magnitude of a feature’s SHAP values across However, when looking at the distribution of scores
many examples provides insight into features the for each country, we see the debiasing did improve
model deems important to decision making. In this the model’s performance on previously low scor-
case, a feature is the raw number of times a token ing countries (Appendix Figure 10). Essentially
appeared in all the tweets for a country for a day. debiasing spreads the model’s performance more
To evaluate country generalizability we check the equally across countries, instead of only perform-
top features for a specific country, Myanmar, and ing very well on a minority. In a specific example
all 42 countries in the dataset (including Myanmar). from Ethiopia, the effects from debiasing are clear
The SHAP values are from all Myanmar samples (Figure 7). Although we learned from the case
in the test set and 500 samples from all countries. study in §3 that Ethiopians rallied around location-
All samples are pulled from the test set, years 2018– specific hashtags for the Burayu massacre, the fea-
2019. The top features are in Table 2. tures learned by the model could not transfer to
In general, the majority of the words deemed other countries (i.e., “addis", “ethiopia"). The fea-
informative by the model for all 42 countries are re- tures after debiasing are much more general, in-
lated to human rights and civil unrest (e.g., “govern- cluding “media", “inhuman", and “injured".
ment", “casualties"). The majority of top features We aimed to find features that generalize across
are not country-specific (other than “rohingya"), countries, and from the international analysis on all
indicating that the country debiasing was a suc- countries, we did find features beyond the obvious
cess. There is high overlap between the top tokens keywords “protest" and “war." It was also promis-
for all countries and those for Myanmar. How- ing that the international features overlapped with
ever, in Myanmar we see features indicative of the the important Myanmar features.
Rohingya crisis (i.e., “rohingya", “burma", “ter-
rorist", “military").11 Unlike the international fea- 5 Ethical Considerations
tures, these are very specific and clearly describe
Twitter is a commonly used social media source
the events in the country for 2018-19. This high
for studying and forecasting civil unrest. The main
overlap is interesting considering Myanmar com-
ethical concerns over this use of Twitter data is user
11
https://www.unicef.org/emergencies/r privacy and bias in event information. For user
ohingya-crisis privacy, we paraphrased tweet content to reduce
402All Countries Myanmar
human, country, world, years, media, hope, situ- burma, rohingya, world, media, country, human,
ation, government, read, rohingya, feel, rights, ca- military, years, terrorist, hope, feel, government,
sualties, true, police, watch, time, day, call, national group, war, day, time, today, plz, rights, official
Table 2: Top 20 features according to SHAP values from (1) 500 samples from all countries and (2) all Myanmar
samples. Samples drawn from the test set (2018-19). The majority of the important tokens directly relate to human
crisis and civil unrest, and the top Myanmar features describe the Rohingya crisis. Importance determined by the
magnitude of SHAP values. The all countries sample is class-balanced.
(a) Before debiasing
(b) After debiasing
Figure 7: Individual SHAP output on days of the Burayu Massacre protests in Ethiopia before and after country
debiasing (i.e., removing location-specific words). While the overall model performance dropped 0.05 F1, the
most important features became more generalizable and informative.
F1 Precision Recall Misleading information can also come from
N-gram 0.45 0.58 0.37 users outside of the country. Inaccurate geotags
N-gram
0.50 0.61 0.42
can come from the use of a VPN, which masks
(biased) a user’s true location. VPNs are commonly used
Random 0.29 0.32 0.27 to circumvent government-authorized social media
shutdowns, especially in countries present in our
Table 3: F1 scores for the civil unrest detection analysis.12 A user could potentially tweet about
task. Ground truth labels are from ACLED Riots and
the situation in their country, but it would be aggre-
Protests. Only test scores are shown (2018-2019). See
Appendix Table 5 for train and validation scores. gated with the tweets for a different country based
on the geotag information.
reverse identification of users (Ayers et al., 2018). 6 Conclusion
The bias in event information can stem from the
language of study, user misinformation, and out- There are ample real-time systems and research
side information from inaccurate geotags (tweet using Twitter to forecast civil unrest, but not many
location). Language can proxy status in certain studies step back and evaluate the manifestation of
countries, providing different viewpoints depend- civil unrest on Twitter, especially across countries.
ing on the studied language. Also, tweet content is In this work we presented a mix of qualitative in-
not fact-checked and may contain misleading or in- depth case studies of events in two countries, and a
complete information. This misinformation is not quantitative large-scale automatic detection of civil
necessarily malicious, but could warp observers’ unrest events across 42 countries. This evaluation
perceptions of events. This is very important to of civil unrest on Twitter is not comprehensive, but
note if Twitter is being used to identify event in- demonstrates some concerns of using Twitter for
formation and details, as opposed to a reputable civil unrest detection across countries.
news source. Claims made by Twitter users should From the case studies of the Johannesburg riots
be attempted to be verified before being treated as 12
https://www.top10vpn.com/cost-of-int
fact. ernet-shutdowns/
403in South Africa and the Burayu massacre protests studies. npj Digital Medicine, 1(1):1–2. Number: 1
in Ethiopia, we find there is presence of event- Publisher: Nature Publishing Group.
related discussion for both events. In South Africa
Lalindra De Silva and Ellen Riloff. 2014. User Type
there was clear development of event-specific hash- Classification of Tweets with Implications for Event
tags, but the hashtags in Ethiopia were very generic, Recognition. In Proceedings of the Joint Workshop
mostly using location words. Gradual rise in civil on Social Dynamics and Personal Attributes in So-
unrest-related discussion before the large event was cial Media, pages 98–108, Baltimore, Maryland. As-
sociation for Computational Linguistics.
not able to be identified in either country, indicat-
ing users see Twitter as a reactionary platform, i.e., Alexandra DeLucia. 2020. AADeLucia/littlebird.
share their opinions in real-time or after the event. Original-date: 2020-04-24T00:15:07Z.
This is an important finding for work that uses Twit-
ter data to forecast civil unrest events days or weeks Amosse Edouard. 2018. Event detection and analysis
on short text messages. Ph.D. thesis.
in advance.
While the case studies did not unearth immedi- Kamrul Islam, Manjur Ahmed, Kamal Z. Zamli, and
ately generalizable patterns indicative of civil un- Salman Mehbub. 2020. An online framework for
rest, our n-gram model trained on Twitter data from civil unrest prediction using tweet stream based on
tweet weight and event diffusion.
42 countries did find generalizable token-based pat-
terns. Despite the low F1 score (0.5 for the highest Rostyslav Korolov, Di Lu, Jingjing Wang, Guangyu
performing non-country debiased model), the top Zhou, Claire Bonial, Clare Voss, Lance Kaplan,
tokens were related to civil unrest and human rights William Wallace, Jiawei Han, and Heng Ji. 2016.
crises. On predicting social unrest using social media. In
2016 IEEE/ACM International Conference on Ad-
For future work we would expand the case stud- vances in Social Networks Analysis and Mining
ies to other languages, possibly even comparing (ASONAM), pages 89–95, San Francisco, CA, USA.
event manifestation between languages. Also, we IEEE.
would explore explainability techniques for more
Kalev Leetaru and Philip A Schrodt. GDELT: Global
powerful embedding-based models. We also only
Data on Events, Location and Tone,. page 51.
focused on large-scale events and did not evaluate
the model’s ability to detect small-scale events. Justin Littman. 2018. Charlottesville Tweet Ids. Pub-
lisher: Harvard Dataverse type: dataset.
Acknowledgments
Marco Lui and Timothy Baldwin. 2012. langid.py: An
The authors thank Arya McCarthy, Keziah Naggita, Off-the-shelf Language Identification Tool. In Pro-
Sougol Gheissi, Rachel Wicks, Elizabeth Salesky, ceedings of the ACL 2012 System Demonstrations,
and the anonymous reviewers for their feedback. pages 25–30, Jeju Island, Korea. Association for
Computational Linguistics.
This work relates to Department of Navy award
N00014-19-1-2316 issued by the Office of Naval Scott M. Lundberg, Gabriel Erion, Hugh Chen, Alex
Research. The United States Government has a DeGrave, Jordan M. Prutkin, Bala Nair, Ronit Katz,
royalty-free license throughout the world in all Jonathan Himmelfarb, Nisha Bansal, and Su-In Lee.
2020. From local explanations to global understand-
copyrightable material contained herein. Any opin-
ing with explainable AI for trees. Nature Machine
ions, findings, and conclusions or recommenda- Intelligence, 2(1):56–67. Number: 1 Publisher: Na-
tions expressed in this material are those of the ture Publishing Group.
author(s) and do not necessarily reflect the views
of the Office of Naval Research. Scott M. Lundberg and Su-In Lee. 2017. A Unified Ap-
proach to Interpreting Model Predictions. Advances
in Neural Information Processing Systems, 30.
References Sathappan Muthiah, Bert Huang, Jaime Arredondo,
Nasser Alsaedi, Pete Burnap, and Omer Rana. 2017. David Mares, Lise Getoor, Graham Katz, and Naren
Can We Predict a Riot? Disruptive Event Detection Ramakrishnan. 2015. Planned Protest Modeling in
Using Twitter. ACM Transactions on Internet Tech- News and Social Media. In Twenty-Seventh IAAI
nology, 17(2):1–26. Conference.
John W. Ayers, Theodore L. Caputi, Camille Nebeker, M. Osborne and Mark Dredze. 2014. Facebook, Twit-
and Mark Dredze. 2018. Don’t quote me: reverse ter and Google Plus for Breaking News: Is There a
identification of research participants in social media Winner? In ICWSM.
404Fabian Pedregosa, Gael Varoquaux, Alexandre Gram-
fort, Vincent Michel, Bertrand Thirion, Olivier
Grisel, Mathieu Blondel, Peter Prettenhofer, Ron
Weiss, Vincent Dubourg, Jake Vanderplas, Alexan-
dre Passos, and David Cournapeau. 2011. Scikit-
learn: Machine Learning in Python. Journal of Ma-
chine Learning Research, 12:2825–2830.
Jeffrey Pennington, Richard Socher, and Christopher
Manning. 2014. Glove: Global Vectors for Word
Representation. In Proceedings of the 2014 Con-
ference on Empirical Methods in Natural Language
Processing (EMNLP), pages 1532–1543, Doha,
Qatar. Association for Computational Linguistics.
Clionadh Raleigh, Andrew Linke, Håvard Hegre, and
Joakim Karlsen. 2010. Introducing ACLED: An
Armed Conflict Location and Event Dataset: Special
Data Feature. Journal of Peace Research. Publisher:
SAGE PublicationsSage UK: London, England.
Naren Ramakrishnan, Gizem Korkmaz, Chris
Kuhlman, Achla Marathe, Liang Zhao, Ting Hua,
Feng Chen, Chang Tien Lu, Bert Huang, Aravind
Srinivasan, Khoa Trinh, Patrick Butler, Lise Getoor,
Graham Katz, Andy Doyle, Chris Ackermann,
Ilya Zavorin, Jim Ford, Kristen Summers, Youssef
Fayed, Jaime Arredondo, Dipak Gupta, Sathappan
Muthiah, David Mares, Nathan Self, Rupinder
Khandpur, Parang Saraf, Wei Wang, Jose Cadena,
and Anil Vullikanti. 2014. ’Beating the news’
with EMBERS: forecasting civil unrest using open
source indicators. In Proceedings of the 20th ACM
SIGKDD international conference on Knowledge
discovery and data mining - KDD ’14, pages
1799–1808, New York, New York, USA. ACM
Press.
Suhas Ranganath, Fred Morstatter, Xia Hu, Jiliang
Tang, and Huan Liu. 2016. Predicting Online
Protest Participation of Social Media Users. AAAI
Press, page 7.
Marco Tulio Ribeiro, Sameer Singh, and Carlos
Guestrin. 2016. "Why Should I Trust You?": Ex-
plaining the Predictions of Any Classifier. In Pro-
ceedings of the 22nd ACM SIGKDD International
Conference on Knowledge Discovery and Data Min-
ing, pages 1135–1144, San Francisco California
USA. ACM.
Justin Sech, Alexandra DeLucia, Anna L. Buczak,
and Mark Dredze. 2020. Civil Unrest on Twitter
(CUT): A Dataset of Tweets to Support Research
on Civil Unrest. In Proceedings of the Sixth Work-
shop on Noisy User-generated Text (W-NUT 2020),
pages 215–221, Online. Association for Computa-
tional Linguistics.
405unfiltered top hashtags, but the very informative
#etv is not on the list.
C Comparing Aggregated Twitter
Content and Event Descriptions
The tweet representations and the event descrip-
tions were matched based on cosine similarity and
the matching was evaluated with mean reciprocal
rank (MRR). MRR is a score between (0, 1], where
1 means the correct answer is ranked first (i.e., most
similar), but the score approaches 0 the lower the
rank of the correct answer.
We tried two different representations: (1) n-
gram-based and (2) embedding-based (Twitter
Figure 8: The language breakdown (in percentages) of GloVe (Pennington et al., 2014)). The filtered
Twitter data from all 42 countries. All languages that tweets over the period of a month in South Africa
covered less than 10% of the country’s tweets grouped were aggregated by day (September 2019), repre-
as “other". Languages were identified with langid
sented as a vector of either (1) raw token counts
(Lui and Baldwin, 2012).
or (2) average GloVe embeddings, and then com-
pared to the ACLED event descriptions from the
A Twitter Dataset Details same time period. Tweets were preprocessed with
littlebird (DeLucia, 2020). Only days with
The exact number of tweets per country in the Twit-
events were included and if more than one event
ter dataset are in Table 4. The country is identified
happened on a single day then the descriptions were
by its ISO 3166 alpha-3 code. The civil unrest fil-
aggregated into one. Unfortunately neither repre-
tration removes many tweets, but ensures the case
sentation provided good results, as both had MRR
study qualitative analysis only looks at relevant
scores around 0.15. The GloVe representation and
data. We also include a language breakdown of all
N-gram representation has scores of 0.14 and 0.15,
tweets from the initial collection in Figure 8. The
respectively. This indicates events could not be ac-
choice of English covers many countries, but ex-
curately paired with their corresponding days. We
pansion into Arabic and French would be beneficial
believe this is due to the sheer amount of data being
to future work.
aggregated, since South Africa has many tweets. In
B Case Study Unfiltered Analysis the case of the embedding representation, each day
is the average tweet representation, which in turn
§3 analyzed the Twitter content around the selected is the average of its token representations.
events in South Africa and Ethiopia using the re-
stricted set of filtered tweets. As discussed in §2, D Country Debiasing
the “filtered" tweets are those identified by the
(Sech et al., 2020) BERTweet filtration model as be- As discovered from the initial civil unrest predic-
ing related to civil unrest (i.e., score above 0.5). As tion results, the model learned country and location
seen in Figure 9, the filtration step was necessary tokens as proxies for civil unrest. While the model
to reduce dataset size for the manual qualitative performs reasonably well on the prediction task,
analysis presented in this work. the important features indicate it cannot generalize
In South Africa, the hashtags from unfiltered to new data from other countries.
tweets contain more general content such as We debias the model by re-training it on a
references to popular TV shows (#bbnaija, “scrubbed” version of the tweets with removed lo-
#uyajola99, #idolsa) and tourism cation words. We create two location stopword
(#southafrica, #capetown). However, lists. One stopword list is manually curated from
the protest-centered hashtags were so popular that the country, state/province, and city names in the
they remain popular even in the unfiltered list. In ACLED data. Following the Ethiopia example
Ethiopia, there is overlap between the filtered and from Figure 7, this list includes “ethiopia" and “ad-
406AGO 289,373 / 16,639 BDI 25,041 / 6,097 BEN 150,348 / 16,489
BFA 50,197 / 4,327 BGD 2,318,969 / 330,947 CAF 28,723 / 2,860
CIV 564,197 / 34,286 CMR 833,795 / 71,420 COD 251,430 / 27,920
DZA 1,561,362 / 150,084 EGY 8,845,187 / 608,977 ETH 261,202 / 59,111
GHA 11,772,277 / 1,711,557 GIN 68,168 / 4,652 KEN 11,837,021 / 2,451,866
KHM 658,744 / 86,021 LBR 114,329 / 20,267 LBY 674,195 / 55,177
LKA 2,312,676 / 320,593 MAR 2,155,938 / 243,772 MDG 118,673 / 10,622
MLI 77,523 / 6,782 MMR 552,406 / 81,130 MOZ 349,321 / 31,634
MWI 780,767 / 101,891 NAM 1,881,238 / 238,720 NER 58,960 / 5,220
NGA 48,954,857 / 9,660,532 NPL 1,789,592 / 239,200 PAK 15,927,538 / 2,966,772
SDN 743,925 / 55,151 SEN 684,381 / 40,840 SLE 131,235 / 19,460
SOM 215,610 / 60,061 TCD 26,951 / 2,577 TGO 58,253 / 8,254
THA 14,661,060 / 980,846 TUN 944,833 / 87,903 TZA 2,216,871 / 248,856
UGA 3,274,687 / 638,372 ZAF 72,155,722 / 9,323,649 ZMB 1,706,438 / 246,815
Table 4: English tweets per country. The counts are aggregated over the 6 year period 2014-2019. The overall
English tweet count and the filtered English tweet counts are shown (separated by “/"). Countries are identified by
their ISO 3166 alpha-3 code.
(a) South Africa (b) Ethiopia
Figure 9: Popular hashtags in South Africa and Ethiopia from the one week period of the Johannesburg riots and
Burayu Massacre, respectively. Hashtag frequency is calculated from all English tweets, not only filtered tweets.
dis ababa"13 , but not adjectives such as “ethiopian". son, we evaluated the country prediction perfor-
The second stopword list is automatically created mance after removing the ACLED location words.
by using the same civil unrest prediction setup, but That model achieved scores of 0.09/0.13/0.07
we changed the prediction task to tweet country ori- F1/precision/recall. At first glance it appears that
gin. The stopword list is comprised of the features only the ACLED location stoplist is sufficient, but
that SHAP identifies as having > 0.005 contribu- the model was able to identify a handful of coun-
tion towards the prediction. Example top features tries with very high accuracy. The top features
from the most identifiable countries are in Table for this model are in Table 6. However, due to
7. We compared the two feature sets of 10,000 to- poorer model performance with the SHAP stoplist,
kens produced by the two debiasing methods. The we used the ACLED location stoplist for the pre-
union of the two feature sets have a size of 10,630 diction experiments in §4. We believe the SHAP
while the size of intersection is 9,374, thus giving stoplist removed too many informative words.
a Jaccard similarity of 0.882.
The country prediction model (same setup as the
civil unrest prediction model with n-grams and ran-
dom forest) achieved an F1, precision, and recall
of 0.8, 0.69 and 0.97, respectively. For compari-
13
The alternative spacings of the tokens are also included,
such as “addisababa".
407Kenya Nigeria Pakistan
kenyan hit hit
hit job basic
basic basic job
job beaten dear
Figure 10: Distribution of F1 scores across 42 countries
force dear qatar
for the n-gram civil unrest detection task. The original
“biased" and “debiased" models are compared. dear qatar peak
broken broken broken
carry beef force
ktn condolence love
beaten salaries blood
South Africa Ghana Uganda
hit basic force
basic force time
job hit dear
branches broken hit
kzn time broken
beaten mining shame
F1 Precision Recall condolence shame basic
0.73 0.85 0.64 love twitter water
N-gram 0.46 0.56 0.39 broken dear twitter
0.45 0.58 0.37 piss barking barking
0.84 0.87 0.81
N-gram (with loca- Table 6: Top 10 features with the largest magnitude of
0.53 0.57 0.51
tion stopwords) SHAP value for countries that are easy to predict even
0.50 0.61 0.42 after removing ACLED location stopwords.
0.27 0.27 0.27
Random 0.27 0.28 0.27
0.29 0.32 0.27
Table 5: Precision-recall metrics from the n-gram
model trained to predict civil unrest in a country for
a day. Ground truth are riot and protest labels from
ACLED. Scores shown for each model are train, vali-
dation, and test, respectively (top to bottom).
408Kenya Nigeria Pakistan
ruto abeg pti
news pls kpk
reason stop pakistanis
hii guys army
guys security pakistan’s
court jonathan asif
security court stop
years years court
long army years
stop wike security
South Africa Ghana Uganda
soweto ghanaians reason
zuma citicbs news
saps mahama ugandans
guys news croozefmnews
anymore reason mps
there’s smh court
court what’s dead
years court life
reason ndc govt
hayi govt shd
No debias Debiased
Kenya 0.97/1.00/0.95 0.97/0.99/0.95
Nigeria 0.97/1.00/0.94 0.97/1.00/0.94
Pakistan 0.97/1.00/0.95 0.97/0.99/0.95
South Africa 0.97/1.00/0.93 0.97/1.00/0.93
Ghana 0.99/1.00/0.98 0.96/0.96/0.97
Uganda 0.98/0.99/0.96 0.88/0.84/0.93
Table 7: Top 10 features with the largest magnitude of
SHAP value for countries that are easy to predict (top),
as well as the country prediction scores before and after
debiasing (bottom).
409You can also read