Study of share price variations of publicly traded football clubs
←
→
Page content transcription
If your browser does not render page correctly, please read the page content below
Facultat d’Economia i Empresa

                           Memòria del Treball de Fi de Grau

       Study of share price variations of publicly
                 traded football clubs

                                         Vincent Hof

                                     Grau d’Economia
                                     Any acadèmic 2019-20

DNI de l’alumne: X7998396P

Treball tutelat per Amedeo Spadaro
Departament de Economia i empresa

                                                                                Autor     Tutor
     S'autoritza la Universitat a incloure aquest treball en el Repositori
     Institucional per a la seva consulta en accés obert i difusió en línia,   Sí   No   Sí   No
     amb finalitats exclusivament acadèmiques i d'investigació

Paraules clau del treball:
Price share, evolution, football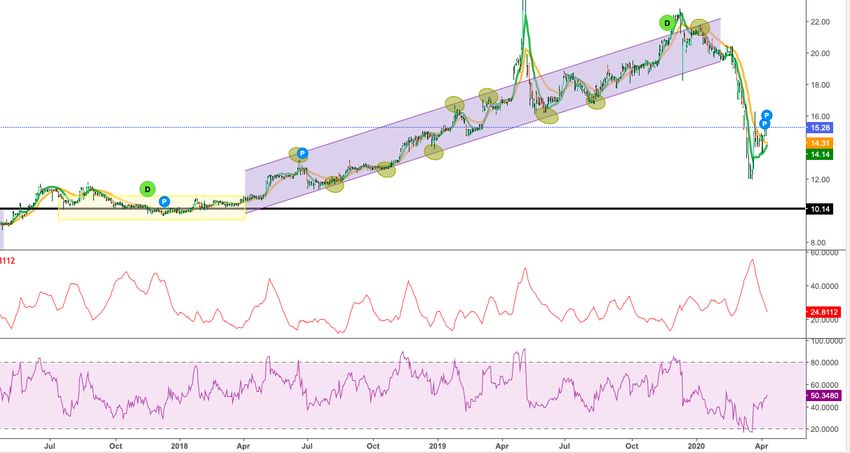
CONTENT INDEX
INDEX OF TABLES                                                        3
INDEX OF CHARTS                                                        3
SUMMARY OF THE WORK SUBMITTED                                          4
RESUMEN DEL TRABAJO PRESENTADO                                         4
INTRODUCTION OF THE WORK SUBMITTED                                     5
1.     ENGLAND: PREMIER LEAGUE                                         6
     1.1. INTRODUCTION.                                                 6
     1.2. THE BEGINNINGS OF MANCHESTER UNITED IN THE STOCK MARKET.      7
     1.3. HOW MANCHESTER UNITED´S STOCK HAS EVOLVED.                    7
       1.3.1. Fundamental analysis.                                     7
       1.3.2. Technical analysis.                                      13
     1.4. EVENTS RELATED TO MAJOR MOVEMENTS WITHIN THE STOCK MARKET.   16
     1.5. HIERARCHY OF INFLUENCES ON MANCHESTER UNITED´S STOCK.        16
     1.6. CONCLUSIONS.                                                 17
2.     ITALY: SERIE A                                                  18
     2.1. INTRODUCTION.                                                18
     2.2. THE BEGINNINGS OF JUVENTUS IN THE STOCK MARKET.              19
     2.3. HOW JUVENTUS STOCK HAS EVOLVED.                              19
       2.3.1. Fundamental analysis                                     19
       2.3.2. Technical analysis                                       25
     2.4. EVENTS RELATED TO MAJOR MOVEMENTS WITHIN THE STOCK MARKET.   27
     2.5. HIERARCHY OF INFLUENCES ON JUVENTUS STOCK.                   28
     2.6. CONCLUSIONS                                                  28
3.     HOLLAND: EREDIVISIE                                             30
     3.1.   INTRODUCTION                                               30

     3.2. THE BEGINNINGS OF AJAX IN THE STOCK MARKET.                  31
     3.3. HOW AJAX STOCK HAS EVOLVED                                   31
       3.3.1. Fundamental analysis                                     32
       3.3.2. Technical analysis                                       38
     3.4. EVENTS RELATED TO MAJOR MOVEMENTS WITHIN THE STOCK MARKET.   40
     3.5. HIERARCHY OF INFLUENCES ON AFC AJAX STOCK.                   41
     3.6. CONCLUSION                                                   42
4.     BUNDESLIGA: BVB DORTMUND                                        43
     4.1. INTRODUCTION                                                 43
     4.2. THE BEGINNINGS OF BVB DORTMUND IN THE STOCK MARKET.          44
     4.3. HOW BVB DORTMUND´S STOCK HAS EVOLVED                         44
       4.3.1. Fundamental analysis                                     44
       4.3.2. Technical analysis                                       52
     4.4. EVENTS RELATED TO MAJOR MOVEMENTS WITHIN THE STOCK MARKET.   55
     4.5. HIERARCHY OF INFLUENCES ON BVB DORTMUND STOCK.               55
     4.6. CONCLUSIONS                                                  56
CONCLUSIONS OF THE WORK SUBMITTED                                      58
BIBLIOGRAPHY                                                           59

                                       2
Index of tables

TABLE 1. MANU RESULTS 15-16                     11
TABLE 2. MANU RESULTS 18-19                     12
TABLE 3. CLASIFICATION JUVENTUS 11-12           23
TABLE 4. TITLES AFC AJAX                        30
TABLE 5. UEFA AJAX 1999-2000                    34
TABLE 6. CLASIFICATION UEFA AJAX 03-04          35
TABLE 7. TRANSFER MARKET AJAX 2004              36
TABLE 8. RESULTS BVB DORTMUND 00-01             47
TABLE 9. RESULTS BVB 10-11                      48
TABLE 10. TRANSFER MARKET BVB 2017              50
TABLE 11. RESULTS BVB 18-19                     50
TABLE 12. RESULTS UEFA BVB 18-19                51

                            Index of charts

CHART 1. MANCHESTER UNITED HISTORICAL CHART      8
CHART 2. 1ST IMPORTANT MOVEMENT MANU             9
CHART 3. 2ND IMPORTANT MOVEMENT MANU            10
CHART 4. 3RD IMPORTANT MOVEMENT MANU            11
CHART 5. TECHNICAL ANALYSIS MANU                13
CHART 6. TECHNICAL ANALYSIS MANU                14
CHART 7. TECHNICAL ANALYSIS MANU                15
CHART 8. JUVENTUS HISTORICAL CHART              20
CHART 9. JUVENTUS HISTORICAL CHART              20
CHART 10. 1ST IMPORTANT MOVEMENT JUVE           21
CHART 11. 2ND IMPORTANT MOVEMENT JUVE           23
CHART 12. 3RD AND 4TH IMPORTANT MOVEMENT JUVE   24
CHART 13. TECHNICAL ANALYSIS JUVE               26
CHART 14. TECHNICAL ANALYSIS JUVE               27
CHART 15. AFC AJAX HISTORICAL CHART             32
CHART 16. 1ST IMPORTANT MOVEMENT AJAX           33
CHART 17. 2ND IMPORTANT MOVEMENT AJAX           35
CHART 18. 3RD AND 4TH IMPORTANT MOVEMENT AJAX   36
CHART 19. TECHNICAL ANALYSIS AJAX               39
CHART 20. TECHNICAL ANALYSIS AJAX               40
CHART 21. BVB DORTMUND HISTORICAL CHART         45
CHART 22. 1ST IMPORTANT MOVEMENT BVB            46
CHART 23. 2ND IMPORTANT MOVEMENT BVB            47
CHART 24. 3RD IMPORTANT MOVEMENT BVB            49
CHART 25. 4TH IMPORTANT MOVEMENT BVB            51
CHART 26. TECHNICAL ANALYSIS BVB                53
CHART 27. TECHNICAL ANALYSIS BVB                54

                                   3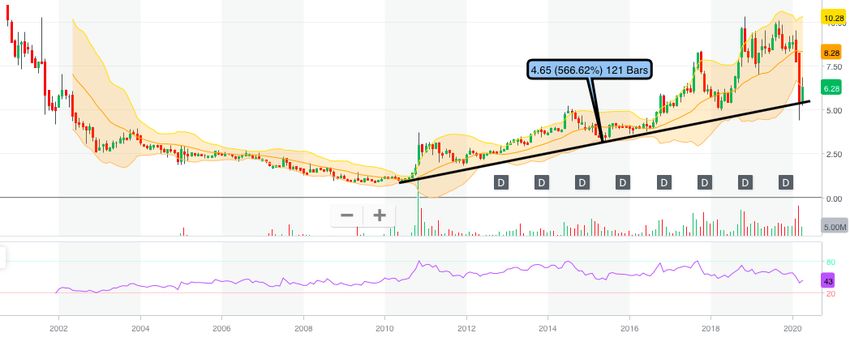
Summary of the work submitted

The Stock Exchange Market is very dynamic due to the different events that occur
constantly around the world. Such events may have a very close correlation with
the company listed on the Stock Exchange Market. In this work, there is going to
be made an analysis of football teams which are negotiated publicly.

This study involves analysing for football teams, from four different countries, and
trying to see those events that most volatility creates in the prices. For doing so,
first, a fundamental analysis is carried out which consists in linking these events
with the price variations they cause. These events are then compared within the
Stock Market. At last, a technical analysis is performed using different patterns
and indicators.

Finally, from each football team various conclusions have been drawn regarding
the hierarchy of events that affect the club's share prices more, and also, it has
been predicted what the next movements within the Securities Market could be
for these teams.

Resumen del trabajo presentado

El Mercado de Valores es muy dinámico debido a los diferentes acontecimientos
que ocurren constantemente en todo el mundo. Dichos acontecimientos pueden
tener una correlación muy estrecha con la compañía que cotiza en el Mercado
de Valores. Es por ello que, en este trabajo, se ha procedido a realizar un análisis
del mercado bursátil en relación a los equipos de fútbol que se negocian
públicamente.

El presente estudio consiste en analizar cuatro equipos de fútbol, de cuatro
países diferentes, y localizar aquellos eventos que más afectan a la volatilidad
de los clubes. Para ello, en primer lugar, se realiza un análisis fundamental que
consiste en relacionar dichos eventos con las variaciones de precios que
ocasionan. Posteriormente, se comparan dichos eventos con los movimientos
dentro del Mercado de Valores. Finalmente, se realiza un análisis técnico
utilizando diferentes patrones e indicadores.

Por último, de cada equipo se han obtenido diversas conclusiones en relación
con la jerarquía de eventos o acontecimientos que afectan más a los precios de
las acciones del club, y también, se ha predicho cuáles podrían ser los próximos
movimientos dentro del Mercado de Valores para estos equipos.

                                         4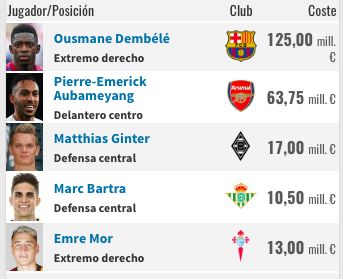
Introduction of the work submitted

The Stock Exchange Market constantly evolves in different directions and behind
every movement in price there is a reason why it´s moving that way. During my
academic career we almost haven´t studied anything about what is behind every
movement in the share prices of a company. This concern to know why stock
prices rise or decrease alongside my passion for football have led me to conduct
this research.

This research aims to know which external factors may affect a football team´s
share price and how does it affect to it. Personally, this research is going to help
me a lot in relation to what I want to work on in the future and also to fill my
previously mentioned concerns. This investigation can be very useful for
investors who are interested in investing in football teams that are traded publicly,
as in this work there will be a clear hierarchy of which events affects most the
share prices of a football club.

To achieve this detailed hierarchy of the events that most affect the share prices
of the football teams that are traded publicly, different analysis are going to be
used. First of all, a fundamental analysis; in which different events will be
compared with big movements that have happened at the same time and that
can have a correlation between them. From this analysis a conclusion will be
drawn explaining which events have created the biggest movements in the share
prices of the football club.

Secondly, a technical analysis will be made; different indicators will be used such
as Bollinger Bands, RSI and DEMA among others. Also, we will be looking at the
supports and resistances of each share and finally, with the combination of
indicators and geometrical figures a conclusion will be given about which
direction the share price might evolve.

The main objective of this research is to have a clearer idea of how the financial
market works, which are the factors that affect most a publicly traded football club
and finally, try to predict which might be the new trend the share prices are going
to follow after the big economical crash due to the Covid-19.

                                         5
1. England: Premier League
1.1. Introduction.
In this section Manchester United Football Club, one of the biggest and historical
football teams, will be analysed.
We will see when Manchester United decided to list on the stock exchange
market, which impact it had on their economy and also how it has been evolving
since then.
It is difficult to say why the shares of Manchester United have been going up or
down, and that is why we are going to focus rather on a fundamental analysis
and also a technical analysis instead of just looking how it has evolved in the
market over time. In the technical analysis some techniques and patterns will be
used, such as; trend lines, ABCD pattern, geometric figures, canals, resistances
and supports among others.
It will be necessary to relate events that have occurred over time with the ups and
downs of the price shares of Manchester United in the stock market. To achieve
this an analyse needs to be done for knowing exactly when the prices went up or
down and then we will need to look for which events occurred during that time
period.
We will be focusing on different events that may affect Manchester United´s share
prices. As Elizabeth Díaz – specialist in football trade market – defends in her
article, the most important events that affect the share prices are: (Díaz Zúñiga,
2019)
• ``Results on the field: good or bad results impact the spirits of the
fans, but also the share prices. We will be analysing if finally, the
investor is a fan of the club in which he/she is investing.
• Sport titles: it will be demonstrated that winning titles is a very
important indicator for investors.
• Players: signing a valuable player or selling someone can have
a significant impact on the added and real value of the club.
Human factors, for example, a scandal of an important player
may also affect the reputation of its player and as a consequence
of the club.
• The brand: maybe television right, promotional items among
others play an important role in addition to the capital injection
and is reflected in its valuation within the market.´´
After these analyses there will be an order within the events that will demonstrate
the importance of the different occurrences that occur in relation to Manchester
United share prices. With this order it will be possible to see if it´s more important
6for the shareholders to win the Premier League rather than selling or buying a
valuable player, for example.
Finally, the necessary conclusions will be drawn to give us an idea of what affects
the Manchester United´s share prices most.
1.2. The beginnings of Manchester United in the stock market.
As Elizabeth Díaz informs us,
``Manchester United´s stock (NYSE: MANU) began to be traded
in the stock market in 1991 on the London Stock Exchange. In
2005, when the entrepreneur Malcom Glazer acquired 75% of
the shares, the club´s shares left the stock market. In August
2012, the club´s share went public again, this time, on the New
York Stock Exchange, managing to place only 16,6 million
securities at a price of 14$, below the 16$-20$ range that Glazer
wanted´´. (Díaz Zúñiga, 2019)
Immediately, 10% of Manchester United was sold in the initial public offering
(IPO), raising 233 million $, a third less than hoped. (BBC, 2012)
1.3. How Manchester United´s stock has evolved.
In this section a study of the evolution of Manchester United´s stock will be made.
The period that is going to be analyzed will go from the moment that the shares
started to be traded on the New York Stock Exchange, the 10th of August 2012,
until today.
As mentioned before, important movements in the stock market will be analyzed
and compared with casual events that might have occurred during that certain
period.
1.3.1. Fundamental analysis.
As mentioned in the introduction, and how IG defines:
``Fundamental analysis is a method used to evaluate the intrinsic
value of an asset and to analyse factors that could influence its
price in the future. This type of analysis is based on the
assessment of assets based on external facts and influences, as
well as financial statements and industrial trends.´´ (IG, n.d.)
In this analysis we will look at the peaks of the trend cycles of Manchester
United shares. As we have said before, we will compare the most
important moments of rise and fall in the stock market with the news that
has emerged at the time.
7First, we will see the hole chart, extracted from Macrotrends, that shows
us the complete evolution of the share prices of Manchester United, from
now called MANU. (Macrotrends, s.f.)
Chart 1. MANCHESTER UNITED HISTORICAL CHART
3
1 2
Source: macrotrends (edited by me)
The chart from above shows us the evolution from 10 th August 2012 until 24th
February 2020. Since Manchester United´s shares started to be traded, important
movements have occurred. Some big movements will be analysed and will be
related with different events.
As signalised in the graph, three big movements are going to be analysed. This
three movements are going to be represented in a daily chart. This means that
every candle stick is going to be equal to one full day. If the candle stock is green
it means that there has been an increase in the price, and, on the other hand, if
the candle stick is red, the price of the stock has decreased.
8• 1st important movement:
Chart 2. 1st important movement MANU
Source: macrotrends
In this first important movement, that goes from 15/10/2012 until 08/02/2013, we
see that during this four month there has been a constant increase in the market
share prices.
In this period the minimum price was of 12.25 $ (19/10/2012) and it reached a
maximum price of 18.66 $ (08/02/2013). This means that in only four months
MANU share prices increased 6.41$, or said in other words, in four months there
has been an increase of 52.33% in the share prices.
The season began bad for MANU losing their first match against Everton and
having a hard start in the Premier League which is reflected on the left of the
chart where we see how the prices where decreasing because of the fear of the
investors that it would be a bad season. After the hard start, from mid-November
they won 18 consecutive games which is reflected in a constant increase in their
market share price.
Investors throughout December realized that MANU had a chance of winning the
Premier League, that they had a strong and competitive team and that they were
seen with forces to compete in the Champions League because of the `weak
group´ in which they were placed (Galatasaray, Braga, CFR Cluj and Manchester
United). This positive thinking made stock prices increase in early 2013.
After being classified for the round of 16 in the Champions League they were
drawn against Real Madrid. At that moment the market share prices reached the
9maximum of 18.66$ but after losing against Real Madrid the prices started to
decrease, as we can see at the final of the chart above (13/02/2013). (Towle,
2013)
• 2nd important movement:
Chart 3. 2nd important movement MANU
Source: Macrotrends
The second important movement in the history of MANU stock prices goes from
09/09/2015 until the 27/03/2015. It can be observed that during this specific
period of time, since the 12/11/2015 (the first large green candlestick), there has
been a constant decrease of MANU stock market prices during more than six
months, going from 18,990$ on the 12th November to 13,330$ on the 22th of
March.
This means that in only 6 months there has been a decrease of 29,81% in the
MANU stock prices, which is equivalent to a diminution of 5,630$ in the share
prices.
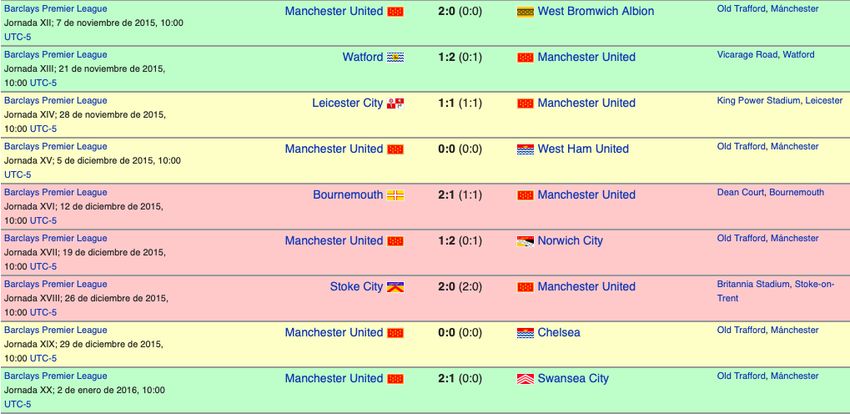
The season in the Premier League began good for Manchester United, but as we
can see in the next table, they had a bad streak of 7 consecutive game without
winning, since the 7th of November until the 2nd of January, when they defeated
with 2-1 Swansea City. This bad streak is clearly seen in the evolution of MANU
stock prices.
10Table 1. MANU results 15-16
Source: Premier League 15-16
During the month of February, we observe a little increase in the share prices
because they classified for the quarter finals for the FA CUP, but after a few
weeks the early elimination of UEFA against Liverpool caused the value of the
shares to fall further to 13.33$. (Premier League, 2016)
• 3rd important movement:
Chart 4. 3rd important movement MANU
11Source: MacroTrends
Following the evolution of the graphic above, it´s observed that from the period
going from 23/07/2018 until 09/12/2018 there has been a lot of differences in the
share prices.
On the 31st of August, MANU stock prices reached their maximum in history,
having each stock a value of 26,200$. As it´s observed in the graphic, during the
month of August there has been almost a constant increase in the market share
price, going from 20,75$ on the 6th of August until 26,20$ on the 31st of August.
In other words, in nearly one month there has been an increase of 26,27% in the
price (increase of 5,45$). As it can be observed in the next table, this
increasement is not due the results they had during this month in the Premier
League, in which they lost 2 of 3 matches:
Table 2. MANU results 18-19
Source: https://www.premierleague.com/clubs/12/Manchester-United/results?co=1&se=210
One of the main reasons because the market share price increased is because
Manchester United reinforced with good players their team during the summer
market They spent a total of 82,70 million € and that became a big hope for
investors for a successful season.
With the optimism that was at the beginning of the season and after seeing how
Manchester United started the season, the market share prices started to
decrease. After only 3 months of being at the maximum value price of the MANU
stocks, the prices decreased from 26,2$ to 17,275$.
12The main reasons of this decrease are that they fell eliminated from the Carabao
Cup on the 25 September against a second division team (Derby County) and
also because on the 18th of December 2018, Jose´s Mourinho team had only won
7 games of 17 football matches. They stopped this terrible beginning and also
the decrease on the market stock prices with the destitution of Jose Mourinho
after losing 3-1 against Liverpool. (Premier League, s.f.)
1.3.2. Technical analysis.
As defined in the introduction, different technicism are going to be used in order
to elaborate a completely technical analysis.
This analysis will be focused on a long-term period. The graphic that is going to
be studied will be only one graphic that provides the entire evolution of the stock
market price of MANU since they started to be traded on the New York Stock
Exchange, in August 2012.
Chart 5. Technical analysis MANU
Source: Macrotrends (edited by me)
As it can be seen above, during the last 8 years, in the evolution of the market
share prices of MANU there has been a clear price range that has been oscillating
between 14,60$ and 19,970$. This range of prices is shown in the graphic with
the blue rectangle. This range of price can also help us to observe which are the
main resistance and support of the MANU´s shares.
The main support during the evolution of MANU´s shares has been more less
around the price of 14,60$. This means that several times when the prices
decreased more less until the level of 14,60$ there has been a rebound in the
13support that has raised the share prices of Manchester united. These rebounds
are shown with a green circle (6) in the graphic above.
The opposite happens with the main resistance of MANU´s shares. When the
price increases more less until 19,970$ than it tends to decrease again. These
rebounds down are shown with a red square in the graphic above (5). Here, the
thing is that when the price consolidates above the resistance of 19,970$, this
resistance turns over into a support for the MANU´s shares. This is what
happened from the 5th of July of 2018 until the 22th of November of 2018:
Chart 6. Technical analysis MANU
Source: MacroTrends (edited by me)
As it´s shown with a black line in the graphic above, once the price was
consolidated above the main resistance of 19,970$, this resistance became an
important support for the next 6 months until the last week of November when
the price broke the support and consolidated below which made it a resistance
again.
Now, going back to the graphic in which is seen the entire evolution of the shares,
a more detailed technical analysis will be made. Different levels of resistance and
support will be shown, including different channels and different patterns that may
guide us to a prediction of how the shares are going to evolve.
14Chart 7. Technical analysis MANU
1
2
3
4
5
Source: Macrotrends (edited by me)
The supports and resistance drawn on the graphic depends on the price market
at a current time:
1. If P>22$ Support If 22$>P>20$ Resistance
2. If 22$>P>P20$ Support If 20$>P>18$ Resistance
3. If 20$>P>18$ Support If 18$>P>16$ Resistance
4. If 18$>P>16$ Support If 16$>P>14$ Resistance
5. If 16$>P>14$ Support If P1.4. Events related to major movements within the stock market.
There are several events that are directly related to different movements within
the stock market.
On one hand, as analysed in the fundamental analysis, the first important
movement in the stock share prices became because MANU had a very
competitive team and in November, they won 18 consecutive games plus their
classification in the Champions League and the good luck of playing against less
powerful teams in the first round. This made the investors invest more in the
MANU´s shares because they thought it would be a good season for them.
On the other hand, bad results affect also negatively in the MANU market share
prices. Bad results have even a greater effect than positive results, the reason is
that investors doesn´t like to speculate when things are going moving in a bad
situation. Investing is very nice when everything goes like it has to go, but with a
slightly unstable situation the investors prefer to take out their money.
Other important events that have influenced in the market share prices are the
classification for the FA Cup and specially how Manchester United does it in the
transfer market. It´s observed in the 3rd big movement that they started spending
almost 83 million euros which was seen with very good eyes for the investors.
1.5. Hierarchy of influences on Manchester United´s stock.
The events that have occurred since Manchester United went on the Stock
Market in 2012 can be classified according to their level of importance in relation
to the price movements of the MANU´s shares.
For MANU´s investors, in line with what we have analysed, the order of the most
important events that occurs in relation with the prices of Manchester United´s
stock market is:
TRANSFER
MARKET
RESULTS ON FIELD
SPORT TITLES
THE BRAND
Source: Created by me
161.6. Conclusions.
After all the above information, it is concluded that since Manchester United went
out on the New York stock exchange market, it has been evolving more or less
with a steady growth, pointing out that in the long term it has always maintained
an uptrend, going from a price of 12,25$ in August 2012 until 19,970$ in February
2020, having an increase of 7,72$ in the total price along the time, which is equal
to an increase of 63,02% in the value of the MANU´s shares in almost 8 years.
Going on with the conclusion, after analysing the fundamental analysis of the
evolution of Manchester United share prices and comparing them with different
events that have occurred along the years, a correlation is observed between
some movements in the prices and the events that have taken place in a specific
time.
As Elizabeth Díaz said: ``the most important events that affects the share prices
are results on the field, the branch, sport titles and players´´. As analysed before,
Manchester United investors focus on how the team is doing and what is
happening related with the team. These events can be classified in a hierarchy
of influences on Manchester United´s stock:
1) The biggest movements in the share prices happened when Manchester
United did some big moves in the transfer market, buying new players and
selling others. The investors look very close at every movement the club
does in the transfer market.
2) The second most important fact that affects MANU´s stock prices are
obviously how they are doing it in the season, which results they obtain
and if they get classified for different tournaments, such as the Champions
League or FA Cup among others.
3) Finally, it´s difficult to see how the titles affects the prices of Manchester
united because they haven´t won a title in the last years. That´s why, along
with the brand are the events that have the least correlation with the
evolution of the price shares.
In conclusion, there have been factors that have impacted more and others that
have had less impact on the evolution of Manchester United prices in the financial
markets. But, looking at long-term data, even if it has had a good or a bad season,
the price of MANU´s shares have been rising steadily.
172. Italy: Serie A
2.1. Introduction.
Juventus Football Club is one of the three teams of the Serie A that are traded
on the stock exchange market of Milan, the other two teams are Lazio and Roma.
As defined in the official webpage of Borsa Italiana:
``Juventus Football Club S.p.A. is one of the prominent
professional football clubs internationally, boasting a fan
potential of approximately 12 million in Italy.
Juventus' entire winning track-record is the richest among all
Italian football clubs, with 36 Italian Championships, 13 Italian
Cups and 7 Italian Super Cups domestically, and a number of
international trophies, i.e. 2 Champions Leagues, 2
Intercontinental Cups, 2 European Super Cups, 3 U.E.F.A. Cups,
and 1 Cup Winners' Cup.
Sporting achievements have greatly contributed to the
Company's reputation and prestige and Juventus' very name
elicits perceptions of success, professionalism and tradition. The
Company has successfully supplemented its core competitive
sporting activities with a comprehensive effort to exploit its
corporate name, which has become one of the world's best
known and most popular brands, achieving significant economic
results.´´ (Borsa Italiana, 2020)
In this section, the beginnings of Juventus in the stock market, the
evolution of the share prices and different events related with the
movements in the market will be analysed.
Two main methods will be used to analyse this Juventus shares in the
stock market:
1) Fundamental analysis: in which is going to be analysed the
different events that may affect the movement of the share prices.
These events, as explained before, mainly are going to be: the
results of the team, the classification for different tournaments,
titles that they have won and specially, in this case, the transfer
market will play a very important role in the movement of the share
prices.
2) Technical analysis: just looking at the evolution of the share price,
an analysis will be done focusing on the main patterns,
resistances and supports that may cause a change in the prices
because of speculation with technical methods.
18Finally, there will be a clear conclusion explaining the hierarchy of the
events that affects Juventus share prices and which way the share price
can go during the next months.
2.2. The beginnings of Juventus in the stock market.
Before Juventus stock were going out on the exchange market, on the grey
market, which is an unofficial market that serves to test the acceptance that a
company's IPO will have, the shares were paid at 3.45€ compared to 3.70€
(-6,35%) to which it was going to be released the next day, the 20th of December
of 2001, when it finally went out officially on the Exchange Market of Milan.
(CincoDias, 2001)
This means, that before going out on the market, the family Agnelli, known as the
proprietaries of FIAT and also having more than 50% of Juventus FC, were
already losing 0.25€ of each share they were going to put on the market.
The positive thing was that small investors were very enthusiastic with the offer
from Juventus. The demand doubled supply and the main reason for this high
demand is because those small investors are loyal fans of one of Italy´s historic
clubs, Juventus. As a fact, the Juventus fans are one of the most loyal club fans
of all football clubs.
2.3. How Juventus stock has evolved.
In this section a study of the evolution of Juventus stock will be made. The period
that is going to be analysed will go from the moment that the shares started to be
traded on the Borsa Italiana, the 20th of December 2001, until today.
As mentioned before, important movements in the stock market will be analysed
and compared with casual events that might have occurred during that certain
period.
As regards the shareholding of Juventus, it´s very important to know how the
shares are distributed:
``The shares belong 60% to Exor NV of the Agnelli family, 7.5% to an investment
firm based in Libya and 32.5% to other types of minority shareholders.´´
(Estrategia Bolsa, s.f.)
2.3.1. Fundamental analysis
As its already mentioned before, for doing correctly the fundamental analysis, it´s
needed a lot of information of events that relates in some way the movement of
the share prices and the facts that may have occurred.
In the process of doing the fundamental analysis of Juventus FC, it will be very
important to compare all information we have related with the club since they
started to be on the Stock Exchange of Milan. Once again, we will look at the
19peaks of the trend cycles of Juventus shares and compare them with events that
have occurred during that certain period of time.
For seeing better and more detailed the hole evolution of Juventus share prices
since they went on the stock market, 2 graphics are going to be shown: the first
one goes from the day that Juventus went out on the Stock exchange, 20 th
December 2001, until December 2010 and the second one goes from January
2011 until March 2020.
Chart 8. JUVENTUS HISTORICAL CHART
1
Source: Trader Degiro (edited by me)
Chart 9. JUVENTUS HISTORICAL CHART
3 4
2
Source: Trader Degiro (edited by me)
20The two charts above are represented with monthly candlesticks. This means
that every candle we see above is an evolution of the price in one entire month.
It´s put monthly because as it is a very long time that needs to be analysed it
would be very difficult to see a graph with daily candlesticks.
In both graphs, and also in the following graphs, the blue candlestick means that
there has been a decrease in the share price, while a white candlestick means
an increase.
As signalized in the graphs above, four different big movements in the Juventus
share prices are going to be studied. By taking a general view of the price
evolution, it´s observed that three of the four big movements have been a
decrease in the prices, and only one big increase movement. It´s also observed
that for 5 years, since 2012 until 2017, the price range has followed a straight line
without hardly changing the value of the stock.
• 1st important movement:
Chart 10. 1st important movement JUVE
Source: Trader Degiro
Above is observed the first considerable movement in Juventus stock prices. The
graphic above is seen as a weekly chart, that means that every candlestick is
equal to 1 week. The first important change in the price arose the first year the
company was traded in the stock market. This movement goes from 15th April
2002, where the price recorded its all-time high 3,604€, until 10th February 2003
when the price had decreased to 1,223€.
21This show us that it was a very bad beginning for the Juventus in the stock market,
losing a total of 66,06% in the value of the share price, or said in other words,
losing 2,381€ of each share.
The relation between the events that occurred during this period and the
decrease in the price shares are explained in the paper CincoDías:
``Despite also winning this year (2002) the title of the Italian
League and reaching the final of the European competition,
Juventus - on whose board of directors sits Al Saadi Gaddafi, 28,
son of the Libyan colonel, representing Libyan Arab Fore
Investment, the second largest shareholder of the team after IFI,
with 7.50% of the capital - does not go through its economic best.
During the first nine months of its 2002/2003 financial year, the
club recorded losses of EUR 11.4 million, compared to 22.3
million profits recorded in the same period of the previous year.
These are negative data that, together with the defeat in the
European final, have lowered the enthusiastic goals that
Juventus had set out to do this year.´´ (CincoDías, 2003)
So it can be concluded that the first big movement in the shares of
Juventus became because of economic loses in the club, plus the bad
economic moment of the 2nd largest shareholder of the club and finally
the snap of the decline came because they loosed the Europe League
final against Milan which created more an emotional movement of the
investors than a reasonable action of them.
• 2nd important movement:
Since the first important movement between 2002 and 2003, the market
share prices of Juventus were slowly falling steadily. The next important
movement in the market surged almost ten years later, in the season
2011-2012.
By observing the chart below, it´s observed that in this 10 year the price
of the shares has decreased from 3,70€ to something less than 1€. As
said before, from 2003-2011 the prices were decreasing slowly but
suddenly a big movement happened in the market going from the 12th of
September 2011, when one share costed 0,934€, until the 16th of January
2012 when its value was 0,154€.
This decrease, of 0,78€ in only 124 days can be misleading by the fact
that ``it’s a question of cents´´ what has been lost in just 4 months. But
by doing calculation, this huge decrease in the price means a loss of
value of 83,51% of the share, which means that if someone invested
10.000€ before this movement, in only 4 months that person would have
loosed more than 8.000€.
22Chart 11. 2nd important movement JUVE
Source: Trader Degiro (edited by me)
As said before, the 2nd largest shareholder was Al Saadi Gaddafi, son of Libyan
president Al Saidi Gafi. Whether it´s coincidence or not, at the end of 2011, the
fall of the Gaddafi regime was taken place. This event can be related with the
decrease in the share prices which started in September but had a very big
movement in only 1 week in December (signalized on the chart). (Sanz, 2017)
Nothing had to do with this decrease what was happening on the field, in the
season 2011-2012 Juventus won the Serie A without losing a match. It became
the first Italian team in history to win a league without losing a game.
Table 3. Clasification JUVENTUS 11-12
Source: http://www.legaseriea.it/en/
23• 3rd and 4th important movement:
Chart 12. 3rd and 4th important movement JUVE
4
3
Source: Trader Degiro (edited by me)
At the weekly chart above its observed the 3rd and 4th big movements that
Juventus has suffered in the stock market.
The 3rd movement was the first big bullish move in their history, going from 0,849€
each share on the 6th of August until 1,595€ on the 17th of September. This means
that in more or less 40 days, the share price increased 87,86%. How was this
movement possible after having a very constant range of share prices for the last
years? The answer is very easy, and it has a name and a surname, Cristiano
Ronaldo.
In the summer transfer market of 2018, there were speculations that Cristiano
Ronaldo was leaving Real Madrid and the team which was best positioned for
buying Cristiano Ronaldo was Juventus. So, Juventus went into a bullish market
for a few weeks because investors saw an opportunity investing in Juventus
because if they finally were going to buy Cristiano Ronaldo they would increase
a lot their prestige as a football club and they would also have bigger chance for
winning further competitions.
As its seen, just after the transfer was made official, the share prices decreased
almost to the value before speculation. As explained on the webpage Finance:
``Turin's Juventus shares today (24th September 2018) are
traded at drops of around 6% on the Milan Stock Exchange, as
investors are selling after the rise recorded in the last few weeks
prior to the confirmation yesterday of Cristiano Ronaldo's signing.
Investors are now applying the typical maxim of 'buy with the
24rumor and sell with the news', that is, they are making cash
whenever the arrival of the Luso star is already official.´´
(Finanzas, 2018)
Another considerable movement happened in the last Champions Edition (2019)
which is marked on the chart with a blue arrow. As explained in the newspaper
El País Economía:
``The Italian football club Juventus fell on Wednesday 17.6% on
the stock exchange and recorded their biggest drop since
October 2013. The Milan Stock Exchange punished the team led
by Cristiano Ronaldo after his Tuesday's elimination in the
Champions League against Dutch Ajax. La Vecchia Signora's
stock closed at 1.39 euros.´´ (CincoDías, 2019)
The case of Ajax will be studied and analysed in the next chapter.
Finally, the 4th biggest movement happened last month, in March 2020 when the
Covid-19 (Corona Virus) pandemic started in Italy. In only one month, going from
10th February 2020 when the share price was 1,248€ until the 9 th of March when
it reached the minimum price in the last 18 months of 0,608€, the shares have
fallen 52,28%.
An article of Invertia on the 12 of March explains that: ``Juventus sink 18% into
stock market after Rugani coronavirus contagion. The drop is extended to 53%
of the Juve's stock market value if it starts counting on the day the coronavirus
arrived in Italy´´. (Puerto, 2020)
2.3.2. Technical analysis
For doing the technical analysis, a study will be done of the movements in the
share prices for the last decade. As explained in other sections, different
techniques will be used, such as support and resistance levels, ABCD patterns
among others.
Below a chart can be observed in which every candle stick is equal to a monthly
period. As it´s observable, this graphic goes from the 3 rd of April 2010 until the 3rd
of April 2020. As already mentioned before in this section, it´s observable a very
constant movement in Juventus share prices for 5 years, from 2012 to 2017, in
which the price had barely changed.
25Chart 13. Technical analysis JUVE
Source: Trader Degiro (edited by me)
As observed in the chart above, there have been 3 main supports and resistance
during the last decade. The most important support has been at the price of
0,16€-0,20€. This support hasn´t never been broken and it supported the price
for 5 years long (period 2012-2017). During this period, the resistance of the
share prices was about 0,52€. In 2017, once the price broke the resistance and
later decreased again until touching the resistance and then went up again, it was
confirming us that our previous resistance was becoming a new support.
So mid-2017, we had a support on 0,52€ and another resistance on more or less
0,78€ (which was a support before 2012). After testing twice this resistance,
finally, in 2018, when investors speculated with Cristiano´s Ronaldo arrival, the
price broke the resistance turning it into a support. At the same time, a triangle
was being formed. This triangle could have shown us that by not breaking the
geometric shape at least until the movement passed half the shape, and coming
from a fall, it was likely that when the geometric shape was broken there would
be a decreasing movement in the price shares, what is exactly what happened in
mid-2019.
On the graph below, which is the same one as before without the triangle, another
pattern can be observed, the ABCD Pattern:
• ABCD Pattern: the pattern which is observed on the chart below is called
an ABCD Sell Pattern. It helps identify trading opportunities in any market,
on any timeframe and in any market condition. The highest probability
trade entry is at the completion of the pattern (point D). For completing this
pattern, as explained in the introduction, point A has to be lower than point
C, and point B lower than point D. When we arrive at point D it´s a good
moment to sell.
26Chart 14. Technical analysis JUVE
D
B
C
A
Source: Trader Degiro (edited by me)
This two patterns, the geometric triangle and the ABCD pattern, coinciding at the
same period of time, would have be a very good moment to sell because this two
technical analysis shows us that there is a greater probability that our prognosis
will be met, which, as you can see, did.
To know more clearly the forecast of now, looking at the technical analysis, we
would have to wait to see if the price is going to break what has been our support
for the last year and a half or if it bounces. In case of bouncing it would be a good
opportunity to buy. Considering the current situation, which has been explained
in the fundamental analysis, it is likely to break our support and turn it back into
a resistance.
2.4. Events related to major movements within the stock market.
As analysed in the fundamental analysis, there are different events that in one
way or other way have affected the Juventus shares. This case is a little bit
special, because for the investors winning the Serie A League doesn´t have any
affect anymore in the stock exchange because they have been winning it for the
last 8 years consecutively and they already count on it that next season Juventus
will win again the League. What does have a big impact on the share prices are
the results they obtain in the Champions League, big movements in the market
have been created due to the final champions league against FC Barcelona or
the defeat from las edition against Ajax FC.
It´s been observed other events that affect the share prices which normally are
not so important in other football clubs who are publicly traded; the political aspect
27of the shareholders. As seen in the fundamental analysis, the first year Juventus
went on the stock market, and one of their main shareholders, Al Saadi Gaddafi,
son of the Libyan colonel, went through a bad economic moment and added to
the fall of the Gaddafi regime caused the share price to fall quite a bit.
Finally, among other events related to major movements within the stock market,
there is the importance of the transfer market. The investors look with a
magnifying glass every movement in the transfer market. Investors approval or
disapproval of what the directive does in the transfer market is clearly reflected
in the share prices.
2.5. Hierarchy of influences on Juventus stock.
The events that have occurred since Juventus went on the Stock Market in
December 2001 can be classified according to their level of importance in relation
to the price movements of the Juventus shares.
For Juventus investors, in line with what we have analysed, the order of the most
important events that occurs in relation with the prices of Juventus stock market
is:
TRANSFER
MARKET
RESULTS IN CHAM-
PIONS LEAGUE
POLITICAL MATTERS
SERIE A TITLES
Source: Created by me
THE BRAND
2.6. Conclusions
With the fundamental and technical analysis that we have done in this chapter;
different conclusions can be drawn.
First of all, it´s observable that when Juventus went on stock market in December
2001, they started at too high price, a price of 3,70€ which never has been so
high again. The first years on the stock market were difficult for the club, the price
was clearly in a decrease tendency until almost 2012. From this year, the club
28found stability in the share prices for 5 years long. This stability was constructing
the base of a new era in the Juventus share prices.
Secondly, from 2017, Juventus has been doing great things on the field and also
outside the field; they have been very active on the transfer market, they have
built a very good and prestigious brand among others. The good management of
the club has been traduced into the market share prices with a growing trend for
more than 3 years already.
This growing trend started because of different events that were related directly
to the stock share prices. As seen before, Juventus investors focus on how the
team is doing and what is happening related with the team. These events can be
classified in a hierarchy of influences on Juventus stock:
1) The biggest movements in the share prices happened when Juventus did
some big moves in the transfer market, buying new players and selling
others. The investors look very close at every movement the club does in
the transfer market.
2) The second most important fact that affects Juventus stock prices are how
they are doing it in the Champions League, which results they obtain and
which probability they think they have for winning the tournament.
Finally, the hole stock market is going currently through a difficult situation due to
the Covid-19. This pandemic has stopped almost the entire world, including the
Serie A. It has affected in financial terms all the clubs, obviously including
Juventus. Now it´s very unpredictable what is exactly going to happen, how the
market will react after a big decrease in the share prices of Juventus. For knowing
what is going to happen in the future, investors will have to wait to see how this
pandemic is evolving and until when the football matches are cancelled.
293. Holland: Eredivisie
3.1. Introduction
¨Founded on March 18, 1900 AFC Ajax is one of the largest and
most storied clubs in European football. After their founding and
acceptance into Dutch Football Ajax spent ten seasons in the
country's second division before earning promotion for the 1911
season. The move to the first division did not last long though as
just three seasons later the club was relegated for the first and
only time in its illustrious history.¨ (Ajax, s.f.)
The club is the most awarded of Dutch football having won 34 leagues, 19 cups
and 9 super cups, totaling 62 national titles and holding the record for trophies
won in the first two. According to a statistical study conducted by IFFHS in 2009,
it was the seventh most successful European team of the 20th century.
Table 4. Titles AFC AJAX
Source: https://english.ajax.nl/the-club/history.htm
In this section we will see when Ajax decided to list on the stock exchange market,
which impact it had on their economy and also how it has been evolving since
then.
30As already seen with Manchester United and Juventus, It is difficult to say why
the shares of a football club have been going up or down, and that is why we are
going to focus on:
• Fundamental analysis: in which is going to be analysed the different
events that may affect the movement of the share prices. These events,
as explained before, mainly are going to be: the results of the team, the
classification for different tournaments and titles that they have won
among others.
• Technical analysis: looking at the evolution of the share price, an analysis
will be done focusing on the main patterns, resistances and supports that
may cause a change in the prices because of speculation with technical
methods.
Finally, and following with the method of the other chapters, a conclusion will be
drawn in which there will be highlighted which are the most important events that
affects the evolution of Ajax share prices and the chapter will be concluded with
a prognostic of what may happen during the next months related to the share
prices.
3.2. The beginnings of Ajax in the stock market.
Since 17 May 1998 the club is registered as a Naamloze vennootschap (N.V.)
listed on the stock exchange Euronext Amsterdam. Ajax is the only Dutch club
with an initial public offering (IPO).
Only a limited amount of the shares in AFC Ajax NV are publicly traded on the
Stock Market. The AFC Ajax Association retain 73% of the shares. The following
majority shareholders are Insurance Company Delta Lloyd Group with 9.95%,
followed by former stockbroker Adri Strating with 8.65%. (Ajax, s.f.).
AFC Ajax was able to go on the stock exchange market because at the end of
1960´s and beginnings of 1970´s Ajax had created a very powerful team with one
leader: Johan Cruijff. he was the one who made ajax compete in the European
leagues against the best clubs of those times. This was giving a great prestige
to the club that later would be of great help to be able to make the leap of going
out to trade on the stock market
3.3. How Ajax stock has evolved
In this section an analysis is going to be made of one of the greatest historical
clubs of Europe. It will be observed how were the beginnings of AFC Ajax in the
stock exchange of Amsterdam, through what they have gone for already 3
decades and why there have been changes in Ajax´s stock prices.
For doing the analysis, as in the other sections, there will be made a fundamental
analysis in which is going to be related some events with movements that
happened in the stock market at the same time. The other part of the analysis will
31be a technical analysis, which is going to be similar as the Manchester United
and Juventus ones but including some different indicators that will help us to
understand better the movements from a technical point of view.
3.3.1. Fundamental analysis
For doing this type of analysis, it is very important that we compare as many
information we have of events that have occurred since AFC Ajax went on stock
market and compare them with the movement of the stock prices to see what
events have had more effects on the share prices.
As is done with Manchester United and Juventus, we will look at the peaks of the
trend cycles of AFC Ajax shares and compare them with events that have
occurred during that certain period of time.
As said before, AFC Ajax is an historical European club, so since they went on
the Amsterdam Stock Exchange Market in 1998, there have been many events
that differ the share prices in the market. For analyse the different movement
below you can observe the historical chart of Ajax, in which each candle stick is
equal to a monthly period.
Chart 15. AFC AJAX HISTORICAL CHART
3
1
2 4
Source: https://www.investing.com/equities/afc-ajax-chart (edited by me)
32In the historical AFC Ajax chart above, there are two different types of candlestick;
green ones, which means an increase in the price for a period of one month and
red ones, which means a decrease.
As it is observed during this section there is going to be an analysis of four big
different movements inside the share prices of AFC Ajax. Two of the four
important movements happened the first years Ajax went on the stock market,
then for a period of almost 13 years, going from 2005 to 2018, the price range
has been following a constant movement without any major up or down trend.
This price range has been between 6,07€ and 10,56€ for these years.
Finally, the last two movements that are going to be analysed happened the last
two years, going from 2018 to this month, April 2020.
• 1st important movement:
Chart 16. 1st important movement AJAX
Source: https://www.investing.com/equities/afc-ajax-chart
With the first chart expressed in daily candle sticks, it´s observed clearly that the
first big movement, like Juventus, was very bad in the stock exchange market,
starting with a clear downtrend.
On the 11/05/1998, Ajax opened the Amsterdam exchange stock market with a
value of each action of 14,75€. On the same day, the value of one share closed
at 13,72€, and that was just the beginning of a downtrend that was going to take
more than five years.
33It´s difficult to relate the events of 20 years ago with the movements in the share
prices, but in the season of 1999-2000, Ajax was one of the favourites to win the
Champions League. They passed the second round and the first round was
against Mallorca, who was an ¨easy¨ rival to win. As you can see on the chart,
some weeks before 2000, there was an optimistic environment within the
investors and the price raised a little bit, but the worst thing still had to arrive. On
the 25th of November 1999 Ajax lost 0 – 1 in their stadium against Mallorca, and
two weeks after, the 9th of December, they lost 2 – 0 being eliminated from the
UEFA CUP.
Table 5. UEFA AJAX 1999-2000
Source: https://en.wikipedia.org/wiki/2000–01_AFC_Ajax_season
This moment investors opened their eyes and saw that this Ajax wasn´t the same
team which had won so many things during the seventies. They started to get
their money out of the stocks and the price decreased more and more.
During the next season, 2000-2001, they failed eliminated of the UEFA CUP in
the 2nd round, even worse than the year before. This created panic among the
investors who didn´t trust any more in the philosophy of the best Dutch club.
This bad environment among the investors kept going on until the AFC Ajax
shares reached their historical minimum on the 10 th of March 2003, when the
price of one share was 3,14€ reaching their minimum historical price. This means
that in just under 4 years, the AFC Ajax share price decreased from 14,75€ to
3,14€ what is equal to a decrease in the price of 78,71%. This means that
someone who invested 1475€ in 1998 had in 2003 only 314€ left.
• 2nd important movement:
Since the AFC Ajax stock Price touched the historical bottom of 3,14€, a new
trend was starting. After five years of having a downtrend now an uptrend was
beginning that would take more or less two and a half years, until September of
2005.
In the season 2003-2004, Ajax won the Eredivisie (Dutch football competition).
Investors saw that at the price that the shares were and that they had a lot of
changes on winning the league, from April 2003 they started to reinvest their
money after Ajax was already kicked out in the group phase of the Champions
League.
The next season was a bad season for Ajax, they didn´t win the Eredivisie, they
didn´t win the Johan Cruijff Cup and they were eliminated in the Champions
league in the group phase, which was a very difficult group:
34Table 6. Clasification UEFA AJAX 03-04
Source: https://en.wikipedia.org/wiki/2004–05_AFC_Ajax_season
So how was it possible that the share prices of AFC Ajax were still increasing?
As it´s observed on the chart below, we see a clear uptrend in the prices of the
shares while the results on the field of that season were terrible for them.
Chart 17. 2nd important movement AJAX
Comparing different events that occurred during this time of period, there is one
important that is very related to many teams who are negotiated on the stock
markets, and this concrete event is what is known as the transfer market. Ajax is
very well known worldwide for the talented players they create from their football
school, and one of those many professional players is Zlatan Ibrahimović, who
had been playing for Ajax the last years before the season 2004-2005. In the
summer market they sold their best player to Juventus for a very good price
during that time plus other transfers they did what was seen with very good eyes
for Ajax investors.
35Table 7. Transfer Market AJAX 2004
Source: https://en.wikipedia.org/wiki/2004–05_AFC_Ajax_season
The club generated a total income of 22,4 million euros and they only bought one
player for 2,5 million euros. This was seen as a good income for the club which
was reflected in an increase in buying the ajax shares which was traduced into
an increase in the share prices.
• 3rd and 4th important movements:
In this section there is going to be analysed the last two big movements together
because between both movements less than a year has passed.
Chart 18. 3rd and 4th important movement AJAX
4
3
Source: https://www.investing.com/equities/afc-ajax-chart (edited by me)
After a period of almost 14 years in which the price range has been following
more or less a constant movement keeping the share price between 6,07€ -
3610,56€, 2019 would be an incredible season for the team and also for the
investors. But as people say, everything that goes up fast, comes down faster.
We will start with the season 2018-2019 where the 3rd big movement in the share
price of AFC Ajax took place. This season Ajax had new talented players coming
from their young football school. The team seemed to be very competitive at the
beginning of the season and it created some king of optimistic atmosphere
between the fans, the club itself and the investors. This atmosphere quickly
changed into reality, when in the first fifteen matches they had won 13 games,
tied 1 and lost another. This team was doing things very good on the field which
was translated in an uptrend in the stock market. They were doing it good in the
Eredivisie and also on the KNVB CUP (Dutch country cup), but this was
something that wasn´t a big surprise because during the last years they have
been doing it good in that competitions.
The surprise came with the Champions League. They classified for the
Champions’ League group phase in which they had to fight for the first or second
place. In their group there were powerful teams such as Bayern Munich, Benfica
and AEK Athens. Finally, they classified as 2 nd and went to the knockout phase
in the champions league. With their spectacular way to play there was a very
optimistic atmosphere, so the share prices were increasing but, when in the draw
they were put against Real Madrid the environment changed among the investors
and the share prices felled during a week more or less. The 5th of March 2019,
Ajax beat 1 – 4 against Real Madrid. The price in one day grew from 15,4€ to
16,5€.
Continuing on their way through the Champions League, after winning against
Juventus and going to the semi-final the share prices increased from 17,1€ on
the 16th of April to 18,6€ the next day. As it´s explained in the newspaper El
Confidencial:
``The share price of Ajax Amsterdam recorded a diametrically
opposed evolution after the triumph of the 'ajacied' set in the Field
of Juventus that gives the Dutch their pass to the semi-finals of
the top competition of the Old Continent 22 years after their last
presence in the last knockout round of the tournament. Thus,
Ajax securities, which began trading in 1998, were trading at all-
time highs and reached 19.10 euros per share. In this season,
the share price of the Dutch team has been revalued by 51% in
the face of good results in the domestic and European
competition, as well as by the prospect of closing several
billionaire transfers of the members of their staff.´´ (El
Confidencial, 2019)
Finally, they lost in a dramatic way in the semi-final against Tottenham which had
a very bad impact on their share prices. As the newspaper Expansión tells us:
``The success or failure of investors in listed football clubs may
depend on variables as unpredictable as a goal in the last minute
of the match. Ajax Amsterdam stayed out of the long-awaited
37You can also read