Study on laser powder bed fusion of nickel base alloy of G surface structure: scanning strategy, properties and compression properties - Nature
←
→
Page content transcription
If your browser does not render page correctly, please read the page content below
www.nature.com/scientificreports
OPEN Study on laser powder bed fusion
of nickel‑base alloy of G‑surface
structure: scanning strategy,
properties and compression
properties
Bo Qian1*, Hongri Fan1, Jianrui Zhang2,3*, Tengfei Li2, Jiangtao Xi3 & Zhijun Qiu3
Aiming at laser powder bed fusion of GH3536 nickel base alloy, the effects of different scanning
strategies on microstructure, porosity and mechanical properties were explored. In the aspect of
microstructure and micro hardness of the sample, three scanning strategies had little difference; in
the aspect of macro mechanical properties of the sample, the slope subarea scanning was better than
the helix and island scanning. On this basis, the slope subarea scanning was selected as the optimal
scanning strategy to form the G-surface structure, and the compression performance of G-surface was
studied. The results showed that: (1) the compression performance of G-surface structure was smaller
than that of solid structure, The compression strength of G-surface can only reach about 20% of
solid structure: the average strength value of G-surface is 220 MPa, solid structure is 1.1 GMpa; while
G-surface structure had a smooth compression curve, which indicated the good energy absorption
characteristics; (2) with the increase of wall thickness, the mechanical performance of G-surface
structure was also enhanced, while the energy absorption capacity was constantly reduced; (3) with
the same wall thickness, the compression performance of sample in building direction (BD) is higher
than that in horizontal direction (HD).
Laser powder bed fusion (LPBF) is a kind of additive manufacturing technology. The complexity of LPBF process-
ing technology, such as the combination of rapid solidification and thermal cycle, leads to the better mechanical
properties of manufactured parts by L PBF1. Due to the advantages in the manufacture of complex geometric
parts and small batch production. LPBF has great potential to replace the traditional subtractive manufacturing
technology, especially the application of GH3536 alloy in high temperature. GH3536 is a high ferric nickel base
superalloy reinforced by the solid solution of chromium and molybdenum. It has excellent corrosion resistance
and oxidation resistance, good creep strength below 900 ℃, good cold (hot) processing formability and welding
performance2–4. Since GH3536 is often used in high temperature, high stress and cyclic loading conditions, It is
very important to control the cracks development and porosity formation of the microstructure of materials5–12.
In this paper, the process of GH3536 nickel base alloy was studied by the original designed and manufactured
LPBF equipment, and the influence of different scanning strategies on the microstructure, porosity and per-
formance of GH3536 nickel base alloy was explored. In the self-designed LPBF equipment, the best scanning
strategy was used to verify the formability of Gyroid minimal surface; and the compression performance of
Gyroid minimal surface was explored13–16. G-surface, namely minimal surface, can be defined by two math-
ematical descriptions of the area description and the curvature description. For the area description, G-surface
is defined as the surface with the smallest area satisfying all external constraints (such as surface circumference
or external stress conditions). For the curvature description, G-surface is defined as the surface with the aver-
age curvature of zero. The definition of average curvature is as follows: the average curvature is the average of
the main curvature which is the maximum and minimum curvature of a point in space on any surface. Triply
periodic minimal surface is the periodic minimal surface function, which show periodic changes along the X,
1
School of Mechanical and Automotive Engineering, Shanghai University of Engineering Science,
Shanghai 201620, China. 2School of Mechanical and Power Engineering, East China University of Science and
Technology, Shanghai 200237, China. 3School of Mechanical, Materials, Mechatronic and Biomedical Engineering,
University of Wollongong, Wollongong, Australia. *email: qianbo@ecust.edu.cn; zsinhome@163.com
Scientific Reports | (2021) 11:6947 | https://doi.org/10.1038/s41598-021-86213-2 1
Vol.:(0123456789)
www.nature.com/scientificreports/
Figure 1. LPBF equipment.
Figure 2. SEM image of powder.
Y, Z axes in Euclidean space. With the help of periodicity of triply periodic minimal surface, smooth and fully
connected porous structures can be f ormed17.
Experiments and materials
Experimental equipment. The self-developed laser powder bed fusion additive manufacturing prototype
was selected as the experimental device, and the fiber laser was used. The maximum laser power can reach
250 W, the laser wavelength was 1080 nm, and the minimum laser spot diameter was 70 μM. In the manufactur-
ing process, nitrogen was used as the protective gas to isolate oxygen and prevent the oxidation of weld pool
structure during the LPBF laser high temperature processing. Figure 1 shows the equipment structure.
Experimental materials. GH3536 nickel base alloy was used as the metal powder in the e xperiment11. As
shown in Fig. 2, its particle size range was 18–64 μm, particle size distribution was D10 = 24.7 μm, D50 = 37.8 μm,
D90 = 57.7 μM. Figure 3 shows the particle size distribution. GH3536 nickel base alloy powder contains various
elements, including Ni, Cr, Fe, Mo, Co, W, C, Si and Mn. Table 1 shows the specific element content of GH3536
nickel base alloy powder.
Process parameters. In this experiment, three different scanning strategies, namely slope subarea scan-
ning, island scanning and helix scanning, were used to explore the influence on the microstructure and proper-
ties of the samples. Figure 4 illustrates the schematic diagram of different scanning strategies. Except for different
scanning strategies, other process parameters were the same in this experiment. Table 2 shows other process
parameters.
Experimental model. The samples for experimental model were mainly divided into block samples, tensile
samples and compression samples.
Scientific Reports | (2021) 11:6947 | https://doi.org/10.1038/s41598-021-86213-2 2
Vol:.(1234567890)
www.nature.com/scientificreports/

                                  Figure 3.  Particle size distribution of powder.

                                   Element                   Cr       Fe      Mo      Co      W        C     Mn     Si     Ni
                                   Mass fraction/wt%         22       18      9      1.8      0.9      0.1   Max1   Max1   Bal

                                  Table 1.  Chemical composition of the GH3536 powder.

                                  Figure 4.  Schematic diagram of different scanning strategies.

                                   Process parameters             Value
                                   Laser power P                  200 W
                                   Scanning speed v               1000 mm/s
                                   Scanning distance m            0.06 mm
                                   Thickness of powder layer H    0.035 mm

                                  Table 2.  Experimental process parameters.

Scientific Reports |   (2021) 11:6947 |                   https://doi.org/10.1038/s41598-021-86213-2                                  3

                                                                                                                                 Vol.:(0123456789)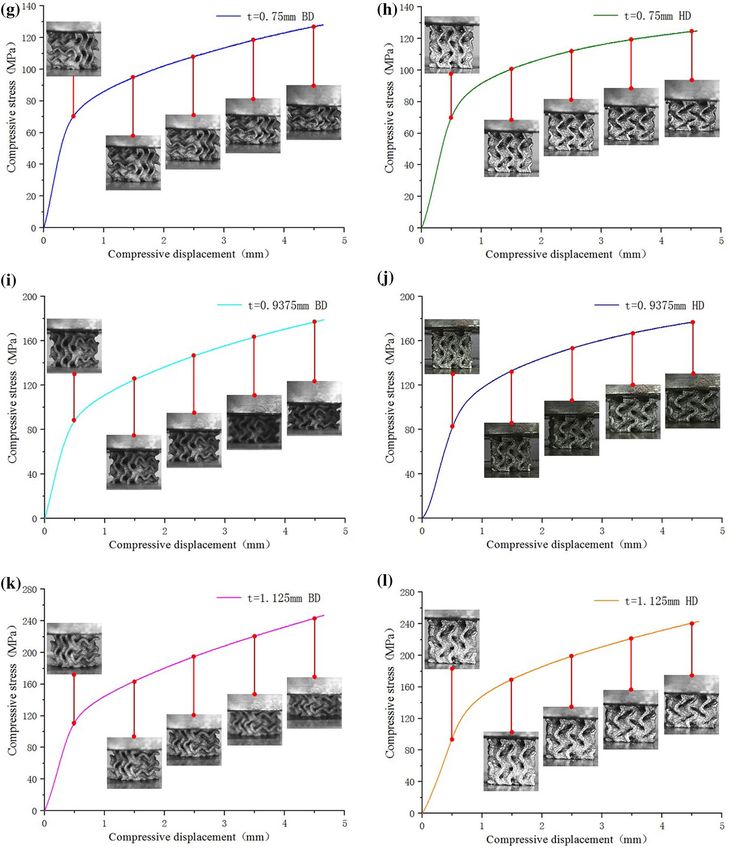
www.nature.com/scientificreports/
Figure 5. Size of metallographic sample model.
Figure 6. Size of tensile sample model.
Figure 7. Model size of solid compression sample.
1. Block sample model:
The block sample model was selected to print a simple square block with the size of 5 × 5 × 2.5 mm, as
shown in Fig. 5. Then micro-structure and organizational structure of the sample were observed by the
metallographic microscope and electron microscope.
2. Tensile sample model:
Figure 6 shows the dimension of the tensile sample model. Instron universal material testing machine was
used to measure tensile performance of the sample, and the corresponding tensile performance curve and
data were obtained.
3. Compression sample model:
Solid compression model:
Figure 7 shows the model size of the solid compression sample. The standard compression size of 6 × 6 ×
12 mm was selected. The compression performance of the sample was tested by Instron universal material
testing machine, and the corresponding compression performance curve and data were obtained.
4. Compression model with the complex surface:
G-surface structure was selected as the compression sample model with the complex s urface17,18. As a
branch of average curvature surface, G-surface is a kind of mathematical surface with 3-D periodicity, zero
average curvature and large surface area. G-surface divides the space into two interwoven subdomains while
keeping the cavity open. The mathematical implicit function relation of a minimal surface is described as
follows:
(1)
�G x, y, z = cos (ωx) sin ωy + cos ωy sin (ωz) + cos (ωz) sin (ωx) = c
Scientific Reports | (2021) 11:6947 | https://doi.org/10.1038/s41598-021-86213-2 4
Vol:.(1234567890)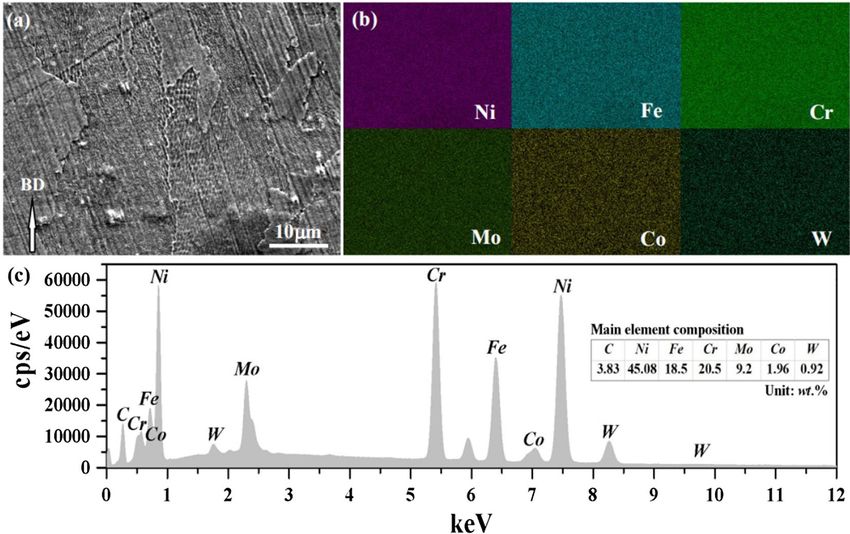
www.nature.com/scientificreports/
Figure 8. The model of compression sample: (a) hexagonal surface; (b) hexagonal surface was mirrored,
copied, rotated and spliced; (c) surface of the unit surface piece was smoothed; (d) the element body was arrayed
to obtain Gyroid minimal surface element body.
Wall thickness t (mm) Density ρ Surface area C (mm2)
0.1875 0.07495 2683.904
0.375 0.14618 2683.438
0.5625 0.21299 2671.247
0.75 0.27422 2641.798
0.9375 0.33063 2603.874
1.125 0.38208 2556.315
Table 3. Parameters of compression model with different wall thickness.
where c is a constant which controls the shape of the surface and the surface area of the structure. If c = 0 , it
is the G surface. ω is a coefficient, which indicates the number of periodicity. In other words, if ω = 2π, there
is a minimal surface element in a 1 × 1 × 1 cube with a period of 1.
In this paper, 3DMAX software was used to draw G-surface model, and the drawing process was shown in
Fig. 8. Firstly, a hexagonal surface was drawn, as shown in Fig. 8a. Secondly, the drawn hexagonal surface was
mirrored, copied, rotated and spliced to complete a unit surface piece, as shown in Fig. 8b. Thirdly, the surface
of the unit surface piece was smoothed, and the corresponding wall thickness was given to form a G-surface
element body, as shown in Fig. 8c. After the completion of Gyroid minimal surface element body, the element
body was arrayed to obtain the compressed sample model, as shown in Fig. 8d.
For the compression sample model, the wall thickness was changed to obtain compression samples with
various density, so as to analyze the compression performance. The size of compression sample was 15 × 15 ×
15 mm. Table 3 shows the parameters of compression model with different wall thicknesses.
Results and discussion
Figure 9 shows the printing results. The removed sample was cleaned by ultrasonic cleaning machine, and the
industrial alcohol was selected as the cleaning agent. After cleaning for 10 min, the adhesive powder on the
sample surface and the stains left during wire cutting were cleaned. The corresponding experiments were carried
out on the printed samples.
Microstructure. In this paper, Zeiss inverted metallographic microscope was used to observe the micro-
structure of GH3536 nickel base alloy samples under different scanning strategies, as shown in Fig. 10. It can
Scientific Reports | (2021) 11:6947 | https://doi.org/10.1038/s41598-021-86213-2 5
Vol.:(0123456789)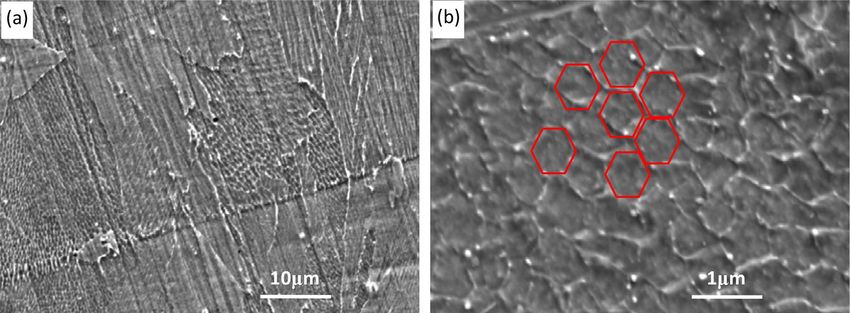
www.nature.com/scientificreports/
Figure 9. LPBF samples.
be seen that there are pores in the building direction (BD) and horizontal direction (HD) of the three samples.
The main reasons are as follows: (1) the melting speed is too fast, and the liquid metal produces violent ther-
mal expansion, then weld pool flows from the center to the surrounding, finally forming the pore; (2) the local
temperature is too high, leading to the gasification of some metal powders18; (3) due to the spheroidization, the
scanning track is not continuous and causes a large number of pores. Through the analysis of the porosity n of
samples by image method, it is found that the density of three types of scanning strategies are above 99%, among
which the slope subarea has the highest density, which is above 99.8%; the helix scanning strategy is the second,
ranging from 99.5 to 99.7%; while the density of island scanning is relatively worse than that of the first two,
which is more than 99.2%.
The metallographic samples were polished by acid etching solution (HCl + CuCl2 + C2H6O) to obtain the
weld pool and organizational structure. Microscope was used to observe the solution pool track morphology of
GH3536 nickel base alloy samples under different scanning strategies, as shown in Fig. 11. As shown in Fig. 11a,b,
under the helix scanning, morphology of sample presents a recirculated weld pool structure in the HD, which is
consistent with the intention of the Fig. 11a. The process of 90° angle of the scanning line is obvious in the BD.
Besides, some microcracks appear at the corner because of the high energy concentration and high temperature
gradient. As shown in Fig. 11c,d, under the island scanning, there are two vertical scanning directions in the
HD; in the BD, weld pool tracks intersect with each other, some of which are vertical to paper and others parallel
to paper. This is the characteristics of island scanning and consistent with the Fig. 11c. As shown in Fig. 11e,f,
the morphology of the sample under the slope subarea scanning presents a parallel weld pool track in HD. In
BD, there is a transformation process of weld pool track from the direction vertical to the paper to that parallel
to the paper. Due to the 67° rotation of scanning direction in slope subarea scanning after scanning the current
layer, the transformation weld pool is generated in line with Fig. 11e.
The microstructure of GH3536 nickel base alloy samples under different scanning strategies was observed,
and it is found that different scanning strategies have little effect on microstructure. The organization chart of the
sample under the slope subarea scanning was taken for analysis. Figure 12 shows the typical SEM characteristics
of LPBF microstructure of GH3536 nickel base alloy in BD. As shown in the Figure X, the microstructure shows
a typical austenite grain-substructure morphology. The austenite grains formed by rapid solidification cross the
boundary of adjacent weld pool or channel. For the substructure, the typical honeycomb substructure is evenly
distributed in the austenite grains, and the orientation characteristics of the substructure in each austenite crystal
are basically the same, while the adjacent austenite intragranular substructure show significant differences in the
orientation characteristics. The honeycomb substructure has obvious anisotropy, which is similar to the typical
columnar crystal. Its minimum diameter length is about 500 nm- 800 nm, and the longest axis length depends
on the size of austenite grain, which often runs through the whole austenite grain.
The formation of this submicron substructure is closely related to the LPBF laser non-equilibrium rapid
melting-solidification process: on the one hand, the super fast cooling rate can form fine-grained austenite grains,
on the other hand, the heavy metal atoms (such as Mo) in the austenite grains are not homogeneously diffused
under the condition of laser rapid cooling. Instead, they cluster at the subgrain boundary interface with relatively
high interfacial energy in the microregion, and show the micro morphology similar to the nanoscale sub-grain
boundary under the condition of metallographic c orrosion15,19–21. This kind of sub-micron superfine sub-grain
induced by LPBF rapid cooling has an important gain effect on increasing the metal strength. Macroscopically,
the sub-grain boundary has higher strength and hardness than the interior of the block; and at room temperature,
the more detailed the substructure, the better the reinforcement (while there is a certain viscosity in the grain
boundary at high temperature, which is easy to cause the relative sliding of adjacent grains).
Figure 13 shows the chemical composition diagram of EDS surface scanning energy spectrum in the LPBF
micro region of GH3536 nickel base alloy in the BD. The results show that in the interior and interface region
of adjacent austenite grains, there is no significant large-scale component segregation for basic components of
GH3536.
Microhardness. The hardness cloud diagram of LPBF samples under different scanning strategies is
obtained, as shown in Fig. 14.
Scientific Reports | (2021) 11:6947 | https://doi.org/10.1038/s41598-021-86213-2 6
Vol:.(1234567890)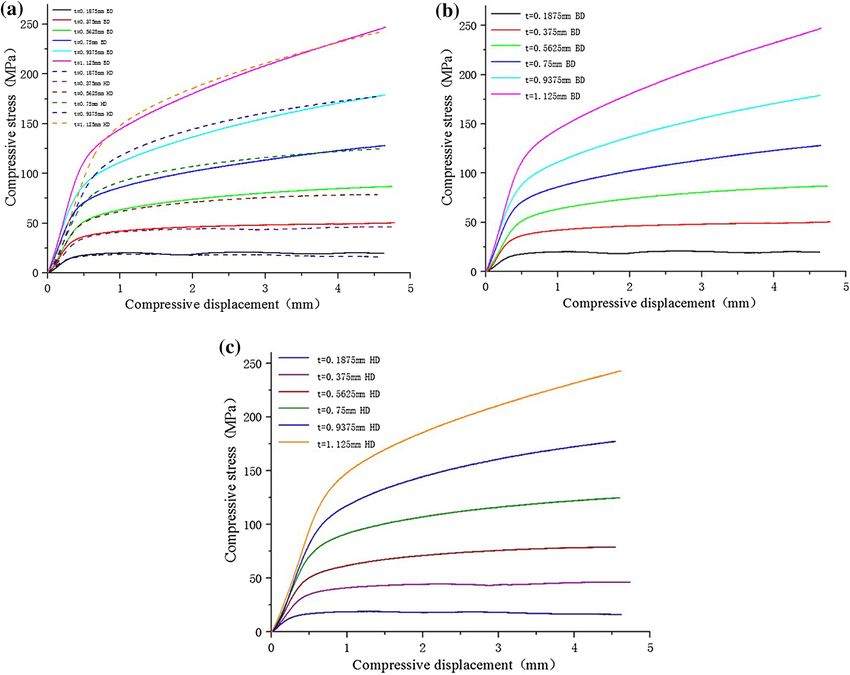
www.nature.com/scientificreports/

                                  Figure 10.  Microstructure of samples under different scanning strategies: (a,b) Island scanning; (c,d) helix
                                  scanning; (e,f) slope subarea scanning; (a,c,e) HD; (b,d,f) BD.

                                      In this paper, the HXD-1000TMC/LCD micro Vickers hardness tester was used to measure the micro Vick-
                                  ers hardness of GH3536 nickel base alloy samples under different scanning strategies. The load was 300 N and
                                  the loading time was 15 s. Each sample was sampled at 25 points. The interval of sampling points was 0.5 mm,
                                  forming a 5 × 5 square matrix. Then the average value was calculated. Figure 14 shows the microhardness cloud
                                  picture. It can be seen that the overall hardness range of the three scanning strategies is between 245 and 260
                                  HV, with the relatively average hardness distribution. In addition, there are also some points with low values.
                                      The average hardness curves of different scanning strategies are shown in Fig. 15. The average hardness of
                                  island scanning, helix scanning and slope subarea scanning are 251.77 HV (HD), 255.05 HV (BD), 252.98 HV
                                  (HD), 256.71 HV (BD), 252.21 HV (HD) and 254.62 HV (BD), respectively. The hardness difference between
                                  BD and HD surfaces under different scanning strategies is slight, almost no difference. Since micro hardness is
                                  the inherent characteristics of materials and closely related to the structure of materials, and the three scanning
                                  strategies have no effect on the microstructure, therefore, the microhardness displayed is similar. However,
                                  internal pores of the material still affect the hardness of local points. As the microscopic indentation of 217.4
                                  HV in the figure, the indentation edge locally collapses and corresponding cracks appear due to the existence
                                  of pores under the indentation position.

Scientific Reports |   (2021) 11:6947 |                https://doi.org/10.1038/s41598-021-86213-2                                                  7

                                                                                                                                              Vol.:(0123456789)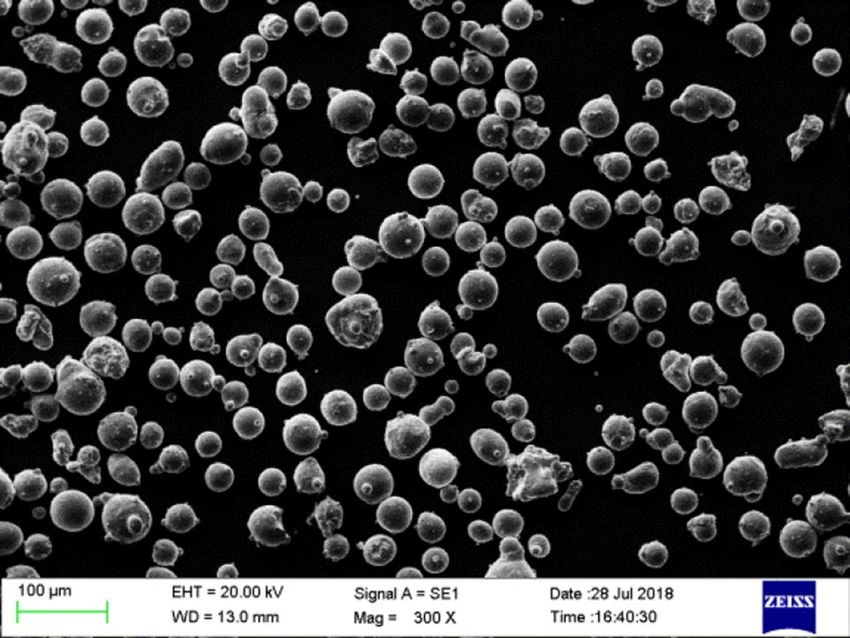
www.nature.com/scientificreports/

                                            Figure 11.  Weld pool of samples under different scanning strategies: (a,b) helix scanning; (c,d) Island scanning;
                                            (e,f) slope subarea scanning; (a,c,e) HD; (b,d,f) BD.

                                            Tensile properties. Tensile properties of GH3536 nickel base alloy samples under different scanning strate-
                                            gies were measured as shown in Table 4 and Fig. 16. Figure 16a shows the tensile curve of GH3536 nickel base
                                            alloy samples under different scanning strategies, and Fig. 16b shows the histogram of core parameters corre-
                                            sponding to the tensile curve. Table 5 lists the detailed parameter information of the tensile sample under dif-
                                            ferent scanning strategies. It can be seen that the tensile limit, yield limit and maximum strain of tensile sample
                                            under the helix scanning are 1052.5 MPa, 808.8 MPa and 23.1% respectively, which are much higher than those
                                            obtained by slope subarea scanning and island scanning. Among the three scanning strategies, the performance
                                            of the sample under the helix scanning is the best, followed by slope subarea scanning, and the performance of
                                            sample under the island scanning is the worst. The reason is as follows: under the helix scanning, the stretching
                                            direction is the same as that of the weld pool track, and the stretching area is composed of continuous weld pool
                                            tracks in the same direction, so the stretching performance is the best. In the island scanning, the scanning area
                                            is divided into several small square sub areas, and there are many sub area weld junctions in the stretching area.
                                            In other words, there are weld pool tracks parallel to the stretching direction and weld pool tracks perpendicular
                                            to the stretching direction, which are connected with each other. During the stretching, the mechanical proper-
                                            ties of the junction and weld pool tracks perpendicular to the stretching direction are prone to fracture, resulting

          Scientific Reports |   (2021) 11:6947 |                https://doi.org/10.1038/s41598-021-86213-2                                                   8

Vol:.(1234567890)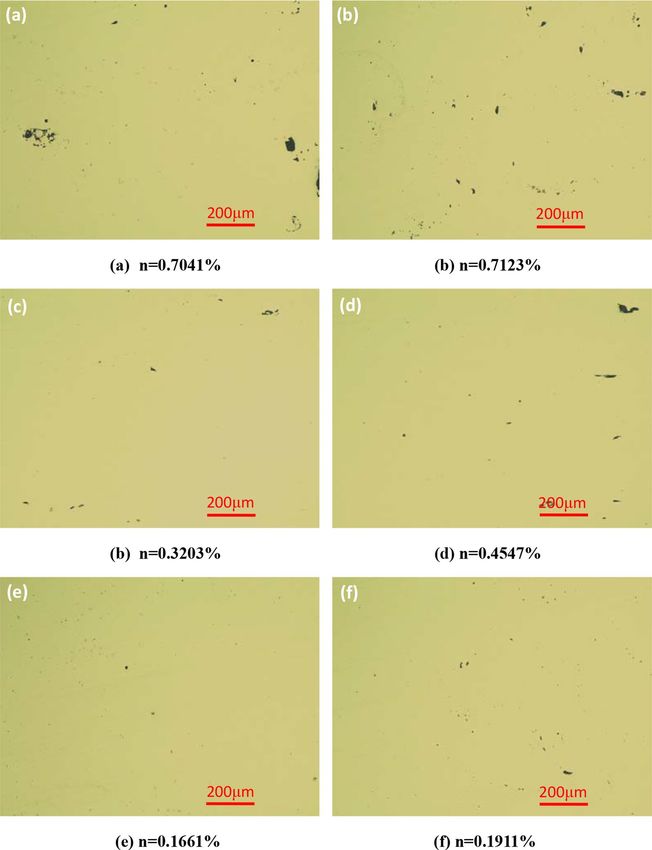
www.nature.com/scientificreports/

                                  Figure 12.  SEM images of typical LPBF GH3536 along BD: (a) polycrystalline substructure; (b) single crystal
                                  substructure.

                                  Figure 13.  FE-SEM image (a) from the cross-section view parallel to BD of the LPBF-built Hastelloy X and its
                                  corresponding regional EDS results of Ni, Fe, Cr, Mo, Co, W elemental maps (b) and their energy spectrum (c).

                                  in the worst tensile performance. However, there is the 67° difference between the track layers of slope subarea
                                  scanning, so there is a continuous weld pool track parallel and perpendicular to the stretching direction, and the
                                  track direction is changed constantly and alternately. Therefore, tensile properties of slope subarea scanning are
                                  between helix scanning and island scanning.

                                  Solid compression performance. The quasi-static compression properties of GH3536 nickel base alloy
                                  samples under different scanning strategies were measured. The stress-displacement curve is obtained, as shown
                                  in Fig. 17. It can be seen that the overall trend of the compression performance of the samples under different
                                  scanning strategies is relatively consistent. There are obvious elastic stages in the three compression curves, and
                                  the intermediate plastic stage is relatively long due to the excellent plasticity of GH3536. But the elastic modulus
                                  in the early elastic stage is different. The elastic modulus E of samples under three scanning strategies is 1.68 GPa
                                  (slope subarea), 1.38 GPa (Helix) and 1.19 GPa (Island), respectively. The elastic modulus of the sample under
                                  the slope subarea scanning is the largest, while the elastic modulus of the sample under the island scanning is the
                                  smallest. The compression direction of the three is all in BD, so the weld pool formed by scanning strategy has
                                  little influence on the compression performance. The defects such as pores produced by scanning strategy lead

Scientific Reports |   (2021) 11:6947 |                https://doi.org/10.1038/s41598-021-86213-2                                                    9

                                                                                                                                                Vol.:(0123456789)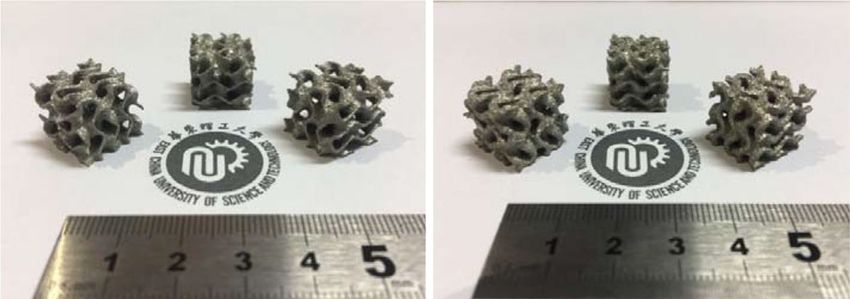
www.nature.com/scientificreports/

                                            Figure 14.  Hardness cloud diagram of samples under different scanning strategies: (a,b) Island scanning; (c,d)
                                            helix scanning; (e,f) slope subarea scanning; (a,c,e) HD; (b,d,f) BD.

                                            Figure 15.  Average hardness curve of samples under different scanning strategies.

          Scientific Reports |   (2021) 11:6947 |               https://doi.org/10.1038/s41598-021-86213-2                                                10

Vol:.(1234567890)
www.nature.com/scientificreports/
Tensile strain at maximum Modulus (automatic Young’s) Tensile stress at yield (offset Tensile stress at maximum
Tensile strain at break (%) load (%) (GPa) 0.2%) (MPa) load (MPa)
Slope subarea 23.07291 ± 1.5 20.45168 ± 1.8 234.88362 ± 12.5 680.31890 ± 15.8 894.39191 ± 20.8
Helix 25.88664 ± 1.8 17.59046 ± 1.2 150.44490 ± 10.7 808.83446 ± 20.8 1053.51660 ± 25.6
Island 13.23293 ± 1.2 10.91204 ± 1.6 161.17493 ± 10.4 619.75072 ± 15.3 802.98224 ± 20.4
Table 4. Tensile parameter of samples under different scanning strategies.
Figure 16. Tensile property of samples under different scanning strategies: (a) tensile curve of GH3536 nickel
base alloy samples under different scanning strategies; (b) histogram of core parameters corresponding to the
tensile curve.
Wall thickness t/mm
Elastic modulus/GPa 0.1875 0.375 0.5625 0.75 0.9375 1.125
Compression direction
BD 0.057 0.111 0.134 0.181 0.212 0.255
HD 0.052 0.092 0.129 0.166 0.194 0.203
Table 5. Elastic modulus of Gyroid structures with different wall thickness.
Figure 17. Compression curve of samples under different scanning strategies.
Scientific Reports | (2021) 11:6947 | https://doi.org/10.1038/s41598-021-86213-2 11
Vol.:(0123456789)www.nature.com/scientificreports/
Figure 18. Formed samples of Gyoid complex surface.
to different elastic modulus. Compared with the previous density, it can be found that the higher the density, the
greater the elastic modulus of compression.
Formability and compressibility of Gyroid minimal surface. By comparing the effects of three scan-
ning strategies on the structure and properties of the parts, the results show that the density of the parts obtained
by slope subarea scanning is higher than that of the other two strategies, while the microstructure and micro-
hardness are similar under the three scanning strategies; the yield strength and tensile strength of the parts
under the slope subarea scanning are higher than that of parts under the island scanning strategy and lower than
that of parts under the helix scanning strategy in the tensile performance; in the solid compression performance,
the elastic modulus and compressive strength under the slope subarea scanning are higher than those under
other two strategies. Therefore, for the sake of comprehensive consideration, slope subarea scanning is selected
as the best strategy when preparing LPBF additive to manufacture GH3536 structural parts.
The complex structures of Gyroid minimal surfaces with different wall thicknesses were fabricated by 3D
printing with slope subarea scanning, and the quasi-static compression experiments of Gyroid minimal surfaces
with different wall thicknesses were carried out in the BD and HD.
As shown in Fig. 18, six Gyroid minimal surfaces with different wall thicknesses are manufactured by LPBF.
They have complete structure, and the surface with the thinnest wall thickness t = 0.1875 mm has the excellent
forming quality. Therefore, the self-designed LPBF equipment in this paper has good formability and can manu-
facture thin-walled structure and functional parts with complex curved surface structure.
Through the quasi-static compression experiment of Gyroid minimal curved surface structure with different
wall thickness, the stress displacement compression performance curve is shown in Fig. 19.
It can be seen from Fig. 19a: compared with the compression curve of solid structure, the elastic modulus
of G-surface structure in the elastic stage is less than that of solid structure, and the rising trend of G-surface
structure in the intermediate plastic stage is far less than that of solid structure, and the compression strength is
also less than that of solid structure. However, the smooth plastic stage of the compression curve of G-surface
structure shows good energy absorption characteristics. As the wall thickness increases (the relative density
decreases), the mechanical properties of the Gyroid structure also increase, as shown in Fig. 19b,c. The elastic
modulus of the structure with different wall thickness is obtained by processing (a)–(l) curves in Fig. 20, as
shown in Table 5.
As shown in Fig. 20, in BD, the elastic modulus of Gyroid structure increases gradually with the increase of
wall thickness (the decrease of relative density); in HD, the elastic modulus of G-surface structure also increases
gradually with the increase of wall thickness (the decrease of relative density). However, at the same wall thick-
ness, the compressive modulus in BD is slightly higher than that in HD, and the compressive strength in BD is
also slightly higher than that in HD. This is because BD is the main direction of the grain growth orientation
produced by LPBF, that is to say, under the guidance of the thermal processing temperature gradient, grain grows
towards the direction of the upward layering of the weld pool. Therefore, the mechanical properties in the grain
growth direction (mainly reflected by a large number of columnar crystals in this direction) are higher than
those in the vertical grain growth direction.
It should be noted that for the G-surface structure with thin wall thickness, as shown in Figs. 19b and 20a,
the stress-displacement stage of the sample under compression shows multiple "cyclic instability" characteristics.
The occurrence of this intermittent instability or relaxation phenomenon has obvious periodic characteristics.
Combined with the deformation observation of samples with different compression displacement, it is considered
that when the wall thickness is thinner, G-surface structure has a periodic evolution of "elastic deformation—
plastic instability—fracture failure—plastic deformation—deformation strengthening" layer by layer during the
compression process. For the thicker wall thickness of the G-surface structure, there is no layered fracture, but
an evolution process of "elastic deformation- plastic deformation- deformation strengthening" layer by layer.
Therefore, the compression curve of G-surface structure with the thin-walled shows a wavy shape.
The smooth and long-term plastic stage of the static-quasi compression curve of G-surface shows good
energy absorption characteristics. In the compression of the external load, the flow stress level is low due to large
deformation, and the impact energy is transformed into the energy such as deformation and cracking of holes
in G-surface structure. Therefore, G-surface structure is a good energy absorption structure. To clearly observe
Scientific Reports | (2021) 11:6947 | https://doi.org/10.1038/s41598-021-86213-2 12
Vol:.(1234567890)www.nature.com/scientificreports/
Figure 19. Compression curves of Gyroid surfaces with different wall thickness: (a) the compression strength
curve of solid structure; (b) the compression strength curve of G-surface structure in BD direction; (c) the
compression strength curve of G-surface structure in HD direction.
the energy absorption characteristics of different wall thickness, the energy absorption efficiency η is used as the
evaluation method: the function of energy absorption capacity E is shown in Eq. (2), and the function of energy
absorption efficiency η is shown in Eq. (3).
εm
E= σ dε (2)
0
εm
E 1
η= = σ dε (3)
σm σm
0
where εm is the strain at a certain time; σm is the corresponding stress at that time; ε and σ are compression stress
and compression strain respectively;
Through the numerical calculation of the curve by Eq. (3), the energy absorption efficiency curve is obtained,
as shown in Fig. 21. With the increase of strain, the energy absorption efficiency of the G-surface structure
increases. When the wall thickness decreases, the energy absorption efficiency of the G-surface structure
increases. That is to say, the more gentle the compression curve, the higher the energy absorption efficiency, and
the better the energy absorption characteristics.
Conclusion
The process of GH3536 nickel base alloy was studied by self-designed LPBF equipment, and the effects of different
scanning strategies on the microstructure, porosity and properties of GH3536 were explored.
Scientific Reports | (2021) 11:6947 | https://doi.org/10.1038/s41598-021-86213-2 13
Vol.:(0123456789)www.nature.com/scientificreports/
Figure 20. Compression deformation of Gyroid surfaces with different wall thickness: (a) t = 0.1875 mm BD;
(b) t = 0.1875 mm HD; (c) t = 0.375 mm BD; (d) t = 0.375 mm HD; (e) t = 0.5625 mm BD; (f) t = 0.5625 mm HD;
(g) t = 0.75 mm BD; (h) t = 0.75 mm HD; (i) t = 0.9375 mm BD; (j) t = 0.9375 mm HD; (k) t = 1.125 mm BD; (l)
t = 1.125 mm HD.
Scientific Reports | (2021) 11:6947 | https://doi.org/10.1038/s41598-021-86213-2 14
Vol:.(1234567890)www.nature.com/scientificreports/
Figure 20. (continued)
Scientific Reports | (2021) 11:6947 | https://doi.org/10.1038/s41598-021-86213-2 15
Vol.:(0123456789)www.nature.com/scientificreports/
Figure 21. Energy absorption efficiency curve of Gyroid surface with different wall thickness.
(1) The results show that the density of the parts obtained by slope subarea scanning is higher than that of
parts by the other two strategies, and the microstructure of the parts by slope subarea scanning is similar
to that of parts by the other scanning strategies;
(2) In the aspect of tensile properties, the yield strength and tensile strength under slope subarea scanning are
higher than that under island scanning, and lower than that under helix scanning;
(3) The elastic modulus and compressive strength of the parts by slope subarea scanning the are higher than
those of parts under the other two strategies. Therefore, slope subarea scanning is the optimal strategy.
The model experiment of G-surface structure was carried out by slope subarea scanning. Six G-surfaces with
different wall thicknesses were manufactured in the experiment. Both of them had the complete structure and the
good quality. Then, the compression performance of G-surface structure was studied, and the results show that:
(1) Compared with the compression curve of solid structure, the compression performance of G-surface struc-
ture is smaller than that of solid structure, the compression strength of G curved can only reach about 20%
of solid structure, but the smooth compression curve of G-surface structure shows good energy absorption
characteristics;
(2) With the increase of the wall thickness (the decrease of the relative density), the mechanical properties of
the G-surface structure also increase, while the energy absorption efficiency decreases;
(3) At the same wall thickness, the compressive modulus in BD is higher than that in HD, and the compressive
strength in BD is slightly higher than that in HD.
Received: 14 December 2020; Accepted: 10 March 2021
References
1. Mumtaz, K. A., Erasenthiran, P. & Hopkinson, N. High density selective laser melting of Waspaloy. J. Mater. Process. Tech 195(1–3),
77–87 (2008).
2. Simone, P. et al. Effect of heat treatment on microstructure and oxidation properties of Inconel 625 processed by LPBF. J. Alloy.
Compd. 846(156418), 1–16 (2020).
3. Hu, Y. L. et al. Effect of solution temperature on static recrystallization and ductility of Inconel 625 superalloy fabricated by directed
energy deposition. Mater. Sci. Eng. A 772(138711), 1–12 (2020).
4. Xia, M. et al. Fragmentation and refinement behavior and underlying thermodynamic mechanism of WC reinforcement during
selective laser melting of Ni-based composites. J. Alloy. Compd. 777, 693–702 (2019).
5. Tomus, D. et al. Controlling the microstructure of Hastelloy-X components manufactured by selective laser melting. Phys. Procedia
41, 823–827 (2013).
6. Tomus, D. et al. Effect of minor alloying elements on crack-formation characteristics of Hastelloy-X manufactured by selective
laser melting. Addit. Manuf. 16, 65–72 (2017).
7. Zhang, S. & Meng, L. Simulation of single crystal nickel-based superalloys creep on finite element method. Adv. Mater. Res.
433–440, 2029–2033 (2012).
8. Munoz-Moreno, R. et al. Effect of heat treatment on the microstructure, texture and elastic anisotropy of the nickel-based superal-
loy CM247LC processed by selective laser melting. Mater. Sci. Eng. 674(30), 529–539 (2016).
9. Rometsch, P. A. et al. Evaluation of polychromatic X-ray radiography defect detection limits in a sample fabricated from Hastelloy
X by selective laser melting. NDT E Int. 62, 184–192 (2014).
10. Tomus, D. et al. Influence of post heat treatments on anisotropy of mechanical behaviour and microstructure of Hastelloy-X parts
produced by selective laser melting. Mater. Sci. Eng. A 667, 42–53 (2016).
11. Harrison, N. J., Todd, I. & Mumtaz, K. Reduction of micro-cracking in nickel superalloys processed by selective laser melting: A
fundamental alloy design approach. Acta Mater. 94, 59–68 (2015).
Scientific Reports | (2021) 11:6947 | https://doi.org/10.1038/s41598-021-86213-2 16
Vol:.(1234567890)www.nature.com/scientificreports/
12. Gu, D. & Chen, H. Selective laser melting of high strength and toughness stainless steel parts: The roles of laser hatch style and
part placement strategy. Mater. Sci. Eng. A 725, 419–427 (2018).
13. Maskery, I. et al. Compressive failure modes and energy absorption in additively manufactured double gyroid lattices. Addit.
Manuf. 16, 24–29 (2017).
14. Zhang, L. et al. Energy absorption characteristics of metallic triply periodic minimal surface sheet structures under compressive
loading. Addit. Manuf. 23, 505–515 (2018).
15. Li, Bo. et al. Additive manufacturing of ultrafine-grained austenitic stainless steel matrix composite via vanadium carbide rein-
forcement addition and selective laser melting: Formation mechanism and strengthening effect. Mater. Sci. Eng. A 745(4), 495–508
(2019).
16. Qian, B., Shi, Y. S., Wei, Q. S. & Wang, H. B. The helix scan strategy applied to the selective laser melting. Int. J. Adv. Manuf. Technol.
63(5–8), 631–640 (2012).
17. Zixin, F. Model Lightweight Method Based on Triply Periodic Minimal Surface (Dalian University of technology, 2017).
18. Monkova, K., Monka, P. & Zetkova, I. et al. Three Approaches to the Gyroid Structure Modelling as a Base of Lightweight Component
Produced by Additive Technology (2017).
19. Badrossamay, M. & Childs, T. H. C. Further studies in selective laser melting of stainless and tool steel powders. Int. J. Mach. Tools
Manuf. 47, 779–784 (2007).
20. Li, B., Qian, B., Xu, Y., Liu, Z. Y. & Xuan, F. Z. Fine-structured CoCrFeNiMn high-entropy alloy matrix composite with 12 wt%
TiN particle reinforcements via selective laser melting assisted additive manufacturing. Mater. Lett. 252, 88–91 (2019).
21. Li, B., Fu, W. Q., Xu, H. S., Qian, B. & Xuan, F. Z. Additively manufactured Ni-15Fe-5Mo Permalloy via selective laser melting and
subsequent annealing for magnetic-shielding structures: Process, micro-structural and soft-magnetic characteristics. J. Magn.
Magn. Mater. 494, 165754 (2020).
Acknowledgements
This paper was funded the Key Project of Chinese National Programs for Fundamental Research and Develop-
ment-Model Processing and Process Planning Software Project for Additive Manufacturing (2018YFB1105300)—
Universal Full-dimension Digital Model Project (2018YFB1105301) and National Natural Science Foundation
of China(51705307), Open Project Program of the State Key Lab of CAD&CG(Grant No. A2015).
Author contributions
B.Q. wrote the main manuscript text, J.Z. wrote the third section, T.L. did all the experiments and H.F. prepared
Figs. 1, 2, 3. All authors reviewed the manuscript.
Competing interests
The authors declare no competing interests.
Additional information
Correspondence and requests for materials should be addressed to B.Q. or J.Z.
Reprints and permissions information is available at www.nature.com/reprints.
Publisher’s note Springer Nature remains neutral with regard to jurisdictional claims in published maps and
institutional affiliations.
Open Access This article is licensed under a Creative Commons Attribution 4.0 International
License, which permits use, sharing, adaptation, distribution and reproduction in any medium or
format, as long as you give appropriate credit to the original author(s) and the source, provide a link to the
Creative Commons licence, and indicate if changes were made. The images or other third party material in this
article are included in the article’s Creative Commons licence, unless indicated otherwise in a credit line to the
material. If material is not included in the article’s Creative Commons licence and your intended use is not
permitted by statutory regulation or exceeds the permitted use, you will need to obtain permission directly from
the copyright holder. To view a copy of this licence, visit http://creativecommons.org/licenses/by/4.0/.
© The Author(s) 2021
Scientific Reports | (2021) 11:6947 | https://doi.org/10.1038/s41598-021-86213-2 17
Vol.:(0123456789)You can also read