"SUBSCRIBE" to SBI Cards and Payment Services Ltd - Niche product in the consumer oriented business
←
→
Page content transcription
If your browser does not render page correctly, please read the page content below

“SUBSCRIBE” to
SBI Cards and Payment Services Ltd.
     Niche product in the consumer oriented business
27th Feb. 2020
Salient features of the IPO:                                                 Recommendation                        SUBSCRIBE
• SBI Cards and Payment Services Ltd. (SBI Card), another PSU stock is
                                                                             Price Band                 Rs. 750 - 755 per Share
    about to enter equity market with its IPO, which opens on 2nd Mar.
    and close on 5th Mar. 2020. The price band is Rs. 750 - 755 per share.   Face Value                 Rs. 10
• The issue comprises of 137.15 - 137.19mn shares (fresh issue: 6.62 -       Shares for Fresh Issue     6.62 - 6.67mn Shares
    6.67; OFS shares: 130.53mn shares) in offering. Total IPO size is Rs.    Shares for OFS             130.53mn Shares
    102,895.1 - 103,547.7mn.                                                 Fresh Issue Size           Rs. 5,000mn
• The company will not receive any proceeds from OFS. Majority of the        OFS Issue Size             Rs. 97,895.1 - 98,547.7mn
    fresh issue net proceeds, will be utilize by the company to augment                                 137.15 - 137.19mn Shares
                                                                             Total Issue Size
    the capital base so as to meet the future capital requirement.                                      (Rs. 102,895.1 - 103,547.7mn)
                                                                                                        02nd Mar. - 05th Mar. 2020
Key competitive strengths:
                                                                             Bidding Date               (For QIB bidder, offer closes on
• Second largest credit card issuer in India with deep industry expertise                               04th Mar. 2020)
   and a demonstrated track record of growth and profitability
                                                                             Reserved for SBI Cards
• Diversified customer acquisition capabilities                                                         1.86mn Shares
                                                                             Employees (mn Shares)
• Supported by a strong brand and pre-eminent promoter
• Diversified portfolio of credit card offerings                             Reserved for SBI
                                                                                                        13.05mn Shares
• Advanced risk management and data analytics capabilities                   Shareholders (mn Shares)
• Modern and scalable technology infrastructure                              Net Offer for Sales (mn    122.23 - 122.28mn Shares
• Highly experienced and professional management team                        Shares)                    (Rs. 91,707.1 - 92,285.1mn)
                                                                             MCAP at Higher Price
Risk and concerns:                                                                                      Rs. 708,912mn
                                                                             Band
• Continued economic slowdown                                                                           Kotak Mahindra Capital Co.
• Change in government policies and regulations                                                         Ltd.; Axis Capital Ltd.; DSP
• Unfavorable interest rate movements                                                                   Merrill Lynch Ltd.; HSBC
• Unfavorable receivables portfolio-mix                                      Book Running Lead          Securities and Capital Markets
• Unexpected rise in stressed assets                                         Manager                    (India) Pvt. Ltd.; Nomura
• Competition especially from fintech companies                                                         Financial Advisory and
                                                                                                        Securities (India) Pvt. Ltd. and
Peer comparison and valuation: There is no listed peer in the domestic
                                                                                                        SBI Capital Markets Ltd.
market having similar nature of operations as SBI Cards. For valuation
benchmark, we have considered US based credit card companies. At the         Registrar                  Link Intime India Pvt. Ltd.
higher price band of Rs. 755 per share, SBI Card’s share is valued at a      Sector/Industry            NBFC
adjusted P/BV multiple of 15.6x (to its restated FY19 BVPS of Rs. 48.4) as   Promoters                  State Bank of India
compared to peer average of 2.7x.                                            Pre and post - issue shareholding pattern
                                                                                                           Pre - Issue      Post - Issue
Below are few key observations of the issue: (continued in next page)
                                                                             Promoter & Promoter
                                                                                                             74.00%           69.51%
Industry:                                                                    Group
• Credit cards, just like personal loan and consumer durable loans falls     Public                          26.00%           30.49%
   under unsecured loan category of retail credit market. According to       Total                          100.00%          100.00%
   Crisil Research, unsecured loan market in India expanded by around        Retail application money at higher cut-off price per lot
   28% CAGR over FY14-19 to reach at Rs. 5.3tn in FY19. Of these,            Number of Shares per Lot                   19
   personal loans and credit cards outstanding formed around 73% and         Discount for Eligible        Rs. 75 per Share on the Offer
   22%, respectively. Rest is consumer durables loans.                       Employees (Rs.)                           Price
• Over FY19-24E, the unsecured loan market is likely to grow at 22%          Application Money                  Rs. 14,345 per Lot
   CAGR to reach a size of Rs. 14.4tn. The key growth drivers are a
                                                                             Analyst
   steady rise in discretionary spending, increasing credit penetration,
                                                                             Rajnath Yadav
   increasing usage of alternative data sources such as payments &
   behavioral data in credit decision-making, a steady rise in organized     Research Analyst (022 - 6707 9999; Ext: 912)
   retail penetration and the strong growth of the e-commerce industry.      Email: rajnath.yadav@choiceindia.com
• According to Crisil Research, credit card outstanding is expected to grow at a fastest pace of 23% CAGR over the next five
   years to reach at Rs. 3.3tn in FY24E, driven by the low credit card penetration & credit card spending as percent of GDP,
   rising issuance of cards in smaller cities, increased credit demand from millennial, increasing organized retail penetration
   and growth in payments infrastructure. Personal and consumer durables loans are also expected to log a strong growth of
   20-22% and 19-21% over the next five years, respectively.
• There are total 74 players offering credit cards in India. Top four players i.e. HDFC Bank, SBI Card, ICICI Bank and Axis Bank
   dominate the market and hold a share of around 72% of the credit card outstanding in the market as on FY19. These players
   also have a market share of 66% in the total credit card spend in FY19. HDFC Bank in the market leader in both credit cards
   outstanding and card spending. Followed by SBI Card, which has a card outstanding market share of 18% and card spends
   market share of 17% in FY19.

                                                                                                                              1
Peer comparison and valuation (Contd…):
                                                                                       TTM Total
                                                       CMP            MCAP             Operating       TTM EBITDA        TTM PAT          TTM EBITDA TTM PAT
            Company Name                Currency
                                                       (Rs.)         (Rs. mn)           Revenue          (Rs. mn)        (Rs. mn)          Margin (%) Margin (%)
                                                                                        (Rs. mn)
SBI Cards and Payment Services Ltd.        INR         755.0         708,912             80,073            34,565         14,094            43.2%         17.6%
American Express Company                   USD         134.9         108,999             43,556            12,226         6,808             28.1%         15.6%
Discover Financial Services                USD          75.3          23,349             11,459            7,066          2,905             61.7%         25.4%
Synchrony Financial                        USD          33.3          20,448             17,170            9,105          3,775             53.0%         22.0%
Average                                                                                                                                     47.6%         21.0%
                                                    TTM EPS     BVPS     DPS       Total Asset      RoE      RoA       P/E         P/B     MCAP / Sales   Earning
            Company Name                 Currency
                                                      (Rs.)     (Rs.)    (Rs.)   Turnover Ratio     (%)       (%)       (x)         (x)       (x)         Yield (x)
SBI Cards and Payment Services Ltd.        INR        15.0      48.4      0.0          0.3         25.8%     4.7%      50.3        15.6       8.9           2.0%
American Express Company                   USD         8.4      28.5      1.6          0.2         29.4%     3.5%      16.0         4.7       2.5           6.2%
Discover Financial Services                USD         9.4      38.3      1.7          0.1         25.9%     2.7%      8.0          2.0       2.0          12.4%
Synchrony Financial                        USD         6.2      23.3      0.9          0.2         25.8%     3.5%      5.4          1.4       1.2          18.5%
Average                                                          1.4      0.2        27.1%         3.2%       9.8       2.7         1.9      12.4%           1.4
    Note: All financials and ratio based on FY19 data or TTM; Data in their respective currency; Source: Choice Broking Research

•    All credit card issuers are banks, while SBI Card and BoB Card are the only card issuers, who have a NBFC like structure.
     These two players have their sole focus on the credit card business which helps them to offer customized products to
     customers while enabling them to innovate and integrate various processes in the value chain. However, borrowing cost
     for such NBFCs are higher, unlike banks, due to a lack of availability of low cost funds like deposits.

Company:
• Over FY17-19, SBI Card has demonstrated highest growth in credit card outstanding among top four players. Its market
  share in card outstanding and card dues increased from 15% and 13%, respectively, in FY17 to 18% and 17% in FY19. The
  company is also able to continuously gain market share among the incremental credit card outstanding. For instance, it has
  a market share of 45% in the incremental card addition in the last one month, 27% market share in the past six months and
  around 23% in the past 12 months. The company has highest growth rate in the total card spends over FY17-19.
• Normally, 30% of the new accounts acquired by the credit card players are from open market. Rest is from Banca
  distribution channel. With 60% new accounts sourced from the open market channel, SBI card is the leader in open market
  card holder acquisition.
• The company caters to two categories of customers – personal and corporate customers. Under personal credit cards, it
  has developed a wide range of products ranging from premium, affluent, mass-affluent, mass and new to credit categories.
  Personal card formed around 99% of the total credit card outstanding, while in terms of card spend, it represented around
  72% of the total card spends in FY19.
• Under corporate card segment, SBI Card offers tailor made services to MNCs, large & mid-sized Indian companies, state
  owned enterprises and travel management companies. This category formed nearly 0.5% of the total credit card
  outstanding and around 30% of the total card spends in FY19. Due to ongoing global economic slowdown, currently,
  business from this category has slowed. This category is highly profitable and has relatively higher return on asset (RoA).
  With anticipated turnaround in the economy, this could assist the company in maintaining or expanding overall RoA.
• SBI Card has 18 co-branded partnerships, the highest in the industry compared to other players, followed by ICICI Bank at
  12 and RBL Bank at eight. In the travel & fuel category, SBI Card and ICICI Bank both have eight co-branded partnerships.
  Apart from partnerships with airline companies, they also have partnerships with metros and online hotel booking
  platforms. SBI Card is the only player who has a tie up with IRCTC which provides offers on railway ticket booking. The
  company has also tied up with Apollo Hospitals in the healthcare segment. Few of the co-branded partners are Air India,
  Apollo Hospitals, BPCL, Etihad Guest, Fbb, IRCTC, OLA Money, Yatra etc.
• The NBFC in SBI Card earns the interest income, while the payment service provider earns the fee income. The interest
  income is on the credit card receivables, while fee income i.e. non-interest income - comprises of fee-based income such as
  interchange fees, late fees, annual credit card membership fees and other fees. Within the non-interest income, spends
  based fees accounted for 53.5% followed by instance based fees (31.5%) and subscription based fees (15.1%) over FY17-19.
  Over FY17-19, non-interest income has expanded by 484bps from 39.5% (of total gross income) in FY17 to 44.3% in FY19.
  Increasing contribution of non-interest income is positive as it reduces the dependence on interest income, which is
  associated with interest rate volatility.
• Interest income will increase with the rollover of outstanding amount. Spends based fees is dependent on card spend and
  outstanding cards. Thus, the outlook for interest fees and spends based fees seems to be positive. While for instance based
  fees and subscription based fees, we have a neutral to negative view.

                                                                                                                        © CHOICE INSTITUTIONAL RESEARCH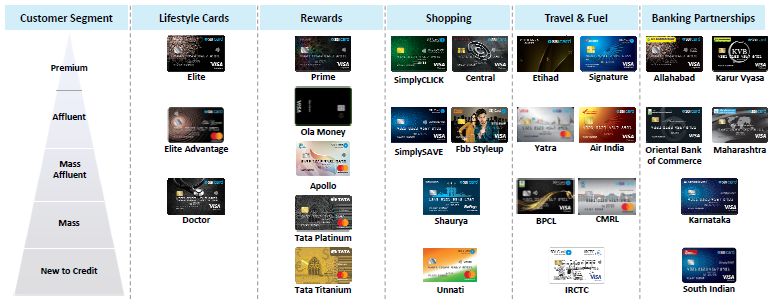
Peer comparison and valuation (Contd…):

Financial performance:
• Though the reported financials are of short period (i.e. from post demonetization), SBI Card has reported good set of
   numbers. On the back of 33.9% CAGR rise in net credit card advances and 31bps increase in the corresponding yield,
   interest income increased by 37.6% CAGR over FY17-19. To fund the growth in advances, the company reported 28.5%
   CAGR rise in the borrowings. Additionally, cost of debt increased by 72bps, thereby leading to 38.7% CAGR rise in finance
   cost over FY17-19. Thus net interest income increased by 37.2% CAGR to Rs. 25,585mn in FY19. Non-interest income
   increased by 53.2% CAGR, while other income increased by 51.8% CAGR over FY17-19. Accordingly, total income
   increased by 46% CAGR over FY17-19 to Rs. 62,696.2mn in FY19. Operating expenditure increased by 43.6% CAGR over
   FY17-19. Consequently, pre-provision profit increased by 49.9% CAGR to Rs. 24,793.4mn in FY19. Reported PAT increased
   by 52.1% CAGR to Rs. 8,627.2mn in FY19.
• Stressed assets during FY17-19 increased by 37.1% CAGR, whereas average gross NPA stood at 2.5% of total advances.
   Average net NPA stood at 0.9% over FY17-19. During the same period, provision coverage ratio stood over 67%. Capital
   adequacy ratio improved from 15.7% in FY17 to 20% in FY19. With high business growth and double digit net profit
   margin, average return on asset and return on equity stood at 4.5% and 29.3%, respectively.
• During 9M FY20, reported PAT stood at Rs. 11,612.1mn on a total income stood at Rs. 62,737.9. Considering the
   seasonality in the business, we are forecasting a total income of Rs. 90,632.8mn in FY20E and PAT of Rs. 12,833.1mn.
   Over FY19-22E, we are anticipating a 26.9% and 27.6% CAGR growth in total income and PAT, respectively. Earning and
   adjusted book value per share is expected at Rs. 19.2 and Rs. 87.7, respectively, in FY22E as compared to Rs. 9.2 and Rs.
   44.6 in FY19.

Key risk and concerns:
• On risk front, since the credit card receivables falls under unsecured lending, any spurt in stress among the customers will
   increase the credit risk for SBI Card. However, the company has desired underwriting scores and efficient collection
   mechanism, which would reduce the credit risk challenge.
• Another risk is from the regulatory front. Currently, interest rates charged by the credit card companies are not
   regulated. Rates are higher for revolver and term loan as compared to normal loan rates in the banking system.
   Interchange fees on credit cards in also not regulated. Moreover MDR is applicable on debit card and not on credit cards.
   Thus any move to regulate the sector will have severe impact on the performance. Competition is increasing from UPI.
   Further any move to allow other NBFCs to issue credit cards will enhance the competitive pressure on the sector.

Valuation:
On valuation front, at higher price brand SBI Card is demanding an adjusted P/B multiple of 15.6x, as compared to global
peer average of 2.7x. Based on FY22E adjusted P/B, it is demanding a valuation of 8.6x. We firmly believe that SBI Card is not
a pure play NBFC, so valuing it on P/E may also make sense. At higher price band, the company is demanding a P/E multiple
of 50.3x (to its restated TTM EPS of Rs. 15). Based on FY22E EPS, the demanded P/E comes out to be 39.4x.

Considering the credit card penetration level, growth potential in the domestic market and profitability growth & return
ratios, we feel that the demanded premium valuation is justified. Post listing, SBI Card will be the only pure play credit card
company on the exchange. Thus there is expected to be huge investor demand for SBI Card, which has niche product in the
consumer oriented business.

Thus, considering the above observations - we assign a “BUY” rating for the issue.

                                                                                              © CHOICE INSTITUTIONAL RESEARCH
About the issue:

•   SBI Cards is coming up with an initial public offering (IPO) with 137.15 - 137.19mn shares (fresh issue: 6.62 - 6.67; OFS
    shares: 130.53mn shares) in offering. The offer represents around 14.61% of its post issue paid-up equity shares of the
    company. Total IPO size is Rs. 102,895.1 - 103,547.7mn.

•   The issue will open on 02nd Mar. 2020 and close on 05th Mar. 2020. for QIB bidder, the offer closes on 04th Mar. 2020.

•   The issue is through book building process with a price band of Rs. 750 - 755 per share.

•   The issue is combination of fresh and OFS. The company will not receive any proceeds from OFS. Majority of the fresh
    issue net proceeds, will be utilize by the company to augment the capital base so as to meet the future capital
    requirement.

•   50% of the net issue shall be allocated on a proportionate basis to qualified institutional buyers, while rest 15% and 35%
    is reserved for non-institutional bidders and retail investors, respectively.

•   Promoter holds 74% stake in the company and post-IPO this will come down to 69.51%. Public holding will increase from
    current 26% to 30.49%.

                                                    Pre and post issue shareholding pattern (%)
                                                                       Pre Issue              Post Issue (at higher price band)
           Promoter & Promoter Group (%)                                   74.00%                          69.51%
           Public (%)                                                      26.00%                          30.49%
             Source: Choice Equity Broking

Indicative IPO process time line:

                                                                              Unblocking of
                              Offer Closes on
                                                                              ASBA Account
                               05-Mar-2020
                            (Note: For QIB bidder, the                        12-Mar-2020
                                 issue closes on
                                   04-03-2020)
    Offer Opens on                                       Finalization of                                                    Commencement
     02-Mar-2020                                         Basis of                                 Credit to Demat           of Trading
                                                         Allotment                                Accounts                  16-Mar-2020
                                                         11-Mar-2020                              13-Mar-2020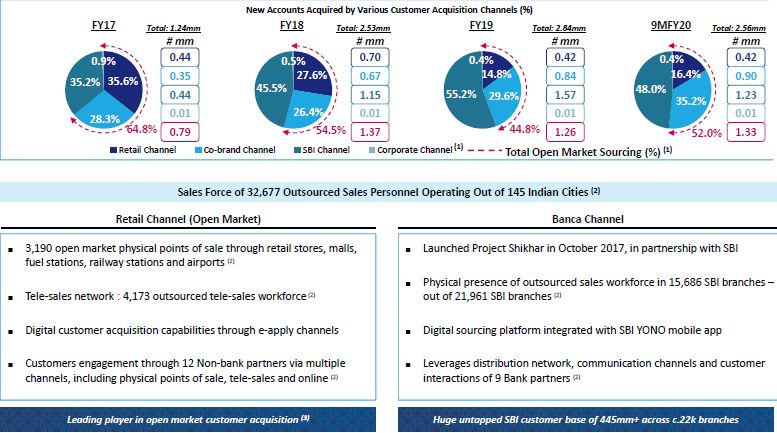
Company introduction:

SBI Cards is the second-largest credit card issuer in India, with a 17.6% and 18.1% market share in the Indian credit card
market in terms of the number of credit cards outstanding as of 31st Mar. 2019 and 30th Nov. 2019, respectively. Moreover,
in terms of credit card spending, the company had a market share of 17.1% and 17.9%, respectively. It offers an extensive
credit card portfolio to individual cardholders and corporate clients which includes lifestyle, rewards, travel and fuel,
shopping, banking partnership cards and corporate cards covering all major cardholder segments in terms of income profiles
and lifestyles.

           Source: Company Presentation

The company is a subsidiary of State Bank of India (SBI), India’s largest commercial bank in terms of deposits, advances and
number of branches. SBI Cards started its operations in 1998, and since then SBI’s parentage and highly trusted brand have
allowed it to quickly establish a reputation of trust, reliability and transparency with the cardholders. According to the RBI,
the company has grown its business faster than the Indian credit card market over the past three years both in terms of
numbers of credit cards outstanding and amounts of credit card spends. According to the company, this has been achieved
by leveraging its strengths and capitalizing on India’s favorable economic and demographic changes, including its strong
macroeconomic performance, rising affluence, increasing consumer demand, rapid urbanization and the growth of e-
commerce platforms.

During FY17-19, SBI Card’s total credit card spends grew at a 54.2% CAGR (as compared to a 35.6% CAGR for the overall
credit card industry) and the number of credit cards outstanding grew at a 34.5% CAGR (as compared to a 25.6% CAGR for
the overall credit card industry). The company has a broad credit card portfolio that includes SBI Card-branded credit cards
as well as co-branded credit cards that bear both the SBI Card brand and our co-brand partners’ brands. SBI Card offers four
primary SBI Card branded credit cards: SimplySave, SimplyClick, Prime and Elite, each catering to a varying set of cardholder
needs. It is also the largest co-brand credit card issuer in India and has partnerships with several major players in the travel,
fuel, fashion, healthcare and mobility industries, including Air India, Apollo Hospitals, BPCL, Etihad Guest, Fbb, IRCTC, OLA
Money and Yatra, among others. The company’s credit cards portfolio is tailored to meet a diverse range of cardholder
needs across the entire spectrum of its cardholders’ income profiles and lifestyles, from the “premium” cardholder category
to the “affluent”, “mass affluent”, “mass” and “new to credit” categories. SBI Card issues its credit cards in partnership with
the Visa, MasterCard and RuPay payment networks, and is continuously looking to expand its payment network partnerships
to broaden the reach and functionality of our credit card offerings.

    Source: Company Presentation
Company introduction (Contd…):
SBI Card has a diversified customer acquisition network that enables it to engage prospective customers across multiple
channels. As on 31st Dec. 2019, it had deployed a sales force of 32,677 outsourced sales personnel operating out in 145
Indian cities and which engages prospective customers through multiple channels, including physical points of sale in bank
branches, retail stores, malls, fuel stations, railway stations, airports, corporate parks and offices, as well as through tele-
sales, online channels, email, SMS marketing and mobile applications. According to Crisil Research, the company is the
leading player in open market customer acquisition in India and had presence in 3,190 open market points of sale across
India. Additionally, SBI Card’s partnership with SBI provides it with access to SBI’s extensive network of 21,961 branches
across India, which enables it to market credit cards to SBI’s vast customer base of 445.5mn customers as of 31st Dec. 2019.
Its extensive physical customer acquisition network is complemented by digital sales and marketing capabilities which
include its website, mobile application and online, email and SMS marketing platforms.
Source: Company Presentation
SBI Card’s business is technology-driven and underpinned by its data analytics capabilities, which cut across all aspects of the
operations. The company’s core technology systems are scalable, modern and sophisticated, with considerable capacity to
support future growth. It possess a large database of cardholder demographic and socio-economic data (such as
cardholder’s purchase patterns, behaviors and payment histories) derived from the numerous transactions carried out by
millions of cardholders each year, which the company analyzes to generate underwriting scorecards, proactively mitigate
risks, and reduce losses and delinquencies. SBI Card also employ its data analytics capabilities to more effectively market
credit cards to potential customers and to develop new product offerings. The company’s technology systems also leverage
artificial intelligence and process automation technologies to automate routine activities, such as customer service and
credit analysis, which has enhanced its operating efficiencies.
Business model: SBI Card’s operating model is focused on catering to credit cardholder’s two main financial needs:
transactional needs and short term credit. The revenue the company derives from its credit card products consists primarily
of interest on credit card receivables and non-interest income primarily comprised of fee-based income such as interchange
fees, late fees, annual credit card membership fees and other fees.
A typical credit card transaction begins when a cardholder purchases goods or services from a merchant using its credit card.
After the transaction is authorized by the credit card issuer through the payment network, the credit card issuer pays the
purchase amount to the payment network net of interchange fees. The payment network, in turn, then pays the purchase
amount to the acquirer. Finally, the acquirer pays the purchase amount to the merchant net of acquirer fees.Company introduction (Contd…):
The diagram below summarizes the key steps involved in a typical credit card transaction:
Source: Company Presentation
The company extends credit to its cardholders through revolving credit card accounts at standard terms. Its cardholders
have the option to “revolve” their balances or convert their balances into monthly installments and repay their obligations
over a period of time and at a fixed interest rate set forth in their cardholder agreements. The company assigns each card
account a credit limit when the account is initially opened. Thereafter, it may increase or decrease individual credit limits
from time to time, at its discretion, based primarily on evaluation of the cardholder’s creditworthiness and ability to pay. The
cardholder’s accounts are assessed periodic interest charges using a standard fixed interest rate. The interest that SBI Card
earns on revolving credit card balances and monthly installment balances comprised 51.1% and 51.0% of its total revenue
for FY19 and for 9M FY20, respectively.
SBI Card typically charges its cardholders an annual credit card fee for the credit cards. In addition to periodic interest
charges, the company also charges cardholders other fees as specified in the cardholder agreements. These fees may include
fees for late payments where a cardholder has not paid at least the minimum payment due by the required due date,
returned checks and balance transfer transactions. These fees are based on a standardized schedule and can vary based on
the type of merchant. Apart from interest and fees from cardholders, the company also receives interchange fees from the
merchant acquirer that settles its cardholder’s transactions with merchants and as business development incentives from
the payment networks. Non-interest income formed 48.9% and 49% of the total income for FY19 and for 9M FY20,
respectively.
Source: Company Presentation
Competition: SBI Card operates in a highly competitive environment, and faces competition in all aspects of its business
from numerous bank and non-bank providers of financial services. Its credit cards business competes with international and
national credit card issuers and, to a certain extent, issuers of debit cards. The company also encounter competition from
businesses that operate their own mobile wallets or extend credit to their customers and other fintech service providers. In
general, customers are attracted to credit card issuers largely on the basis of price, credit limit, reward programs and other
product features. It face intense competition for co-brand relationships, as both card issuer and network competitors have
targeted key business partners with attractive value propositions.Company introduction (Contd…):
Financial performance: On the back of 33.9% CAGR rise in net credit card advances and 31bps increase in the corresponding
yield, interest income increased by 37.6% CAGR over FY17-19. To fund the growth in advances, the company reported 28.5%
CAGR rise in the borrowings. Additionally, cost of debt increased by 72bps, thereby leading to 38.7% CAGR rise in finance
cost over FY17-19. Thus net interest income increased by 37.2% CAGR to Rs. 25,585mn in FY19. Non-interest income
increased by 53.2% CAGR, while other income increased by 51.8% CAGR over FY17-19. Total income increased by 46% CAGR
over FY17-19 to Rs. 62,696.2mn in FY19.
For the nine month ended Dec. 2019, interest income and interest expenses increased by 33% Y-o-Y and 30.1%, respectively,
thereby leading to a 34.1% Y-o-Y rise in net interest income to Rs. 25,267.1mn. Non-interest income and other income
increased by 36.3% Y-o-Y and 103.9%, respectively, as a result of which total income grew by 38.3% Y-o-Y to Rs. 62,737.9mn
in 9M FY20.
Operating expenditure increased by 43.6% CAGR over FY17-19. Consequently, pre-provision profit increased by 49.9% CAGR
to Rs. 24,793.4mn in FY19. During the 9M FY20, pre-provision operating profit increased by 56% Y-o-Y to Rs. 27,207.3mn.
Provisions increased by 46.9% CAGR during FY17-19, while the same increased by 38.4% Y-o-Y in 9M FY20. Reported PAT
increased by 52.1% CAGR to Rs. 8,627.2mn in FY19. However, reduction in corporate tax rate during 9M FY20, led to a 89%
Y-o-Y rise in PAT to Rs. 11,612.1mn.
Stressed assets during FY17-19 increased by 37.1% CAGR, whereas average gross NPA stood at 2.5% of total advances. Net
of provisions, average net NPA stood at 0.9% over FY17-19. During the same period, provision coverage ratio stood over
67%. Capital adequacy ratio improved from 15.7% in FY17 to 20% in FY19. With high business growth and double digit net
profit margin, average return on asset and return on equity stood at 4.5% and 29.3%, respectively.
(Rs. mn) FY17 FY18 FY19 9M FY19 9M FY20 CAGR (%) Y-o-Y (%) 9M Y-o-Y (%)
Total Income 29,426.1 46,586.8 62,696.2 45,361.1 62,737.9 46.0% 34.6% 38.3%
Pre-Provision Profit 11,035.9 17,194.0 24,793.4 17,435.3 27,207.3 49.9% 44.2% 56.0%
PAT 3,728.6 6,011.4 8,627.2 6,145.2 11,612.1 52.1% 43.5% 89.0%
Restated Adjusted EPS 4.0 6.4 9.2 6.5 12.4 52.1% 43.5% 89.0%
NIM (%) 15.3% 16.5% 15.5% 15.5% 15.6% 12 bps (97) bps 14 bps
GNPA (%) 2.3% 2.8% 2.4% 2.6% 2.5% 11 bps (23) bps 2 bps
NNPA (%) 0.8% 1.0% 0.8% 0.9% 0.8% 7 bps (8) bps 0 bps
Provision Coverage Ratio (%) 67.9% 67.3% 66.5% 67.3% 67.0% (142) bps (5) bps 47 bps
Net Advances (%) 40.7% 27.5% 38.8% (4,070) bps
Interest Earned (%) 46.2% 29.6% 33.0% (4,617) bps
Net Interest Income (%) 50.7% 24.9% 34.1% (5,065) bps
Pre-Provision Operating Profit (%) 55.8% 44.2% 56.0% (5,580) bps
PAT (%) 61.2% 43.5% 89.0% (6,122) bps
Yield on Advances (%) 21.3% 22.2% 21.6% 21.6% 21.5% 31 bps (59) bps (11) bps
Average Cost of Funds (%) 7.4% 7.2% 8.1% 8.1% 8.0% 72 bps 87 bps (12) bps
Net Interest Margin (%) 15.3% 16.5% 15.5% 15.5% 15.6% 12 bps (97) bps 14 bps
RoAA (%) 4.0% 4.5% 4.8% 4.7% 6.7% 79 bps 15 bps 190 bps
RoAE (%) 28.5% 31.0% 28.4% 27.7% 36.5% (7) bps (334) bps 811 bps
Restated Reported EPS (Rs.) 4.0 6.4 9.2 6.5 12.4 52.1% 43.5% 89.0%
Restated DPS (Rs.) 0.8 0.0 0.9 0.0 0.0 3.3%
Restated BVPS (Rs.) 15.4 25.1 38.1 36.4 50.6 57.2% 52.2% 38.9%
Restated ABVPS (Rs.) 14.6 23.6 36.5 34.8 48.4 58.1% 54.6% 39.1%
Source: Choice Equity BrokingCompetitive strengths:
• Second largest credit card issuer in India with deep industry expertise and a
demonstrated track record of growth and profitability
• Diversified customer acquisition capabilities
• Supported by a strong brand and pre-eminent promoter
• Diversified portfolio of credit card offerings
• Advanced risk management and data analytics capabilities
• Modern and scalable technology infrastructure
• Highly experienced and professional management team
Business strategy:
• Expand customer acquisition capabilities to grow cardholder base
• Tap into new cardholder segments by broadening portfolio of credit card
products
• Stimulate growth in credit card transaction volumes
• Continue to optimize risk management processes
• Enhance cardholder experience
• Continue leveraging technology across operations
Risk and concerns:
• Continued economic slowdown
• Change in government policies and regulations
• Unfavorable interest rate movements
• Unfavorable receivables portfolio-mix
• Unexpected rise in stressed assets
• Competition especially from fintech companies
© CHOICE INSTITUTIONAL RESEARCHFinancial statements:
Profit and loss statement (Rs. mn)
CAGR over Annual
9M Y-o-Y
FY17 FY18 FY19 9M FY19 9M FY20 TTM FY17 - 19 Growth over
(%)
(%) FY18 (%)
Interest Income 18,881.6 27,599.8 35,757.1 26,263.3 34,930.7 44,424.6 37.6% 29.6% 33.0%
Interest Expenses (5,284.3) (7,115.1) (10,172.1) (7,425.7) (9,663.7) (12,410.1) 38.7% 43.0% 30.1%
Net Interest Income 13,597.3 20,484.7 25,585.0 18,837.6 25,267.1 32,014.4 37.2% 24.9% 34.1%
Non-Interest Income 14,580.4 24,270.0 34,234.0 24,576.0 33,499.8 43,157.9 53.2% 41.1% 36.3%
Other Income 1,248.4 1,832.2 2,877.2 1,947.5 3,971.0 4,900.7 51.8% 57.0% 103.9%
Total Income 29,426.1 46,586.8 62,696.2 45,361.1 62,737.9 80,073.0 46.0% 34.6% 38.3%
Employee Benefits Expenses (953.1) (1,930.9) (3,904.0) (2,879.7) (3,344.5) (4,368.8) 102.4% 102.2% 16.1%
Operating and Other Expenses (17,318.7) (27,119.2) (33,045.9) (24,431.5) (31,412.1) (40,026.5) 38.1% 21.9% 28.6%
CSR Expenses (70.4) (97.8) (141.9) (33.6) (33.7) (141.9) 42.0% 45.1% 0.2%
Depreciation, Amortization and
(47.9) (244.9) (811.0) (581.1) (740.4) (970.3) 311.3% 231.1% 27.4%
Impairment
Pre-Provision Profit 11,035.9 17,194.0 24,793.4 17,435.3 27,207.3 34,565.5 49.9% 44.2% 56.0%
Provisions (5,319.7) (8,000.6) (11,477.4) (7,960.2) (11,020.6) (14,537.9) 46.9% 43.5% 38.4%
Profit Before Tax 5,716.2 9,193.4 13,316.0 9,475.1 16,186.7 20,027.6 52.6% 44.8% 70.8%
Tax Expenses (1,987.6) (3,182.0) (4,688.8) (3,330.0) (4,574.7) (5,933.5) 53.6% 47.4% 37.4%
PAT 3,728.6 6,011.4 8,627.2 6,145.2 11,612.1 14,094.1 52.1% 43.5% 89.0%
Balance sheet statement (Rs. mn)
CAGR over Annual
9M Y-o-Y
FY17 FY18 FY19 9M FY19 9M FY20 FY17 - 19 Growth over
(%)
(%) FY18 (%)
Equity Share Capital 7,850.0 7,850.0 8,372.2 8,372.2 9,323.3 3.3% 6.7% 11.4%
Other Equity 6,638.2 15,680.6 27,445.0 25,846.8 38,189.8 103.3% 75.0% 47.8%
Debt Securities 75,097.8 29,489.3 40,793.2 35,176.8 67,149.8 -26.3% 38.3% 90.9%
Borrowings (Other Than Debt Securities) 2,197.4 74,658.6 83,744.1 86,445.7 106,162.0 517.3% 12.2% 22.8%
Subordinated Liabilities 5,389.0 9,980.4 11,968.0 9,983.7 12,465.2 49.0% 19.9% 24.9%
Other Financial Liabilities 2,883.2 6,448.5 9,576.9 7,275.8 8,107.5 82.3% 48.5% 11.4%
Derivative Financial Instruments 28.5 1,095.4 2,222.9 322.8 3737.9% -85.5%
Payables (Financial Liabilities) 1,190.7 5,295.6 6,650.6 532.1 852.1 136.3% 25.6% 60.1%
Current Tax Liabilities (Net) 17.3 104.0 762.3 3.7 37.8 563.0% 632.8% 926.6%
Provisions 4,952.1 3,924.2 6,284.2 11,192.6 12,484.3 12.6% 60.1% 11.5%
Other Non Financial Liabilities 1,434.1 3,400.4 5,704.6 3,934.7 4,840.2 99.4% 67.8% 23.0%
Total Liabilities 107,649.8 156,860.1 202,396.4 190,986.9 259,934.7 37.1% 29.0% 36.1%
Cash and Bank Balances 2,829.5 4,726.8 7,767.8 6,006.0 5,077.7 65.7% 64.3% -15.5%
Receivables (Financial Assets) 1,324.8 1,507.3 2,950.2 1,549.1 1,772.7 49.2% 95.7% 14.4%
Advances (Net) 99,828.5 140,455.4 179,087.3 172,403.8 239,331.8 33.9% 27.5% 38.8%
Investments 0.0 0.0 14.6 14.6 14.6 3724.9% 146200.0% 0.0%
Other Financial Assets 24.7 1,139.2 307.1 552.3 294.9 252.6% -73.0% -46.6%
Deferred Tax Assets (Net) 1,292.0 880.1 1,665.1 1,082.4 1,373.7 13.5% 89.2% 26.9%
Property Plant and Equipment 16.6 418.6 575.4 463.3 571.8 489.3% 37.5% 23.4%
Intangible Assets 439.8 646.0 543.4 738.2 46.9% 35.8%
Capital Work in Progress 133.4 43.4 54.7 183.1 -67.5% 235.0%
Intangible Assets Under Development 217.2 158.3 153.5 146.2 -27.1% -4.7%
Right-of-Use Assets 221.9 1,559.2 1,642.8 1,547.9 1,711.0 172.1% 5.4% 10.5%
Other Non Financial Assets 2,111.8 5,383.1 7,538.3 6,615.8 8,718.9 88.9% 40.0% 31.8%
Total Assets 107,649.8 156,860.1 202,396.4 190,986.9 259,934.7 37.1% 29.0% 36.1%
Source: Choice Equity Broking
© CHOICE INSTITUTIONAL RESEARCHFinancial statements:
Cash flow statement (Rs. mn)
Annual
CAGR over 9M Y-o-Y
Particulars (Rs. mn) FY17 FY18 FY19 9M FY19 9M FY20 Growth over
FY17 - 19 (%) (%)
FY18 (%)
Profit Before Tax 5,716.2 9,193.4 13,316.0 9,475.1 16,186.7 52.6% 44.8% 70.8%
Cash Flow Before Working Capital Changes 16,341.7 24,490.4 35,568.4 25,229.9 36,044.6 47.5% 45.2% 42.9%
Change in Working Capital (30,282.0) (43,761.6) (45,483.2) (37,288.3) (70,804.1) 22.6% 3.9% 89.9%
Cash Flow from Operating Activities (22,348.8) (28,770.9) (23,649.4) (22,435.1) (48,654.5) 2.9% -17.8% 116.9%
Cash Flow from Investing Activities (8.4) (314.9) (723.9) (398.0) (567.3) 826.1% 129.9% 42.5%
Cash Flow from Financing Activities 22,442.3 29,349.0 27,414.3 24,112.4 46,531.8 10.5% -6.6% 93.0%
Net Cash Flow 85.1 263.2 3,041.0 1,279.3 (2,690.0) 497.9% 1055.2% -310.3%
Opening Balance of Cash and Bank Balances 2,744.4 4,463.5 4,726.8 4,726.8 7,767.8 31.2% 5.9% 64.3%
Closing Balance of Cash and Bank Balances 2,829.5 4,726.8 7,767.8 6,006.0 5,077.7 65.7% 64.3% -15.5%
Financial ratios
Particulars (Rs. mn) FY17 FY18 FY19 9M FY19 9M FY20
Growth ratios
Net Advances (%) 40.7% 27.5% 38.8%
Interest Earned (%) 46.2% 29.6% 33.0%
Net Interest Income (%) 50.7% 24.9% 34.1%
Pre-Provision Operating Profit (%) 55.8% 44.2% 56.0%
PAT (%) 61.2% 43.5% 89.0%
Return / Profitability ratios
Yield on Advances (%) 21.3% 22.2% 21.6% 21.6% 21.5%
Average Cost of Funds (%) 7.4% 7.2% 8.1% 8.1% 8.0%
Net Interest Margin (%) 15.3% 16.5% 15.5% 15.5% 15.6%
RoAA (%) 4.0% 4.5% 4.8% 4.7% 6.7%
RoAE (%) 28.5% 31.0% 28.4% 27.7% 36.5%
Operating ratios
Non-Interest Income to Total Income (%) 42.0% 45.2% 47.0% 46.6% 46.3%
Opex to Total Income Ratio (%) 62.5% 63.1% 60.5% 61.6% 56.6%
Capitalization ratios
Tier-1 CAR (%) 11.3% 12.4% 14.7% 15.3% 15.4%
Tier-2 CAR (%) 4.4% 5.9% 5.3% 4.1% 3.8%
Total CAR (%) 15.7% 18.3% 20.0% 19.4% 19.2%
Equity / Assets (%) 13.5% 15.0% 17.7% 17.9% 18.3%
Loans / Assets (%) 92.7% 89.5% 88.5% 90.3% 92.1%
Dividend Payout Ratio (%) 21.1% 0.0% 9.7% 0.0% 0.0%
Asset quality ratios
GNPA (Rs. mn) 2,409.0 4,125.0 4,529.5 4,651.2 6,117.0
GNPA (%) 2.3% 2.8% 2.4% 2.6% 2.5%
NNPA (Rs. mn) 773.3 1,347.6 1,518.2 1,521.8 2,021.3
NNPA (%) 0.8% 1.0% 0.8% 0.9% 0.8%
Provision Coverage Ratio (%) 67.9% 67.3% 66.5% 67.3% 67.0%
Per share data
Restated Reported EPS (Rs.) 4.0 6.4 9.2 6.5 12.4
Restated DPS (Rs.) 0.8 0.0 0.9 0.0 0.0
Restated BVPS (Rs.) 15.4 25.1 38.1 36.4 50.6
Restated ABVPS (Rs.) 14.6 23.6 36.5 34.8 48.4
Valuation ratios
P/E (x) 190.1 117.9 82.2 115.4 61.0
P/BVPS (x) 48.9 30.1 19.8 20.7 14.9
P/ABVPS (x) 51.7 32.0 20.7 21.7 15.6
Note: Ratios calculated on pre-issue data; Source: Company RHP
© CHOICE INSTITUTIONAL RESEARCHDisclaimer
This is solely for information of clients of Choice Broking and does not construe to be an investment advice. It is also not
intended as an offer or solicitation for the purchase and sale of any financial instruments. Any action taken by you on the
basis of the information contained herein is your responsibility alone and Choice Broking its subsidiaries or its employees or
associates will not be liable in any manner for the consequences of such action taken by you. We have exercised due
diligence in checking the correctness and authenticity of the information contained in this recommendation, but Choice
Broking or any of its subsidiaries or associates or employees shall not be in any way responsible for any loss or damage that
may arise to any person from any inadvertent error in the information contained in this recommendation or any action
taken on basis of this information. This report is based on the fundamental analysis with a view to forecast future price. The
Research analysts for this report certifies that all of the views expressed in this report accurately reflect his or her personal
views about the subject company or companies and its or their securities, and no part of his or her compensation was, is or
will be, directly or indirectly related to specific recommendations or views expressed in this report. Choice Broking has
based this document on information obtained from sources it believes to be reliable but which it has not independently
verified; Choice Broking makes no guarantee, representation or warranty and accepts no responsibility or liability as to its
accuracy or completeness. The opinions contained within the report are based upon publicly available information at the
time of publication and are subject to change without notice. The information and any disclosures provided herein are in
summary form and have been prepared for informational purposes. The recommendations and suggested price levels are
intended purely for stock market investment purposes. The recommendations are valid for the day of the report and will
remain valid till the target period. The information and any disclosures provided herein may be considered confidential. Any
use, distribution, modification, copying, forwarding or disclosure by any person is strictly prohibited. The information and
any disclosures provided herein do not constitute a solicitation or offer to purchase or sell any security or other financial
product or instrument. The current performance may be unaudited. Past performance does not guarantee future returns.
There can be no assurance that investments will achieve any targeted rates of return, and there is no guarantee against the
loss of your entire investment.
POTENTIAL CONFLICT OF INTEREST DISCLOSURE (as on date of report) Disclosure of interest statement – • Analyst
interest of the stock /Instrument(s): - No. • Firm interest of the stock / Instrument (s): - No.
+91-022-6707 9999 www.choicebroking.in +91-022-6707 9959
Choice Equity Broking Pvt. Ltd.
Choice House, Shree Shakambhari Corporate Park, Plot No: -156-158,
J.B. Nagar, Andheri (East), Mumbai - 400 099.You can also read