Sugar and Sweeteners Outlook: January 2023
←
→
Page content transcription
If your browser does not render page correctly, please read the page content below
Economic Research Service | Situation and Outlook Report

                          SSS-M-413 | January 19, 2023                  Next release is February 14, 2023

 Sugar and Sweeteners                                                               In this report:

 Outlook: January 2023                                                              U.S. Sugar Outlook
                                                                                    Mexico Sugar Outlook
                                                                                    Special Article: Trends in
 Vidalina Abadam, coordinator                                                       U.S. Sweetener
                                                                                    Deliveries
                                                                                    Special Article: Trends in
                                                                                    Estimated Sweeteners in
                                                                                    Imported and Exported
                                                                                    Products

  Increased Production Raises U.S. Sugar
  Supply; Mexican Campaign Progressing Slowly
  In the January 2023 World Agricultural Supply and Demand Estimates (WASDE), the 2022/23
  U.S. total sugar supply is increased from last month to 14.525 million STRV, as the combined
  increase in beet sugar and Louisiana cane sugar production forecasts offset the reduction in
  total imports. Total imports are reduced from last month as the projected decrease in sugar
  imported under the World Trade Organization (WTO) raw sugar tariff-rate quota (TRQ) offsets
  the projected increase in high-tier duty sugar. With total use forecast unchanged at 12.640
  million STRV, ending stocks are increased to 1.885 million STRV, up by 178,000 from last
  month and by 66,000 from 2021/22. This translates to an ending stocks-to-use ratio of 14.9
  percent, which is higher by 1.4 percentage points than last month’s 13.5 percent and by 0.6
  percentage points from last year’s 14.3 percent.

  The 2022/23 Mexican supply and use balance sheet is unchanged from last month, except for
  a slight increase in exports to countries other than the United States. The 5.9 million-MT sugar
  production is carried over from last month, but notable is the slower-than-average pace of this
  year’s campaign.

Approved by USDA’s World Agricultural Outlook Board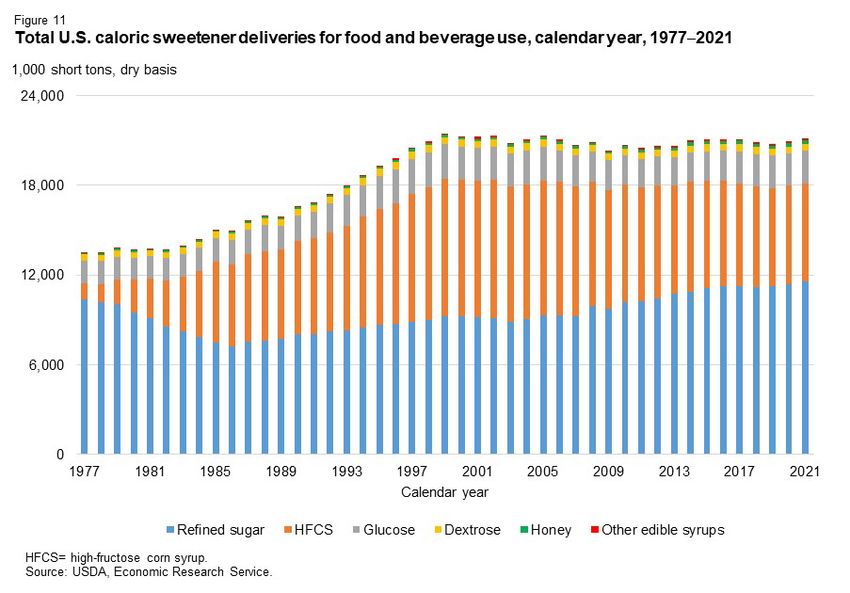
U.S. Outlook Summary
U.S. Sugar Supply Increased
In the January 2023 WASDE, the 2022/23 U.S. total sugar supply is increased from last month
by 178,000 short tons, raw value (STRV) to 14.525 million as the 209,000-STRV combined
increase in beet sugar and Louisiana cane sugar production forecasts offset the 35,000-STRV
reduction in total imports (table 1). As such, total supply would be relatively close to last years’
14.506 million STRV.

Beet sugar production is raised 121,000 STRV to 5.048 million on higher-than-expected
sucrose recovery based on actual production data through November reported in the USDA,
Farm Service Agency Sweetener Market Data (SMD). The effect of the higher sucrose recovery
offsets the projected reduction of sugarbeet production in the National Agricultural Statistics
Service (NASS) January Crop Production Annual Summary. Louisiana cane sugar production is
raised 88,000 STRV to 2.112 million, thereby overtaking last year’s sugar production to set a
new record high for the State and marking another milestone of surpassing Florida for a second
consecutive year.

Total imports in 2022/23 are reduced from last month by 35,000 STRV to 3.458 million as the
projected 86,000-STRV decrease in sugar imported under the WTO raw sugar TRQ offsets the
projected 50,000-STRV increase in high-tier duty sugar. Aside from a slight increase in sugar
under free trade agreement (FTA) TRQ, there are no other changes to the rest of the import
categories, including Mexico.

With total use forecast unchanged at 12.640 million STRV, ending stocks are increased to
1.885 million STRV, up by 178,000 from last month and by 66,000 from 2021/22. This
translates to an ending stocks-to-use ratio of 14.9 percent, which is higher by 1.4 percentage
points than last month’s 13.5 percent and by 0.6 percentage points from last year’s 14.3
percent.

                                                  2
               Sugar and Sweeteners Outlook: January 2023, SSS-M-413, January 19, 2023
                                 USDA, Economic Research Service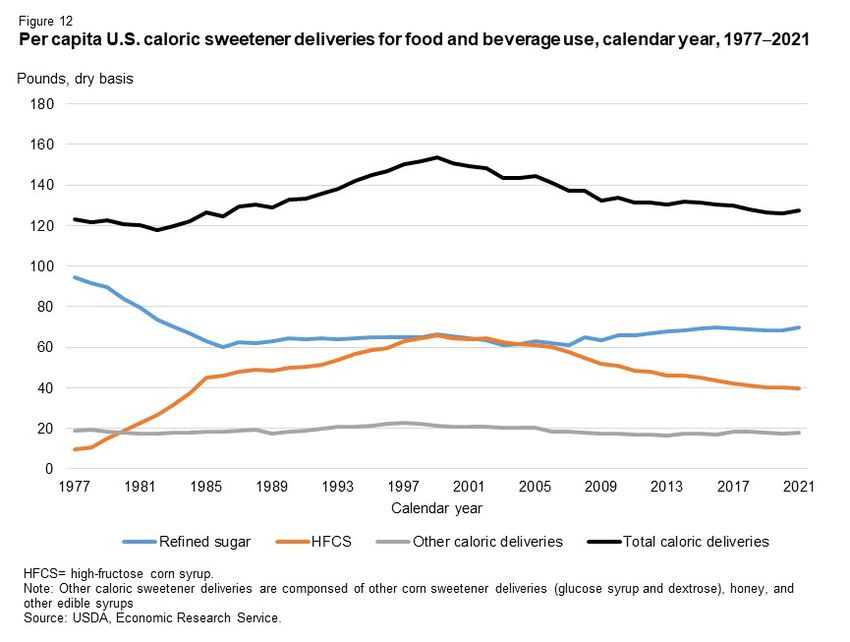
Table 1: U.S. sugar: supply and use by fiscal year (October/September), January 2023
Items                                                 2020/21                 2021/22                                2022/23
                                                         Final   December       January     Monthly    December         January    Monthly
                                                                 (estimate)   (estimate)    change      (forecast)    (forecast)   change
                                                                                      1,000 short tons raw value
Beginning stocks                                         1,618       1,705        1,705            0        1,814         1,819         4

Total production                                         9,233       9,136        9,156          19         9,039         9,248       209
 Beet sugar                                              5,092       5,155        5,155           0         4,927         5,048       121
 Cane sugar                                              4,141       3,981        4,000          19         4,111         4,199        88
   Florida                                               2,090       1,933        1,933           0         1,989         1,989         0
   Louisiana                                             1,918       1,924        1,944          19         2,025         2,113        88
   Texas                                                   134         124          124           0            97            97         0

Total imports                                            3,221       3,646        3,646           0         3,494         3,458        -35
 Tariff-rate quota imports                               1,749       1,579        1,579           0         1,691         1,606        -85
 Other program imports                                     292         298          298           0           250           250          0
 Non-program imports                                     1,180       1,769        1,769           0         1,552         1,602         50
   Mexico                                                  968       1,379        1,379           0         1,477         1,477          0
   High-duty                                               212         390          390           0            75           125         50

Total supply                                            14,072      14,487       14,506          19       14,347        14,525        178

Total exports                                               49          29           29           0            35            35         0

Miscellaneous                                               40          66           81          15             0             0         0

Total deliveries                                        12,277      12,578       12,578           0       12,605        12,605          0
 Domestic food and beverage use                         12,161      12,470       12,470           0       12,500        12,500          0
 To sugar-containing products re-export program             89          80           80           0           80            80          0
 For polyhydric alcohol, feed, other alcohol                27          27           27           0           25            25          0
 Commodity Credit Corporation (CCC) for ethanol              0           0            0           0            0             0          0

Total use                                               12,367      12,673       12,688          15       12,640        12,640          0

Ending stocks                                            1,705       1,814        1,819           4         1,707         1,885       178
Private                                                  1,705       1,814        1,819           4         1,707         1,885       178
Commodity Credit Corporation                                 0           0            0           0             0             0         0

Stocks-to-use ratio (percent)                              13.8          14.3       14.3         0.0         13.5          14.9        1.4
Source: USDA, World Agriculural Outlook Board, World Agricultural Supply and Demand Estimates (WASDE) .

Beet Sugar Production Raised
Beet sugar production in fiscal year 2022/23 is raised from last month by 121,000 STRV to
5.048 million as the increase in the projected sucrose recovery more than offsets the reduction
in sugarbeet production reported in the January 12 NASS Crop Production Annual Summary
(table 2). If realized, this would still denote a 107,000-STRV decrease (2 percent) from last
year’s 5.155 million.

The sucrose recovery is raised to 15 percent from last month’s 14.646 percent based on the
actual August to November production data in the SMD. The effect of the higher sucrose
recovery offsets the projected reduction of sugarbeet production in the NASS January Crop
Production Annual Summary. The SMD shows a cumulative rate of 15.26 percent, the highest
                                                        3
                     Sugar and Sweeteners Outlook: January 2023, SSS-M-413, January 19, 2023
                                       USDA, Economic Research Service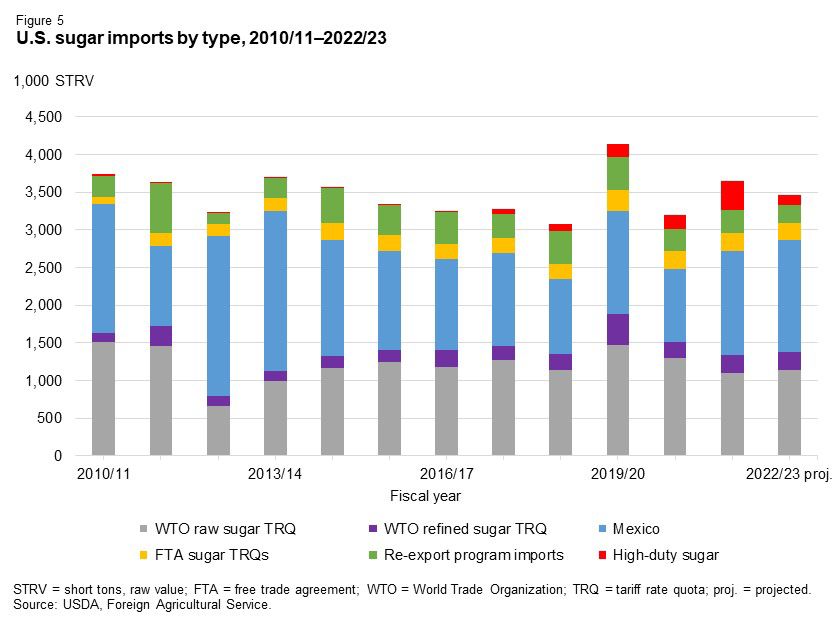
for August–November since 2012/13 (figure 1). So far, the cold weather has been sufficient in
helping to keep the outside beet piles cool.

Table 2: Beet sugar production calculations, 2019/20‒2020/23
                                                                 2020/21    2021/22      2021/22    Monthly  2022/23        2022/23    Monthly
                                                                    Final December       January    change December         January    change
Sugarbeet production (1,000 short tons) 1/                        33,610     36,751       36,751          0   33,462         32,574      -888
Sugarbeet shrink (percent)                                          6.60        7.9          7.9        0.0      9.5            6.8       -2.6
Sugarbeet sliced (1,000 short tons)                               31,392     33,850       33,850          0   30,299         30,348         49
Sugar extraction rate from slice (percent)                         15.34      14.63        14.63          0    14.63          15.00      0.37
Sugar from beets sliced (1,000 STRV) 2/                            4,817      4,954        4,954          0    4,431          4,552       121
Sugar from molasses (1,000 STRV) 2/                                  362        341          341          0      360            360          0
Crop year sugar production (1,000 STRV) 2/                         5,181      5,294        5,294          0    4,791          4,912       121
Aug.–Sep. sugar production (1,000 STRV)                              765        676          676          0      537            537          0
Aug.–Sep. sugar production of subsequent crop (1,000 STRV)           676        537          537          0      643            643          0
Sugar from imported beets (1,000 STRV) 3/                            N/A        N/A          N/A       N/A        30             30          0
Fiscal year sugar production (1,000 STRV)                          5,092      5,155        5,155          0    4,927          5,048       121
STRV = short tons, raw value; NA = not applicable.
1/ USDA, National Agricultural Statistics Service.
2/ August–July.
3/ Sugar from imported beets in 2020/21 and 2021/22 are already included in the crop year production. Typically, this component is separated
for projections and included in total once full crop year slice is available.
Source: USDA, Economic Research Service; USDA, World Agricultural Outlook Board; USDA, Farm Service Agency.

The reduction in crop year 2022/23 NASS sugarbeet production is driven by the lowered
expectations for both area harvested and yield. National area harvested is reduced from last
month by 12,000 acres to 1.137 million, but this nonetheless still represents the second largest
area harvested since 2017/18. The largest declines are seen in the Upper Midwest (7,000

                                                      4
                   Sugar and Sweeteners Outlook: January 2023, SSS-M-413, January 19, 2023
                                     USDA, Economic Research Service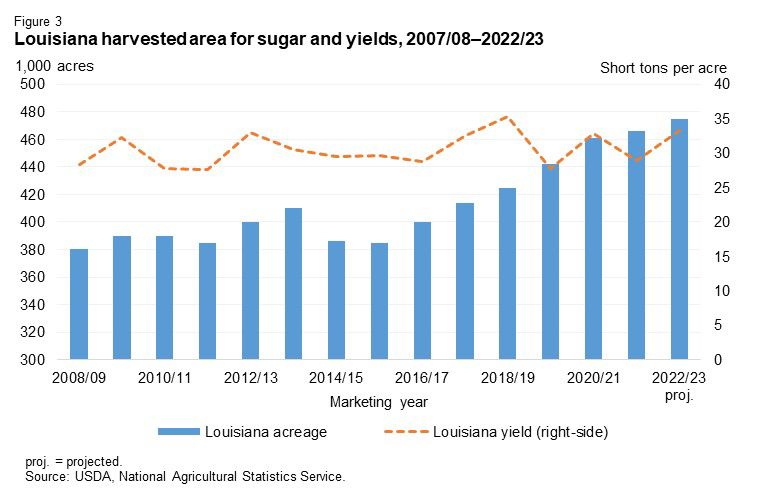
acres) and Southwest (6,200) counteracting the slight increases in Great Lakes (1,000) and
Great Plains (300) (table 3).

Table 3: U.S. sugar beet area harvested, yield, and production, by region
                                                                                                 November    January     Monthly     Monthly
                                     2017/18      2018/19     2019/20     2020/21     2021/22     2022/23    2022/23     change       change
Area harvested by region (1,000 acres)                                                                                              (percent)
Great Lakes (MI)                        143.0       148.0       145.0        154.0       142.0       137.0     138.0          1.0         0.7
Upper Midwest (MN, ND)                  621.0       607.0       507.0        647.0       618.0       687.0     680.0         -7.0        -1.0
Great Plains (CO, MT, NE, WY)           148.5       142.7       126.9        138.1       141.5       121.2     121.5          0.3         0.2
Northwest (ID, OR, WA)                  176.9       174.1       176.8        179.3       183.2       180.0     179.9         -0.1        -0.1
Southwest (CA)                           24.4        24.6        24.4         23.4        23.7        23.9      17.7         -6.2       -25.9
United States                         1,113.8     1,096.4       980.1      1,141.8     1,108.4     1,149.1   1,137.1        -12.0        -1.0

Yield by region (short tons per acre)
Great Lakes (MI)                          25.2       29.1         28.6        28.3        37.4        30.5      28.8         -1.7        -5.6
Upper Midwest (MN, ND)                    30.5       26.7         25.3        25.7        30.4        25.8      25.8          0.0         0.0
Great Plains (CO, MT, NE, WY)             32.0       31.6         28.7        30.8        31.0        27.9      27.8         -0.1        -0.4
Northwest (ID, OR, WA)                    39.2       40.5         39.0        40.6        39.5        39.0      38.0         -1.0        -2.7
Southwest (CA)                            43.7       48.8         45.4        46.6        45.4        46.7      45.8         -0.9        -1.9
United States                             31.7       30.4         29.2        29.4        33.2        29.1      28.6         -0.5        -1.6

Production by region (1,000 short tons)
Great Lakes (MI)                         3,604      4,307       4,147       4,358       5,311       4,179      3,974        -205        -4.9
Upper Midwest (MN, ND)                  18,960     16,217      12,845      16,625      18,758      17,756     17,576        -180        -1.0
Great Plains (CO, MT, NE, WY)            4,759      4,503       3,647       4,258       4,391       3,386      3,380          -6        -0.2
Northwest (ID, OR, WA)                   6,928      7,055       6,903       7,279       7,232       7,025      6,833        -192        -2.7
Southwest (CA)                           1,066      1,200       1,108       1,090       1,076       1,116        811        -305       -27.3
United States                           35,317     33,282      28,650      33,610      36,768      33,462     32,574        -888        -2.7
CA = California, CO = Colorado, ID = Idaho, MI = Michigan, MN = Minnesota, MT = Montana, NE = Nebraska, ND = North Dakota, OR = Oregon, WA =
Washington, WY = Wyoming.
Source: USDA, National Agricultural Statistics Service.

National yield in crop year 2022/23 is down from last month by 0.5 tons per acre to 28.6, the
lowest since 2017/18. Except in the Upper Midwest where it is mostly unchanged, yield in all
regions is down. The largest over-the-month reduction is in Michigan (1.7 ton per acre or 5.6
percent), followed by Northwest (1 ton per acre or 2.7 percent). The late start to the April spring
planting negatively affected yields this season. Planting was delayed by almost a month–the
latest in history for some areas–due to wet, cold weather, thereby shortening the time for
sugarbeets to grow.

With the increase in sucrose recovery outweighing the decreases in area harvested and yield,
crop year 2022/23 sugarbeet production is adjusted to 32.574 million short tons, up 888,000
from last month. Using a revised shrink of 6.8 percent, which is based on the beet processors
reporting to SMD, the resulting estimate for sugarbeets sliced is 30.348 million short tons, up
49,000 from last month. This amount is multiplied by the higher 15-percent-sucrose recovery, to
derive the 2022/23 crop year sugar production of 4.552 million STRV.

                                                       5
                    Sugar and Sweeteners Outlook: January 2023, SSS-M-413, January 19, 2023
                                      USDA, Economic Research Service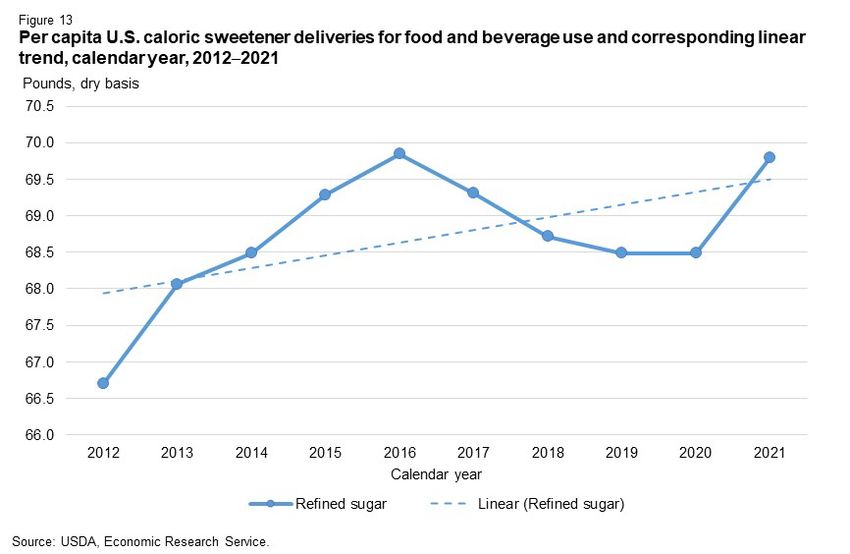
The expected sugar production from molasses (360,000 STRV) is unchanged from last month
and is added to the 4.552 million STRV resulting in a crop year 2022/23 production of 4.912
million. This represents a 112,000-STRV increase from last month’s 4.780 million STRV but
would still be the second lowest crop year sugar production in the last 8 years behind the
2019/20 crop that was severely affected by weather.

Subtracting the actual sugar production from August–September 2022 (537,000 STRV) and
adding both the projected sugar production from the August–September 2023 early season
(643,000) and from imported sugarbeets (30,000), which are all unchanged from last month,
results in a 5.048-million-STRV fiscal year equivalent. If realized, would be 107,000-STRV lower
than last year’s 5.155 million.

Louisiana Increases Cane Sugar Production in 2021/22 and
2022/23
Louisiana cane sugar production in both fiscal year 2021/22 and 2022/23 are increased from
last month. The former is due to a 19,000-STRV upward adjustment in September 2022 that
arises from processor finalization of SMD reporting. This increased the 2021/22 fiscal year cane
sugar production by the same amount to 1.933 million. This marks a milestone: Louisiana has
produced more sugar than Florida for the first time since fiscal year 2002/03 (figure 2).

The 2022/23 crop year cane sugar production for Louisiana is up from last month by 88,000
STRV to 2.113 million mostly due to the increased NASS forecast of crop year 2022/23
sugarcane production for sugar in the State. This is a function of NASS increasing its projected
area harvested and yield from last month to 475,000 acres and 33.3 tons per acre, respectively,
the former setting a record high reflecting the continued area expansion in the State (figure 3). If
realized, the 2.113-million STRV represents a 169,000-STRV increase (9 percent) from
2021/22, thereby overtaking last year’s sugar production to set a new record high for the State
and marking another milestone of surpassing Florida for a second year in a row.

                                                  6
               Sugar and Sweeteners Outlook: January 2023, SSS-M-413, January 19, 2023
                                 USDA, Economic Research Service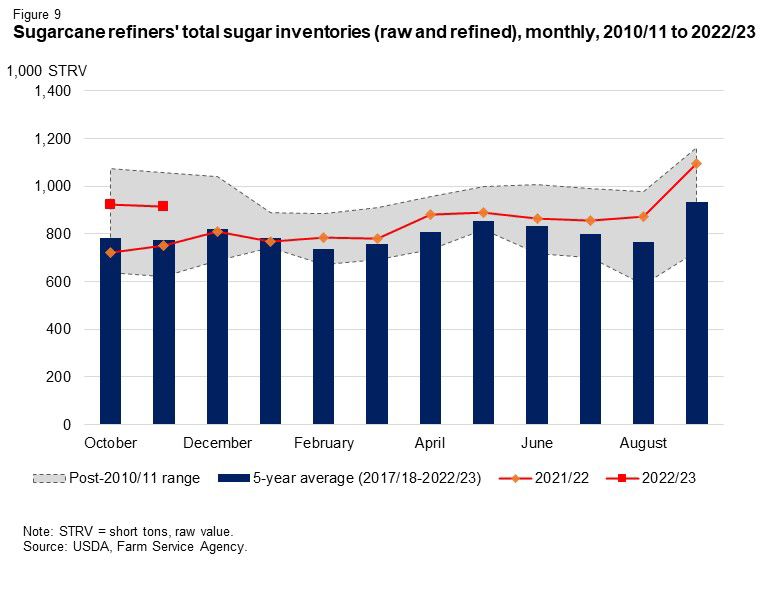
In addition, a slight part of the fiscal year 2022/23 increase (about 5,000 STRV out of the total
88,000 STRV) is due to the September 2022 revision which falls in the crop year 2022/23
                                                 7
              Sugar and Sweeteners Outlook: January 2023, SSS-M-413, January 19, 2023
                                USDA, Economic Research Service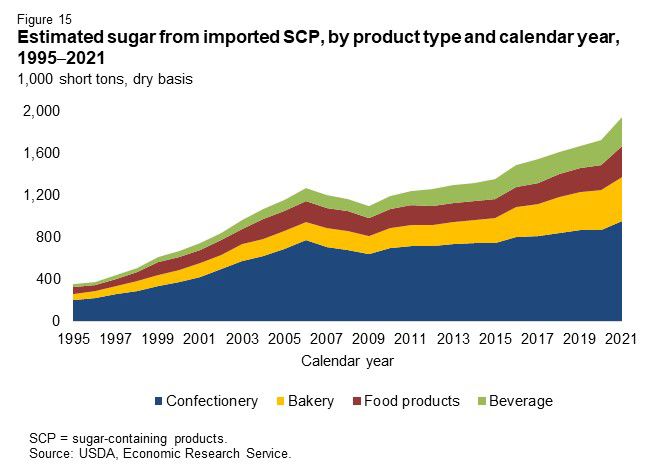
period. Since Louisiana’s crop cycle typically starts in September–in contrast with the October
start date in Florida and Texas–this month’s actual production is subtracted from the crop year
production and is included in creating a forecast for the next September production which is
added to convert to a fiscal year basis. Thus, any September revision affects the subsequent
fiscal year in the State.

The larger forecast for Louisiana cane sugar production comes during the ongoing impact
assessment of the multi-day severe freeze during the last two weeks of December. During the
freeze event, the U.S. National Weather Service data showed temperatures in the Lafayette
Region dropped to an average low of 25.5 degrees Fahrenheit on December 23, which is
significantly lower than the normal daily minimum average recorded between 1991–2020 (figure
4). According to the Louisiana State University (LSU) AgCenter’s report that was published the
Louisiana Farm Bureau News website on December 21, a major concern was about rising
temperatures immediately after. When temperatures rise, freeze-affected sugarcane plants
deteriorate faster, thereby reducing the amount of recoverable sugar. This is exactly what
happened; the average daily temperature rose above 65 degrees Fahrenheit, which is also
above the normal daily maximum average recorded between 1991–2020. The freeze could
have negative effects on the sugarcane that is scheduled to be harvested next year.

But by the time the freeze started on December 23, growers were reportedly about 83 percent
harvested, according to the same LSU report. A fuller assessment is expected after all the mills
have ended their campaigns before the end of January.

Given the relatively small NASS changes for Florida and Texas, both State’s 2022/23 fiscal year
cane sugar production remain the same–1.989 million STRV and 97,000 STRV, respectively.
As such, the total cane sugar production in the U.S. is increased from last month, solely on
Louisiana’s account, by 88,000 STRV to 4.199 million, representing a 199,000 STRV over-the-
year increase (5 percent) and toppling the prior record high of 4.142 million STRV set in
2020/21 by 57,000 (1 percent).

                                                  8
               Sugar and Sweeteners Outlook: January 2023, SSS-M-413, January 19, 2023
                                 USDA, Economic Research Service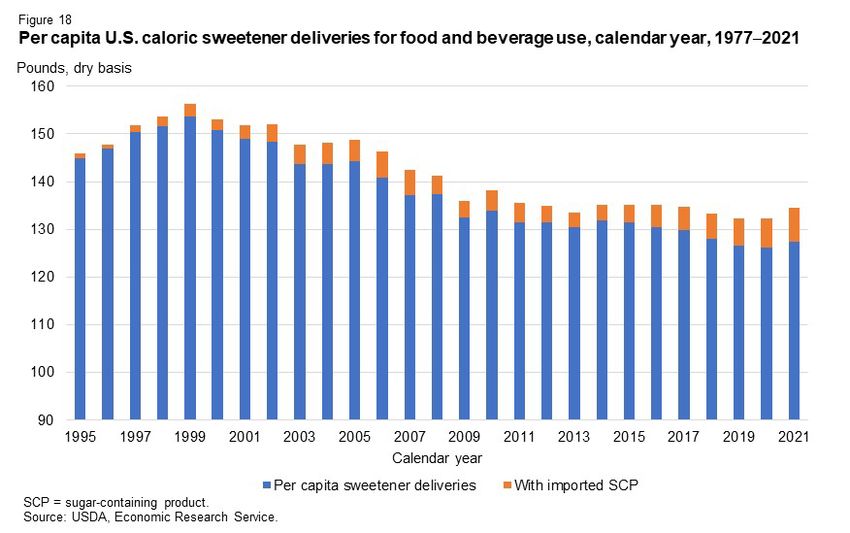
Total Imports Adjusted Downward; High-tier Imports Raised
Total imports in 2022/23 are reduced from last month by 35,000 STRV to 3.458 million as the
projected decrease in sugar imported under the WTO raw sugar TRQ offsets the projected
increase in high-tier duty sugar (figure 5). Aside from a slight increase in sugar under the FTA
TRQ, the rest of the import categories are unchanged, including Mexico.

The raw sugar TRQ is reduced from last month by 86,000 STRV to 1.141 million. This is
primarily due to the lower-than-expected entry of sugar imports under the 2021/22 TRQ quota
that were granted an extension entry through December 31. Meanwhile, the FTA TRQ, which
is based on a calendar year, was slightly revised upward by 463 STRV to 223,000 as 2022
ends.

                                                 9
              Sugar and Sweeteners Outlook: January 2023, SSS-M-413, January 19, 2023
                                USDA, Economic Research Service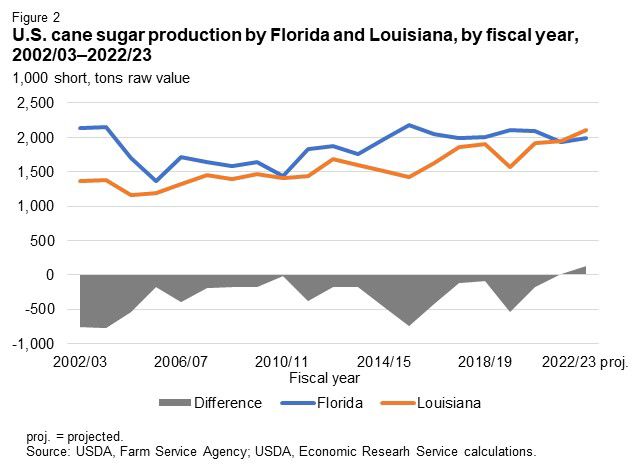
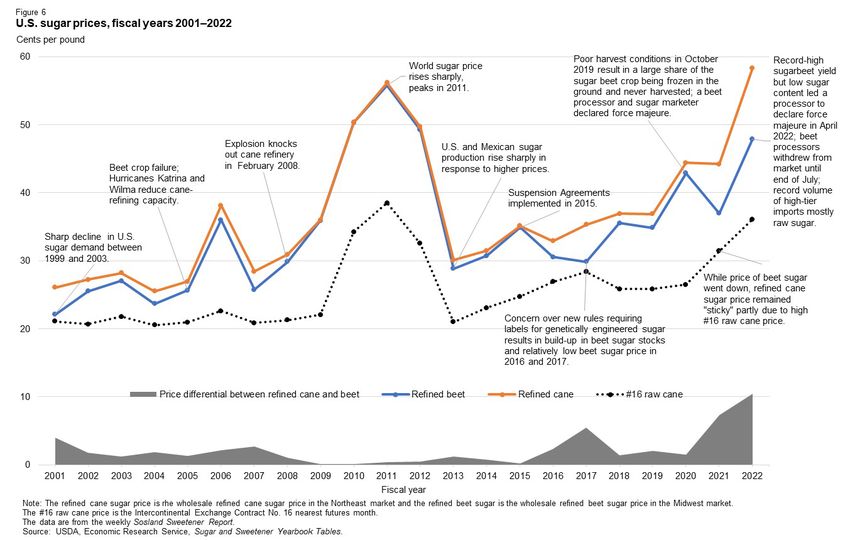
High-tier imports in 2022/23 are raised from last month by 50,000 STRV to 125,000. The
upward revision is based on the entries of high-tier raw sugar imports to date, and on the
anticipated increase in the pace of high-tier refined sugar imports in the coming months. Both
factors are a function of several market dynamics namely, the current high-price environment
last experienced in 2011 (figure 6) and tight spot supplies, particularly for refined beet sugar
due to back-to-back years of weather-affected campaigns. Beet refined sugar stocks as of
November 2022 amounting to 1.260 million STRV are about 197,000 lower than the 5-year
average and 141,000 lower than last year. The current stock closely tracks the 10-year
minimum of 1.179 million back in November 2011 (figure 7). However, despite the WASDE
increasing its forecast for the 2022/23 beet sugar and Louisiana cane sugar production this
month, uncertainties remain particularly for the latter given the December freeze event, at
least until the campaign concludes by the end of January. There also are concerns regarding
the slower-than-normal Mexican sugar production, and Mexico’s ability to meet its export
quota.

                                                 10
               Sugar and Sweeteners Outlook: January 2023, SSS-M-413, January 19, 2023
                                 USDA, Economic Research Service
These market dynamics can motivate certain users, non-reporters 1, and cane refiners,
particularly those that are import-based, to watch high-tier sugar imports. These imports
present a viable option to keep factories efficiently running and fulfill increased customer
orders, including those traditionally reliant on refined beet sugar that are still needing
inventory. Indeed, a likely indication of increased demand for refined cane sugar is reflected
in the strong cane refiners’ melt between October and November, which at 1.117 million
STRV matches the record high achieved during the same 2-month period in fiscal year 2016
(figure 8). While refiners’ total inventory (raw and refined sugar) is relatively at normal levels
(figure 9), an unexpected surge in customers’ demand might encourage import-based refiners
or non-reporters to bring in high-duty imports, if the price margins make it profitable.
1 Non-reporters are neither beet processors nor cane refiners that are covered under the sugar program. These companies
typically import refined sugar for direct consumption or delivery to an end-user.
12
Sugar and Sweeteners Outlook: January 2023, SSS-M-413, January 19, 2023
USDA, Economic Research Service13
Sugar and Sweeteners Outlook: January 2023, SSS-M-413, January 19, 2023
USDA, Economic Research ServiceSugar Deliveries Unchanged
No changes are made to the 2022/23 projected sugar use of 12.605 million STRV. The major
subcomponent, domestic food and beverage use deliveries, remains at 12.500 million STRV,
reflecting a 27,000-STRV increase (0.2 percent) from 12.470 million in 2021/22 (figure 10).
Cane refiners posted record-strong deliveries for the first two months of the fiscal year. Through
November, cane sugar deliveries amounted to 1.143 million STRV, which is 45,000 more than
last year (4 percent), and surpassed the prior high of 1.126 million in 2020/21 (table 4). This
trend parallels the elevated cane refiners’ melt for the first two months of the fiscal year which
previously noted, matches the record high for this period. Cane sugar deliveries and melt
closely track each other because cane refiners typically melt raw cane sugar when there is a
contemporaneous customer delivery to be fulfilled; it is costly to store and maintain the quality of
refined sugar in inventory for uncontracted needs.
14
Sugar and Sweeteners Outlook: January 2023, SSS-M-413, January 19, 2023
USDA, Economic Research ServiceTable 4: Food and beverage deliveries, October–November, 2017/18–2022/23
2017/18 2018/19 2019/20 2020/21 2021/22 est. 2022/23 proj. Annual change
1,000 short tons, raw value (STRV) 1,000 STRV Percent
Beet sugar processors 989 886 904 871 937 916 -21 -2
Cane sugar refiners 1,044 1,122 1,076 1,126 1,098 1,143 45 4
Non-reporter (direct consumption) 84 178 187 97 208 108 -100 -48
Total 2,116 2,186 2,166 2,095 2,243 2,167 -76 -3
Percent share in total 5-year Average
Beet sugar processors 47 41 42 42 42 42 42
Cane sugar refiners 49 51 50 54 49 53 51
Non-reporter (direct consumption) 4 8 9 5 9 5 7
Total 100 100 100 100 100 100 100
est. = estimated; proj. = projected.
Source: USDA, Farm Service Agency.
Conversely, cumulative beet sugar deliveries through November amounting to 916,000 STRV
are down 21,000 compared with last year’s pace. Given that spot supplies in the Midwest
market remain unavailable and prices are record high, the reduced pace likely reflects the
supply constraint on the processors’ side. Virtually all the U.S. beet sugar supply is produced
from domestically grown sugarbeets, except for a small quantity of imported beets from
Canada. As such, beet sugar deliveries are largely driven by the expected levels of domestic
beet sugar production and beginning stocks.
Non-reporter deliveries through November of 108,000 STRV are down year over year by
100,000-STRV and would also be lower than 2018/19 and 2019/20 during the same period. Due
to the method of deriving this number, where the underlying data are sourced from different
government agencies, generating a reliable forecast based on pace to date generally does not
apply to this category. The difference in the timing of the data collection also contributes to the
volatility of the data series. Nonetheless, there is a general expectation that non-reporters would
step in to fill some of the users’ unmet sugar supplies amid the production risks from both the
U.S. beet and cane sectors, and the uncertainty surrounding the slower-than-expected Mexican
sugar production.
Given that actual data are only available for two months and that deliveries during the first fiscal
quarter (October–December) have traditionally been the slowest due to the holidays, there is
not enough information that warrants changing the forecast for food and beverage use
deliveries for this month.
15
Sugar and Sweeteners Outlook: January 2023, SSS-M-413, January 19, 2023
USDA, Economic Research ServiceMexico Outlook
Sugar Production Unchanged; Pace to Date Lags Recent
History
The January 2023 WASDE did not change the 2022/23 Mexican supply and use balance sheet,
except for a slight 759-metric ton (MT) increase in exports to countries other than the United
States. Consequently, with the 2022/23 stocks pegged to a 2.5-months’ worth of supply
(971,000 MT), deliveries to Industria Manufacturera, Maquiladora y de Servicios de Exportación
(IMMEX) program are adjusted down ton-per-ton to accommodate the increase in exports.
USDA carried over its 5.9 million MT Mexican sugar production for 2022/23 from last month, a
2.6-percent decline from last year’s 6.185 million MT (table 4). The USDA forecast is lower than
the 6.025 million MT, the first official 2022/23 production forecast that the Mexican National
Committee for the Sustainable Development of Sugarcane (CONADESUCA) released on
November 11. USDA and CONADESUCA mainly differ on their projections for area harvested,
with the former at 814,850 hectares, while the latter is more optimistic in its 832,245-hectare
forecast. According to the USDA FAS office in Mexico City, the relatively high sugar price
environment has incentivized area expansion. Note that either of the projections, if realized,
would be a new record overtaking the prior high of 805,511 hectares in 2018/19.
However, based on CONADESUCA’s weekly production report as of January 7, the fifteenth
week of the campaign, the pace of this year’s harvest lags both last year and the recent 5-year
average. Despite another mill coming online, which brought the total to 47 out of the expected
49, area harvested to date is 6,000 hectares and 8,600 hectares behind the same time in
2021/22 and 2017/18–2021/22 (table 5). The rest of field and factory production metrics are
also lagging. Consequently, the pace-to-date sugar production amounts to 1.062 million MT,
which is about 200,000-MT lower (16 percent) than last year and the 5-year average. If the 5.9
million-MT sugar production forecast is to be met, the mills would have to accelerate their pace
in the immediate weeks and possibly extend campaigns beyond normal termination dates.
Since the Mexican sugar production is directly tied to fulfilling U.S. import requirements, the
developments will be closely watched.
16
Sugar and Sweeteners Outlook: January 2023, SSS-M-413, January 19, 2023
USDA, Economic Research ServiceTable 5: Mexican sugar: supply and use by fiscal year (October/September), January 2023
Items 2020/21 2021/22 2022/23
Final December January Monthly December January Monthly
(estimate) (estimate) change (forecast) (forecast) change
1,000 metric tons, actual weight
Beginning stocks 858 1,053 1,053 0 964 964 0
Production 5,715 6,185 6,185 0 5,900 5,900 0
Imports 65 31 31 0 35 35 0
Imports for consumption 32 7 7 0 10 10 0
Imports for sugar-containing product exports (IMMEX) 1/ 33 24 24 0 25 25 0
Total supply 6,638 7,269 7,269 0 6,899 6,899 0
Disappearance
Human consumption 3,935 4,113 4,113 0 4,168 4,168 0
For sugar-containing product exports (IMMEX) 485 532 532 0 494 493 -1
Other deliveries and end-of-year statistical adjustment -16 -16
Total 4,420 4,629 4,629 0 4,662 4,661 -1
Exports 1,165 1,676 1,676 0 1,266 1,267 1
Exports to the United States and Puerto Rico 828 1,180 1,180 0 1,264 1,264 0
Exports to other countries 337 495 495 0 2 3 1
Total use 5,585 6,305 6,305 0 5,928 5,928 0
Ending stocks 1,053 964 964 0 971 971 0
Stocks-to-human consumption (percent) 26.8 23.4 23.4 0 23.3 23.3 0
Stocks-to-use (percent) 18.9 15.3 15.3 0 16.4 16.4 0
High-fructose corn syrup (HFCS) consumption (dry weight) 1,320 1,291 1,291 0 1,291 1,291 0
1/ IMMEX = Industria Manufacturera, Maquiladora y de Servicios de Exportación.
Sources: USDA, World Agricultural Outlook Board; Mexico’s National Committee for the Sustainable Development of Sugarcane (CONADESUCA).
Table 6: Mexican sugar production as of week 15, 2021/22, 2022/23, and five-year average
As of week 15 Difference vs. 2021/22 Difference vs. 5-year average
5-year average
2021/22 2022/23 (2017/18–2021/22) Level Percent Level Percent
Area harvested (ha) 158,358 152,336 160,966 -6,022 -4 -8,630 -5
Sugarcane processed (MT) 12,526,740 11,027,349 12,650,730 -1,499,391 -12 -1,623,381 -13
Sugarcane yield (MT per ha) 79.10 72.39 78.52 -6.7 -8 -6.1 -8
Number of mills in operation 45 47 48 2 4 -1 -3
Extraction rate (percent) 10.10 9.63 9.92 -0.47 -5 -0.29 -3
Total factory yield (MT per sugar ha) 7.99 6.97 7.79 -1.02 -13 -0.82 -11
Sugar production (MT)
Sugar production (metric tons) 1,265,535 1,061,769 1,258,269 -203,766 -16 -196,500 -16
ha = hectares; MT = metric tons.
Source: USDA, Economic Research Service calculations using data from Mexico's National Committee for the Sustainable Development of Sugarcane
(CONADESUCA).
17
Sugar and Sweeteners Outlook: January 2023, SSS-M-413, January 19, 2023
USDA, Economic Research ServiceSpecial Article: Trends in U.S. Sweetener
Deliveries
Total Caloric Sweetener Deliveries Higher in 2021 for
Second Consecutive Year
Total caloric sweetener deliveries for food and beverage use in the United States for calendar
year 2021 totaled 21.145 million short tons, dry basis (figure 11). This represents an annual
increase of 1.1 percent from 2020’s 20.915 million short tons, dry basis, marking a second
consecutive year of increase since 2019’s 20.774 million. In addition, the 1.1 percent increase
reflects the largest annual growth since 2014 and is relatively higher than the short- and long-
term historical trends (table 6). Also, given that the total sweetener deliveries remain relatively
flat since peaking in 1999, the 1.1 percent growth is noticeable in that it is on par with the 45-
year average (1977–2021), a period that includes the steady increase in total sweetener
deliveries up to the 1999 high point.
18
Sugar and Sweeteners Outlook: January 2023, SSS-M-413, January 19, 2023
USDA, Economic Research ServiceTable 6: Average annual growth rates, quantities, and share of total caloric sweeteners
deliveries, by type, calendar year 1977–2021
1-year 5-year 10-year 20-year 45-year
(2020–2021) (2017–2021) (2012–2021) (2002–2021) (1977–2021)
Average growth rate (percent)
Refined sugar 2.0 0.5 1.2 1.2 0.3
HFCS -1.1 -1.4 -1.4 -1.6 5.3
Other caloric sweeteners 2.5 1.8 1.4 0.1 1.0
Total caloric sweeteners 1.1 0.1 0.3 0.0 1.1
Average quantity (1,000 short tons, dry weight equivalent)
Refined sugar 11,467 11,270 11,065 10,239 9,322
HFCS 6,600 6,700 7,010 7,832 6,626
Other caloric sweeteners 2,963 2,949 2,818 2,813 2,609
Total caloric sweeteners 21,030 20,919 20,893 20,884 18,557
Average share (percent)
Refined sugar 55 54 53 49 50
HFCS 31 32 34 38 36
Other caloric sweeteners 14 14 13 13 14
Total caloric sweeteners 100 100 100 100 100
HFCS = high-fructose corn syrup.
Note: Other caloric sweeteners are composed of dextrose, glucose, honey, and other edible syrups.
Source: USDA, Economic Research Service.
In addition, long-term trends among the sweetener types appear to continue. Sugar derived
from sugarbeets and sugarcane and high-corn fructose syrup (HFCS) remain the largest
components of sweeteners in the U.S. market, averaging 55 percent and 31 percent of the total
sweetener deliveries in the last 2 years. Other sweeteners, which are comprised of other corn
sweeteners (glucose syrup and dextrose), honey, and edible syrups make up the remaining 14
percent, which has been relatively stable over the years. A breakdown of the total 1.1 percent
annual growth indicates that it is mainly driven by an over-the-year increase in the deliveries of
refined sugar (2 percent) and partly by the increase in other sweeteners (2.5 percent), albeit the
actual quantities are relatively smaller, that offsets the decline in HFCS deliveries (1.1 percent).
At a 55-percent average in the last 2 years, the share of sugar in total sweetener deliveries has
been the highest compared to the short- and long-term trends. This is mostly at the expense of
HFCS, whose average share in 2020–21 is down 31 percent compared with 43 percent during
its high point in 1999–2002. The divergent trends characterized by the increasing refined sugar
and decreasing HFCS, as illustrated by the growth rates and share in total deliveries, are also
observed at the per capita level. This is discussed in the next section.
19
Sugar and Sweeteners Outlook: January 2023, SSS-M-413, January 19, 2023
USDA, Economic Research ServicePer Capita Caloric Sweetener Deliveries Also Higher in
2021
The total deliveries of these sweeteners are divided by the U.S. population to estimate the per
capita deliveries to provide insights on the general patterns of sweetener consumption in the
country over time.
Total per capita caloric sweetener deliveries in 2021 rose from last year by 1 percent to 127.4
pounds per capita, an annual growth not observed seen since 2014 (figure 12; table 7). Much
like the gross total caloric sweetener deliveries, most of the over-the-year growth is driven by a
1.9 percent increase in per capita deliveries of refined sugar countering a 1.2 percent decline in
per capita HFCS deliveries. While per capita use of other caloric sweeteners (glucose,
dextrose, honey, other edible syrups) grew 2.4 percent during the same period, the volumes
have been relatively small and historically hovered around 20 pounds.
20
Sugar and Sweeteners Outlook: January 2023, SSS-M-413, January 19, 2023
USDA, Economic Research ServiceTable 7: Average annual growth rates and quantities of per capita caloric sweeteners
deliveries, by type, calendar year 1977–2021
1-year 5-year 10-year 20-year 45-year
(2020–2021) (2017–2021) (2012–2021) (2002–2021) (1977–2021)
Average growth rate (percent)
Refined sugar 1.9 0.0 0.6 0.4 -0.6
HFCS -1.2 -1.9 -2.0 -2.4 4.3
Other caloric sweeteners 2.4 1.2 0.7 -0.6 -0.1
Total caloric sweeteners 1.0 -0.5 -0.3 -0.8 0.1
U.S. population 0.1 0.5 0.6 0.8 0.9
Average quantity (pounds, dry basis)
Refined sugar 69.1 69.0 68.7 66.0 68.0
HFCS 39.8 40.6 43.1 50.2 47.0
Other caloric sweeteners 17.9 18.0 17.5 18.1 18.9
Total caloric sweeteners 126.8 127.6 129.4 134.3 133.8
Note: Other caloric sweeteners are composed of dextrose, glucose, honey, and other edible syrups.
Source: USDA, Economic Research Service.
The long-term trade-off trend between sugar and HFCS observed in the total deliveries data are
further highlighted at the per capita level. At 69.8 pounds in 2021, per capita sugar deliveries
are at the highest level since 1983 (70.5 pounds). The 1.9 percent growth in per capita sugar
deliveries from last year represent the highest growth relative to the short (5-year window),
medium (10- and 15-year), and longer-term growth rates periods (45-year). It also marks the
first time, relative to the other time windows, when sugar deliveries have outpaced population
growth. Despite the 2021’s 69.8-pounds of sugar deliveries being 33 percent lower (32.7
pounds) than its historic high of 102.6 pounds in 1972, the longer-term horizon portrays a
steady pace in per capita refined sugar deliveries, particularly since 2008.
Conversely, the 39.5-pound per capita deliveries of HFCS in 2021 is the lowest since 1984
(37.3 pounds), right before the onset of steady yearly increases that peaked in 1999 (65.9
pounds). Between 1999–2004, HFCS deliveries averaged 63.8 pounds, mostly matching per
capita refined sugar deliveries (at times surpassing it in 2002 and 2003) before progressively
trending downward since and continuing through 2021.
Thus, it appears that refined sugar continues to take market share from HFCS. Since the
declining trend in HFCS deliveries started around 2008, which corresponds with the onset of
the North American Free Trade Agreement’s (NAFTA) sweetener market provisions, one
account is that by allowing sugar imports from Mexico to enter the United States duty free, the
21
Sugar and Sweeteners Outlook: January 2023, SSS-M-413, January 19, 2023
USDA, Economic Research Servicerelatively inexpensive sugar from Mexico displaced HFCS in some beverages. It is also
possible that the reduction of HFCS deliveries occurs in isolation and instead, captures the
consumers’ shift from consuming HFCS-sweetened beverages to others, such as bottled water.
The changing dietary and consumer preferences may also explain the persistence of the
offsetting trend between sugar and HFCS deliveries despite the implementation of the U.S.–
Mexico Sugar Suspension Agreements at the end of 2014. While sugar from Mexico is now
subject to quota and minimum price requirements, imports remain duty free as long as sugar
from Mexico is in compliance. Mexico remains the largest single-country source of U.S. total
sugar imports from a single country despite the current suspension agreements. Mexican
sugar, which is sourced from non-genetically engineered (GE) sugarcane, could have a partial
role in fulfilling recent government package labelling requirements, food manufacturers’
ingredient formulation, and consumer trends away from products with HFCS as an ingredient
and/or towards non-GE ingredients.
Nonetheless, except for 2021’s 1.9 percent over-the-year growth, per capita sugar deliveries
grew at a rate either below or equal to that of the population. Looking at the trend over the
recent decade (2012–2021), the 69.8 pounds in 2021 is above the trend line (figure 13).
Disentangling whether this resurgence is temporary, or if it reflects an actual increase in
customers’ sugar demand as opposed to market reactions to a slew of economic conditions can
have implications for the management of U.S. sugar imports.
The COVID-19 pandemic started in early 2020 and introduced many market distortions that
created domino effects (e.g., pent-up customer demand, logistical bottlenecks and delays, high
transportation costs, labor unavailability). These effects are still being felt and/or have
exacerbated other situations including overall inflation, sustained multi-year high prices for
sugar, Russia-Ukraine war resulting in increased farm input costs such as fertilizer, and
weather-reduced beet sugar production that led to force majeure. For instance, it can be
possible that the increase in sugar deliveries reflect a change in food and beverage companies’
stockpiling behavior in response to uncertain supplies of beet sugar, high U.S. sugar prices,
and difficulty in securing trucks and rail cars to meet the sugar delivery agreement timeframe to
ensure efficient factory operations.
22
Sugar and Sweeteners Outlook: January 2023, SSS-M-413, January 19, 2023
USDA, Economic Research ServiceTo hedge against sugar supply uncertainties, food and beverage companies could have
adopted a just-in-case inventory philosophy, as opposed to the more common, cost-efficient
just-in-time approach. Consequently, these companies could have increased the magnitude
and accelerated the timing of their sugar orders and could be the reason for the relatively large
growth in sugar deliveries in 2021. Since markets generally take time to adjust to normal levels
after a market shock, such as COVID-19 and the Russia-Ukraine war, continued monitoring is
warranted. The availability in the spring of the two data series used in the per capita
calculation–calendar year 2022 sugar deliveries data from the USDA, Farm Service Agency’s
Sweetener and Market Data and the HFCS deliveries data from industry and various
government sources–can help determine if sugar demand in the country continued increasing in
2022.
A discussion follows of import and export patterns of sugar-containing products pointing to a
general trend of increasing sweetener consumption in the U.S.
23
Sugar and Sweeteners Outlook: January 2023, SSS-M-413, January 19, 2023
USDA, Economic Research ServiceSpecial Article: Trends in Estimated Sweeteners
in Imported and Exported Products
Many food and beverage products that are imported (exported) to (from) the United States
contain sugar and/or other types of sweeteners such as HFCS. For brevity, the term sugar-
containing products (SCPs) is used to represent the different types of sweeteners contained in
these products. To analyze the trends in imported (exported) SCPs, two datasets are needed:
the trade data from the U.S. Department of Commerce, Bureau of the Census identified by the
U.S. Harmonized Tariff Schedule (HTS) that was downloaded from Trade Data Monitor; and an
internal USDA database containing a range of sugar-content coefficients 2 corresponding to the
HTS codes under which the imported (exported) products are classified.
In this report, the average of the lower and upper range for each coefficient is used. The sugar
content is estimated by multiplying the imported (exported) quantities from Census with the
corresponding coefficient. Coefficients are available for SCPs in the following categories:
confectionery (HTS chapter 17.04), which includes cocoa and cocoa preparations (chapter 18);
cereal and bakers’ preparations (chapter 19.01, 19.04, and 19.05); miscellaneous edible
preparations (chapter 21); and beverages, which is mostly comprised of carbonated soft drinks
(chapter 22).
Sweeteners in Imported Products Continue to Trend
Upward
The estimated sweeteners from imported SCPs in calendar year 2021 totaled 1.9 million short
tons, dry basis, up 8 percent from 2020 (figure 14; table 8). Similar with domestic sugar
deliveries, this most recent annual growth of sugar from imported SCPs is noticeably larger
when compared with its respective short- and long-term historical trends. Taken together, it
appears that imported SCPs and domestic caloric sweetener deliveries in the last two years
provide evidence indicating increased consumer demand for sugar and sweetened products,
and that the two avenues have been complementary in meeting increased sweetener needs.
2The sugar-content coefficients are available upon request. To view a sample listing, see the USDA, Economic Research
Service SSS-237-01 report titled “Measuring the Effect of Imports of Sugar-Containing Products on U.S. Sugar Deliveries”
by Stephen Haley in September 2003.
24
Sugar and Sweeteners Outlook: January 2023, SSS-M-413, January 19, 2023
USDA, Economic Research ServiceIn terms of individual end-user sectors, imported confectionery products contribute the highest
share of sweeteners from SCP, followed by cereal and bakers’ preparations, then food
products, and finally beverages (figure 15). Confectionery’s share of the total has been as high
as 61 percent in 2006–07 but has since gradually fallen, reaching its lowest level of 49 percent
in 2021. This is because two categories–cereal and bakers’ preparations, and beverage–have
been growing. The share of cereal and bakers’ preparations in 2021 was 22 percent, up from
14 percent in 1995, while beverage’s share in 2021 was 14 percent, which is almost double
than what it was in 1995 (8 percent).
Table 8: Average annual growth rates, calendar year 1996–2021
1-year 5-year 10-year 20-year 25-year
(2020–2021) (2017–2021) (2012–2021) (2002–2021) (1996–2021)
Percent
Domestic sugar deliveries 1.9 0.0 0.6 0.4 0.3
Imported SCP 8.0 5.5 4.7 5.1 7.0
Exported SCP 1.2 -0.5 0.6 3.2 4.0
U.S. population 0.1 0.5 0.6 0.8 0.9
SCP = sugar-containing product.
Source: USDA, Economic Research Service.
25
Sugar and Sweeteners Outlook: January 2023, SSS-M-413, January 19, 2023
USDA, Economic Research ServiceSugar in Exported Products Grew in 2021 After Multiple
Years of Negative Growth
As discussed above, the method applied to imported products was also used to U.S. SCP
exports of like products. Despite U.S. sugar prices being relatively high compared to the world
market, entities can still be motivated to export. For instance, the share of sugar costs in an
exported product is possibly relatively small compared to the product’s total value, and thus,
does not diminish the product’s comparative trade advantage.
In 2021, sugar contained in exported products grew by 1.2 percent to 850,000 short tons, dry
basis, marking the first time a growth was recorded since 2014 (figure 16). While sugar
contained in exported and imported SCPs hovered between 300,000 to 400,000 short tons, dry
basis during 1995 to 1997, the former grew at a higher pace after 1997. The divergence
between the two narrowed after 2006, but widened since 2014.
26
Sugar and Sweeteners Outlook: January 2023, SSS-M-413, January 19, 2023
USDA, Economic Research ServicePer Capita Sweetener Deliveries Higher After Accounting
for Sugar in Imported Products
In practice, the per capita sweetener deliveries that are published in the ERS Sugar and
Sweeteners Yearbook tables do not include the estimated sugar from imported SCPs. But if the
U.S. per capita sweetener deliveries were adjusted to include the sugar from traded SCPs, then
subtracting the sugar in exported products is an essential step. This ensures that only the sugar
from imported products that is available for domestic consumption is accounted for and the
portion intended for exports are excluded.
As expected, the comparison between the per capita sweetener deliveries before and after the
inclusion of estimated sugar from imported SCP shows that the per capita sweetener deliveries
are higher than the original series (figure 17). For instance, after adjustment, the per capita
sweetener deliveries would be 134.6 pounds in 2021, instead of 127.4 pounds, which reflects a
difference of 7.2 pounds (table 9, figure 18). Since 1995, the 2 series moved in parallel and
remain relatively close, implying that the declining trend in per capita sweetener deliveries
cannot be fully accounted for by the increase in imported products. However, it is interesting to
note that the average difference between the two series has been increasing over the years,
thus merits further research.
27
Sugar and Sweeteners Outlook: January 2023, SSS-M-413, January 19, 2023
USDA, Economic Research ServiceTable 9: Average per capita sweetener deliveries, calendar year 1995–2021
1996–2000 2001–2005 2006–2010 2011–2015 2016–2020 2021
Pounds, dry basis
Total sweeteners deliveries 150.7 145.8 136.4 131.3 128.2 127.4
Adjusted for imported SCP 152.5 149.7 140.8 134.8 133.5 134.6
Difference 1.8 3.9 4.5 3.5 5.3 7.1
SCP = sugar-containing product.
Source: USDA, Economic Research Service.
28
Sugar and Sweeteners Outlook: January 2023, SSS-M-413, January 19, 2023
USDA, Economic Research Service29
Sugar and Sweeteners Outlook: January 2023, SSS-M-413, January 19, 2023
USDA, Economic Research ServiceSuggested Citation
Abadam, Vidalina. Sugar and Sweeteners Outlook: January 2023, SSS-M-413, U.S. Department of
Agriculture, Economic Research Service, January 19, 2023.
Use of commercial and trade names does not imply approval or constitute endorsement by USDA.
In accordance with Federal civil rights law and U.S. Department of Agriculture (USDA) civil rights regulations and
policies, the USDA, its Agencies, offices, and employees, and institutions participating in or administering USDA
programs are prohibited from discriminating based on race, color, national origin, religion, sex, gender identity
(including gender expression), sexual orientation, disability, age, marital status, family/parental status, income derived
from a public assistance program, political beliefs, or reprisal or retaliation for prior civil rights activity, in any program
or activity conducted or funded by USDA (not all bases apply to all programs). Remedies and complaint filing
deadlines vary by program or incident.
Persons with disabilities who require alternative means of communication for program information (e.g., Braille, large
print, audiotape, American Sign Language, etc.) should contact the responsible Agency or USDA's TARGET Center
at (202) 720-2600 (voice and TTY) or contact USDA through the Federal Relay Service at (800) 877-8339.
Additionally, program information may be made available in languages other than English.
To file a program discrimination complaint, complete the USDA Program Discrimination Complaint Form, AD-3027,
found online at How to File a Program Discrimination Complaint and at any USDA office or write a letter addressed to
USDA and provide in the letter all of the information requested in the form. To request a copy of the complaint form,
call (866) 632-9992. Submit your completed form or letter to USDA by: (1) mail: U.S. Department of Agriculture,
Office of the Assistant Secretary for Civil Rights, 1400 Independence Avenue, SW, Washington, D.C. 20250-9410;
(2) fax: (202) 690-7442; or (3) email: program.intake@usda.gov.
USDA is an equal opportunity provider, employer, and lender.
30
Sugar and Sweeteners Outlook: January 2023, SSS-M-413, January 19, 2023
USDA, Economic Research ServiceYou can also read