Suitability of Unemployment Benefits in NYC - Projects at ...
←
→
Page content transcription
If your browser does not render page correctly, please read the page content below
Across the Spectrum of Socioeconomics
Volume 1 Issue 4
DOI: 10.5281/zenodo.4740635
_____________________________________________________________________________________

       Suitability of Unemployment Benefits in NYC

       Sarah Derkach, Allan Rikshpun, David Gregory, Sean Chowdhury, Aditya Rawat, Samin Faiaz,
       Raasikh Shahid

       Principal Investigator: Michael Karas

       Affiliation: International Socioeconomics Laboratory, Vanderbilt University, and the University
       of Illinois.
       ______________________________________________________________________________

       Abstract
       The state of New York reported the second-largest rate of percent decline in employment
       compared to October 2020, being down 10.4%, which translates to 1 million fewer jobs. This
       puts New York at the second place based on the highest total number of jobs lost over the year of
       any state, behind the 1.37 million lost by California. This spike in unemployment is correlated to
       the various stay-at-home orders implemented due to the COVID-19 pandemic and other
       pandemic-related factors.

       In this study, we will observe unemployment rates across U.S cities over the past decade
       and specifically analyze the factors influencing unemployment in New York City compared to
       cities with lower unemployment rates and better handling of the COVID-19 pandemic. We will
       also analyze how residents of New York City varied in their ideal maximum unemployment
       benefit amount depending on their borough, economic status, and other factors. Our primary
       research method will be to conduct a survey of 75 New York City residents to identify trends
       based on our variables that include borough, the number of people who are unemployed in the
       participant’s immediate community and the amount that they perceive to be reasonable
       maximum unemployment benefit amount. We will also observe unemployment benefit policies
       and how they have affected the unemployment rate in cities before and after implementation, to
       understand whether it is frictional, structural, or cyclical unemployment that is prevalent in New
       York.
       ______________________________________________________________________________
       Categories: New York, Unemployment, Welfare
       Keywords: Unemployment Benefits, COVID-19, New York City

_____________________________________________________________________________________

International Socioeconomics Laboratory Pages 1-17 2021. All Rights Reserved                     Page 1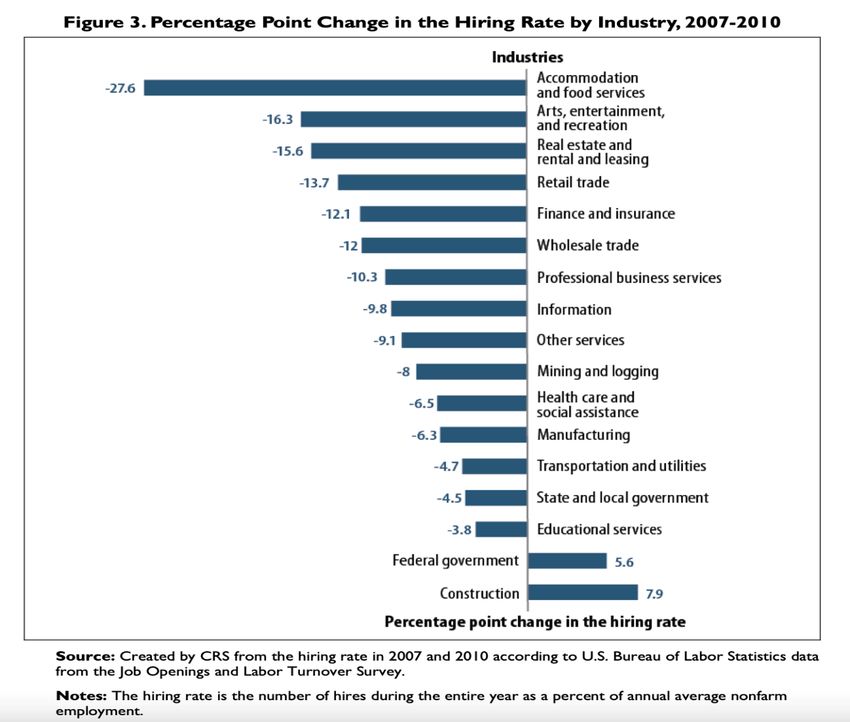
Across the Spectrum of Socioeconomics
Volume 1 Issue 4
DOI: 10.5281/zenodo.4740635
_____________________________________________________________________________________

       Background Research
       Unemployment has been a relevant statistic in America for decades. It is important to consider the
       effects of the coronavirus on unemployment, as well as the overall economic health of America.
       Many people who have been unemployed for a long time, lack the skills to rejoin the workforce.
       The unemployment rate also fails to recognize discouraged workers, who have given up the
       search for a job. The addiction to various narcotics affects many workers across all income levels.
       Current works all seem to point out the fluctuations that occur with unemployment rates, but the
       overall number has risen to a whole new level. The project at hand focuses on the changes of
       unemployment rates within New York City while relating it to other large domains; observing the
       patterns helps one learn about the static, dynamic, and questionable types of movements that take
       place. In response to factors such as significant fluctuations in stock prices, intriguing presidential
       debates, employer shortages, etc. within the last decade, unemployment rates have unsurprisingly
       been quite variable.

       The research question at hand dives deep into the complexities of all industries and fields of
       works. With nearly 11.5% of NYC workers being left unemployed in December 2020, it becomes
       clear that even in a time where most of the population has adjusted to COVID-19, some people
       have been left stranded. Previous works have developed theories and ideas tied to unemployment,
       its factors, and its root causes; this paper will seek the possible reasons for fluctuations in
       unemployment patterns along with the hard-hitting impact of COVID-19.

       To better understand the topic, there should be emphasis on the four main types of
       unemployment: Frictional Unemployment – This type of unemployment is based almost entirely
       on the circumstances of the individual. Frictional unemployment arises when a person is seeking
       or transitioning to a new job and includes individuals new to the workforce (i.e graduates). This
       type of unemployment is the most common and unlike other types, does not fluctuate during an
       economic recession. Structural Unemployment - This type of unemployment is the situation in
       which there is a mismatch between the skills offered and the skills demanded of individuals.
       Structural unemployment is often caused by technological advances that render several skills
       obsolete or inadequate. Cyclical unemployment refers to the effect of economic cycles on
       unemployment. As proven by history, every eight to ten years unemployment rises during
       economic downturn and decreases during periods of prosperity. There isn’t much that can be
       done to prevent this job loss, but it sometimes has a particular effect on a specific sector. This was
       exemplified in 2008-2009 when the housing market collapsed after banks gave out high risk loans
       for a short-term profit. Unsurprisingly, the financial service industry was impacted heaviest.
       Whether an individual was a banker, business manager, or anything related to money, their job
       was left under high scrutiny and horrible results due to the recession. Workers affected by
       seasonal unemployment are not able to get regular unemployment benefits. A good example of
       this would be snow maintenance workers. When snowfall is quite unlikely to occur during the
       summer, there is no need to clean the roads or pour salt and thus these maintenance workers are
       not paid. Often, they need to find a second job.

       When looking at unemployment benefits, it is crucial to note that unemployment insurance
       benefits only apply to those who are not unemployed at their own fault. This includes bankruptcy
       of a company, unreasonable employment release, natural disasters, pandemics, etc. Currently,
_____________________________________________________________________________________

International Socioeconomics Laboratory Pages 1-17 2021. All Rights Reserved                         Page 2
Across the Spectrum of Socioeconomics
Volume 1 Issue 4
DOI: 10.5281/zenodo.4740635
_____________________________________________________________________________________
NYC unemployment benefits are maximum $504 per week. Typically, the range for NYC
unemployment benefits is between $100-$500 per week and can be extended for up to 20 extra
weeks through Extended Benefits (EB) programs, as stated by Access NYC Government website.
However, there is an eligibility requirement for those who receive unemployment benefits. Every
state has their own requirements for the number of hours worked, needed to receive the benefits.
At Careeronestop, there is a clear outline in which one can search for information regarding their
state and receive detailed guidelines on the respective state government website, regarding
eligibility. In NYC, “self-employed, independent contractors, farmers, workers with limited work
history, and others” are not eligible for unemployment benefits. Eligibility also does not apply to
teleworkers and those receiving paid sick leave or other paid benefits.
Those receiving unemployment benefits are also required to be searching for a job. As the article
“Unemployment Job Search and Work Requirements”, The Balance Careers, outlines, those
receiving unemployment benefits are typically asked to report on job search activity to their state
unemployment department. This allows the state to regulate who is in need of the benefits, and
use the government aid, and those who are not actively searching for jobs.
The boroughs of NYC are distinctived by several factors pertaining to the way of living. Tied to
the proposal of unemployment, we have chosen to review in detail the cost of housing within the
five boroughs in order to understand the actual level of rent/mortgages. Starting off in Manhattan,
the part of the city that was significantly impacted by the 9/11 attacks in 2001, the beginning of
the 21st century saw a drastic boom in house prices. Average rent per month in the 2000’s came
out to about $3,800 per month, which is more than double the $1,800 per month that rent cost in
the 1980’s. Obviously, several fluctuations impacted the average cost of housing in this decade,
including the terrorist attacks, the financial market meltdown, and the housing boom. The start of
the next decade (2010’s) actually saw a drop in average rent price by $300, coming out to $3,500
per month and taking into account factors like Quick Rebound and Tax Credit. Now, however,
the price of renting an apartment in Manhattan is just over $4,300 indicating continuation of the
significant increase in prices that occurred before the 2010’s. With the median apartment price of
over a million dollars, it seems safe to assume that Manhattan is a very expensive area. The
Bronx, being another important borough, has also experienced changes and shifted its former
housing prices. From the years ranging between 2000 and 2019, a total 135.24% appreciation was
observed along with a 4.21% increase in average annual rates. A quick couple facts for you: the
average cost of a home in the Bronx in the year 2000 was $236,000, the average rose to $330,000
in the year 2010, and rose heavily once again to $450,000 in the year 2019. This quite simply
shows a drastic increase in housing pricing, even in what is regarded as the “poorest” borough,
with an average income shy of $35,000 annually. Brooklyn, however, saw an even greater rise in
prices from 2000 to 2010 to 2019. From 2010 to 2019 alone, the median house cost saw a
$340,000 increase, indicating negative effects to house buyers, yet positive for infiltrating more
and more money. Brooklyn is indeed one of the bigger attractions, with sports giants in the
Brooklyn Nets and Brooklyn Dodgers. Queens used to be the second cheapest area to buy a home
within the main boroughs, apart from the Bronx. However, its emphatic rise from $345,000 to
$600,000 as the median price makes it clear that its prices saw a significant increase. Ultimately,
Queens transformed from the second cheapest to the third most expensive, which out of a list of
five doesn’t seem like much, but definitely does matter when considering outside factors.
Reaching the final borough, Staten Island comes into the conversation. Not conventionally known
_____________________________________________________________________________________
International Socioeconomics Laboratory Pages 1-17 2021. All Rights Reserved Page 3Across the Spectrum of Socioeconomics
Volume 1 Issue 4
DOI: 10.5281/zenodo.4740635
_____________________________________________________________________________________
as the best locational borough to reside in, Staten Island still boasts several attractive features and
one of them is the median house cost of around $550,000. When considering the rest of NYC’s
boroughs costs, only the Bronx has a lower current cost. The importance of housing costs and its
tie to unemployment is clear; shelter is crucial to life and in order to get shelter you most likely
need a sustainable source of income. If left unemployed, unemployment money will unfortunately
probably not be able to cover even a fraction of the cost to continue living in a New York area
home. Thus, it becomes evident that the saying “NYC is one expensive place to live in” is
accurate. Research and studies done in the past suggest a national increase in unemployment
since as early as 2007. However, each study concludes different causes and examines varying
forms of unemployment. A study called, “Disentangling policy effects using proxy data: Which
shutdown policies affected unemployment during the COVID-19 pandemic?” reviewed the
COVID-19 pandemic as a major cause of unemployment in the US.
The impact it has had on unemployment rates in the past year are seen is the following research,
“We find that between March 14 and 28, restaurant and bar limitations and non-essential business
closures can explain 6.0% and 6.4% of UI claims respectively, while the other NPIs did not
directly increase own-state UI claims.” (Kong, Prinz 2020) The study identified the closing of
non-essential businesses and limitations on dining, including bars and restaurants, having
substantially increased unemployment rates. The COVID-19 pandemic has proven to drive
business to bankruptcy beyond the US, however. This would be seen as cyclical unemployment,
caused by a worldwide detriment to the economy. Specifically, in the study titled, “Do Extended
Unemployment Benefits Lengthen Unemployment Spells?”, data is collected specifically for long
term unemployment. Ideally, unemployment for a longer duration of time occurs only due to
frictional unemployment and difficulty finding an occupation. However, staggering data reveals
that the increase in unemployment benefits could heavily impact the increased time of
unemployment. As written, “Despite these small estimates, extended benefits can account for a
substantial share of the increase in long-term unemployment.” (Farber, Valletta 2014) This
research paper explores the possibility that long-term unemployment rates have increased across
the nation due to leniency in unemployment benefits. The paper studies outside the scope of
general unemployment, but rather finds trends in government unemployment effects.
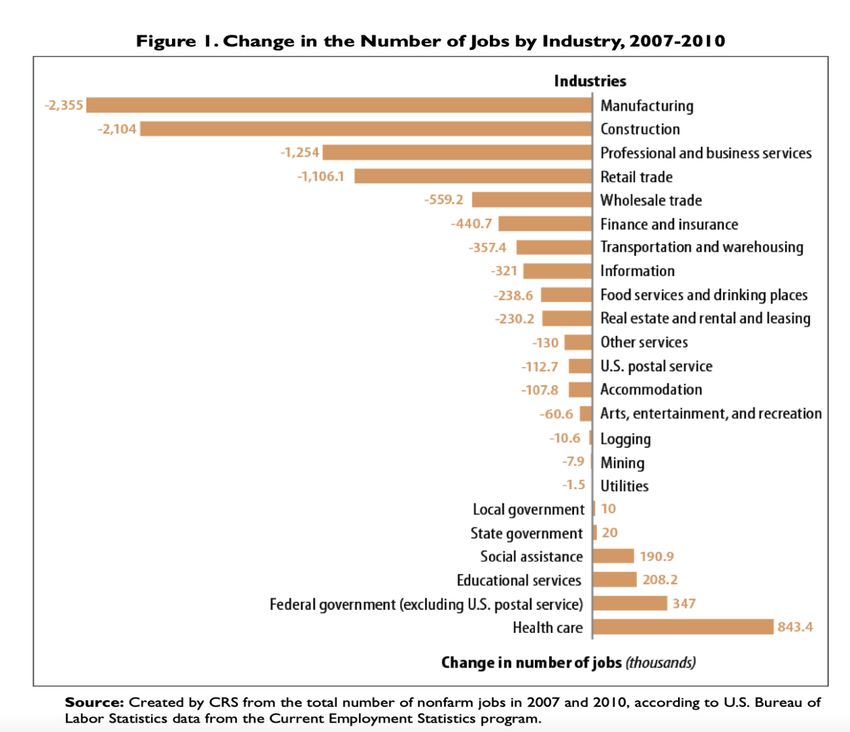
Cornell University performed a study titled, “The Increase in Unemployment Since 2007: Is It
Cyclical or Structural?”. In this research paper, data is collected on different industries between
2007 and 2012. The paper argues, “The unemployment rate greatly increased after the onset of
the latest recession in December 2007, when it measured 5.0%. The rate peaked at 10.0% in
October 2009, four months after the recession’s official end in June 2009. More than three years
into the recovery,
_____________________________________________________________________________________
International Socioeconomics Laboratory Pages 1-17 2021. All Rights Reserved Page 4Across the Spectrum of Socioeconomics
Volume 1 Issue 4
DOI: 10.5281/zenodo.4740635
_____________________________________________________________________________________
Based on our data collection, if we find that NYC unemployment rates have been increasing in
the past decade, we will cross reference the data regarding dates of unemployment and cause.
This will help set a trend for the type of unemployment. As seen from the Cornell study, the
number of jobs available or opportunities for employees vary across different industries. This is
characteristic of structural unemployment. However, if our data were to point to cyclical
unemployment, then we are addressing a systemic economic issue of varying degrees. Seen in
other research done over the previous decades, regarding the unemployment rate averaged 8.1%
in 2012.” (Levine 2013) Cornell University’s study has shown that unemployment rates across
the nation have been rising since 2007. The question at hand is whether it is cyclical or structural
unemployment.
_____________________________________________________________________________________
International Socioeconomics Laboratory Pages 1-17 2021. All Rights Reserved Page 5Across the Spectrum of Socioeconomics
Volume 1 Issue 4
DOI: 10.5281/zenodo.4740635
_____________________________________________________________________________________
Unemployment on a national scale, it is likely that our data will reveal a combination of frictional
and cyclical unemployment, mostly due to COVID-19. The paper aims to create graphs
displaying data collected by the survey, for each question. This includes years unemployed, status
of employment, cause of initial unemployment. The data collected about the years of
unemployment would display the possibility, similar to that in Cornell University’s study, of
increased unemployment benefits impacting the increase in long-term unemployment. The graph
displaying data regarding the status of employment aims to reveal the difficulty finding a new
job. This will set a standard for the hiring rates of different industries in NYC. The cause of initial
unemployment will display trends occurring over the past decade, in hopes of preventing
economic recessions in the future. The new laws created make the first $10,200 of benefits tax-
free for people with less than $150,000 and only applies to 2020 only. Both benefits programs,
the Pandemic Unemployment Assistance and Pandemic Emergency Unemployment will extend
to Sept. 6.
Specific Aims
New Yorkers were more likely than adults nationwide to live in a household that lost employment
income since the start of the COVID-19 pandemic. An average family of four living in New York
_____________________________________________________________________________________
International Socioeconomics Laboratory Pages 1-17 2021. All Rights Reserved Page 6Across the Spectrum of Socioeconomics
Volume 1 Issue 4
DOI: 10.5281/zenodo.4740635
_____________________________________________________________________________________
City has an estimated monthly cost of $4,943.96 without rent. Although the current maximum
unemployment amount of $504 is set to relieve these issues, there is still debate behind what the
ideal amount should be set to. Depending on socioeconomic status and location of residence,
there is bound to be differences among residents on the ideal amount. We seek to confirm this
theory and understand the unemployment crisis and how New Yorker’s believe it can be
addressed through the maximum unemployment amount.
The study intends to understand how New Yorkers today think about the unemployment benefits
in New York City. If they are dissatisfied with the result, we intend to evaluate how much is
enough for them considering living expenses. We hypothesize that most unemployed New
Yorkers are dissatisfied with the results and expect at least may sway the opinions of most people
on whether the unemployment benefits are sufficient, some people may say that unemployment
benefits may be enough/more than enough due to the stimulus check and how much they already
receive from the stimulus check. However, the unemployment benefits are still very low, with the
maximum amount per week a little less than $500. The CARES Act bumps the benefits to $600.
Other stimulus check laws bump up the unemployment benefits; regardless, these may sway the
general population to better unemployment benefits. $800 in terms of unemployment benefits.
We also hypothesize that the prolonged unemployment rate is due to numerous factors. One
major factor is the coronavirus pandemic's impact and how companies must furlough employees
to maintain their business. Another factor is structural unemployment, which is caused when the
unemployed workers' skill sets do not match the demanded skills; this is important due to the
rapid pace in technological advantages today. A third factor is frictional unemployment where the
employee is either unemployed or is undergoing job changes. A final factor is cyclical
unemployment, which is when periods of unemployment occur every couple of years. We will
examine these rates by surveying unemployed graduates and small businesses in New York City.
After conducting this survey, we will analyze the data we have received and use it to evaluate the
patterns of employment in New York City. Afterward, we will use preceding surveys in other
U.S. cities and their rate of unemployment to compare them with that of New York City. Finally,
we will use all the information gathered to evaluate our hypothesis and use it to help create better
unemployment rates. We also want to understand the correlation between unemployment
insurance benefits and unemployment rates. A popular debate that currently consumes Congress
today as they debate over Biden’s proposed 1.9T stimulus bill is: how much unemployment
insurance is best? We guess that some number of benefits helps workers get back to work because
it provides them with the funds for their daily.
Materials and Methods
For this study we are analyzing and determining the causes and effects of unemployment benefits.
We will be looking for qualitative data, asking NYC residents about the current amount of
unemployment benefits. We will be creating a survey for NYC residents, asking about
unemployment, and if they are comfortable, the reason for it. In the study – The independent
variables are : Borough (in New York City), "Have you (or anyone you know) ever been
unemployed in the past 20 years (pre-Covid)?". Boroughs are being used to narrow down this
data to certain areas of New York City, as well as for background information. In the google
form, the “Have you(or anyone you know) ever been unemployed in the past 20 years (pre-
Covid), is going to be used as background as well. This question is vital to the ethos of this study
_____________________________________________________________________________________
International Socioeconomics Laboratory Pages 1-17 2021. All Rights Reserved Page 7Across the Spectrum of Socioeconomics
Volume 1 Issue 4
DOI: 10.5281/zenodo.4740635
_____________________________________________________________________________________
and portrays proper data in which people have first-hand experience on the issue at hand. For this
question, we decided to have 2 answers choices - yes and no. The dependent variable in the study
is: “The maximum unemployment benefit in NYC today is $504 a week, do you believe that is 1,
2, or 3?”. The response for this question is meant to give people a perspective on unemployment
benefits and be able to share needs so they can focus on finding new jobs. However, at the same
time we recognize that too much insurance could possibly discourage people from returning to
work because they can live more comfortably by remaining unemployed. To answer this
question, we hope to isolate the changing unemployment rates in New York and understand how
much of their deviation can be attributed to the simultaneously changing amount of
unemployment benefits offered by the state. their thoughts. We placed 3 possible answer choices
- (1) Not enough to live comfortably, (2) right amount, and (3)more than enough to live
comfortably. The substance of this question lies beneath the realization of how unemployment
benefits affect people in various communities. Through giving people a ballpark estimate of the
amount unemployed individuals receives through benefits, we are trying to figure out whether or
not the quantity should be altered.
We also aim to review the data collected by the Bureau of Labor Statistics on the unemployment
services offered by New York. We will create a line graph depicting the different amounts of
unemployment benefits offered at a certain time and chart a line of linear regression on top to
understand at what times the state deviated the most from the mean. Then, we will compare this
data to our chart on unemployment rates in New York and describe any correlations that we find.
At the same time, we will research extensively the time periods where we find the deviations to
ensure that our data can be isolated from other world events that may be associated with the
changing unemployment rate more so than the changing amount of unemployment benefits.
Data
Descriptive Statistics:
Figure 1:
Have you (or anyone you personally know) been unemployed within the past 20
years (pre-Covid)?
Valid 71
Missing 8
Mean 1.423
Std. 0.497
Deviation
_____________________________________________________________________________________
International Socioeconomics Laboratory Pages 1-17 2021. All Rights Reserved Page 8Across the Spectrum of Socioeconomics
Volume 1 Issue 4
DOI: 10.5281/zenodo.4740635
_____________________________________________________________________________________
Minimum 1.000
Maximum 2.000
Figure 1 is a descriptive model that demonstrates the breakdown of the responses to the question,
“Have you (or anyone you personally know) been unemployed within the past 20 years (pre-
Covid)?”. In the table, 1 represents those who answered “Yes” and 2 those who answered “No”.
Frequency Tables:
Figure 2.1:
Frequencies for Have you (or anyone you personally know) been unemployed within the past 20
years (pre-Covid)?
Have you (or anyone you personally Frequency Percent Valid Cumulative
know) been unemployed within the Percent Percent
past 20 years (pre-Covid)?
1 41 51.899 57.746 57.746
2 30 37.975 42.254 100.000
Missing 8 10.127
Total 79 100.000
Figure 2.1 is a frequency table of the question, “Have you (or anyone you personally) been unemployed
within the past 20 years (pre-Covid)?”. In this model, 1 represents those who answered “Yes'' and 2
those who answered “No”. 41 out of 71 participants answered that they have, or know someone who has
been, unemployed in the past 20 years. 30 of the 71 participants selected that they have not, or do not
know anyone who has been, unemployed in the past 20 years. This is 57.75% and 42.25% respectively.
Figure 2.2:
Frequencies for Borough
_____________________________________________________________________________________
International Socioeconomics Laboratory Pages 1-17 2021. All Rights Reserved Page 9Across the Spectrum of Socioeconomics Volume 1 Issue 4 DOI: 10.5281/zenodo.4740635 _____________________________________________________________________________________ Borough Frequency Percent Valid Percent Cumulative Percent Bronx 10 12.658 14.085 14.085 Brooklyn 6 7.595 8.451 22.535 Manhattan 12 15.190 16.901 39.437 Queens 35 44.304 49.296 88.732 Staten Island 8 10.127 11.268 100.000 Missing 8 10.127 Total 79 100.000 Figure 2.2 displays the frequencies for the varying boroughs of the participants. In this table, 10 people responded from the Bronx, 6 from Brooklyn, 12 from Manhattan, 35 from Queens, and 8 from Staten Island, for a total of 71 participants. This can also be represented as 14.09%, 8.45%, 16.9%, 49.3%, and 11.27% respectively. _____________________________________________________________________________________ International Socioeconomics Laboratory Pages 1-17 2021. All Rights Reserved Page 10
Across the Spectrum of Socioeconomics
Volume 1 Issue 4
DOI: 10.5281/zenodo.4740635
_____________________________________________________________________________________

ANOVA:
Figure 3.1:
 ANOVA - The maximum unemployment benefit in NYC today is $504 a week, do you believe that
                                        is

                      Cases                          Sum of         df     Mean         F          p
                                                     Squares              Square

 Have you (or anyone you personally know)              1.347        1     1.347      4.301     0.042
 been unemployed within the past 20 years
               (pre-Covid)?

                   Residuals                          21.611      69      0.313

Figure 3.1 is an ANOVA test comparing responses to the questions, “Have you (or anyone you personally
know) been unemployed within the past 20 years (pre-COVID)?” and “The maximum unemployment
benefit in NYC today is $504 a week, do you believe that is 1, 2, or 3?” in which 1 represents those who
believe the current maximum benefits are not enough to live comfortably, 2 is for those who believe that
it is enough, and 3 for those believe it is more than enough to live comfortably. Question 1, regarding
having been, or knowing anyone who has been, unemployed, is the independent variable. Question 2,
regarding opinions on the current maximum unemployment benefit, is the dependent variable. The p-
value for the ANOVA test is 0.042, > 0.05.

Figure 3.2:
 ANOVA - The maximum unemployment benefit in NYC today is $504 a week, do you believe that
                                        is

         Cases                Sum of           df      Mean Square            F                p
                              Squares

     Borough                    2.122           4           0.531            1.680           0.165

     Residuals                 20.836          66           0.316

Figure 3.2 is an ANOVA test that compares the boroughs of the participants with responses to the
question “The maximum unemployment benefit in NYC today is $504 a week, do you believe that is 1, 2,
or 3?”. The p-value for the ANOVA test is 0.165, < 0.5.

_____________________________________________________________________________________

International Socioeconomics Laboratory Pages 1-17 2021. All Rights Reserved                   Page 11
Across the Spectrum of Socioeconomics
Volume 1 Issue 4
DOI: 10.5281/zenodo.4740635
_____________________________________________________________________________________
Linear Regressions:
Figure 4.1:
ANOVA
Model Sum of Squares df Mean Square F p
H₁ Regression 1.352 1 1.352 4.732 0.035
Residual 13.424 47 0.286
Total 14.776 48
Note: The intercept model is omitted, as no meaningful information can be shown.
Figure 4.1 is the ANOVA test in a linear regression between the questions, “The maximum
unemployment benefit in NYC today is $504 a week, do you believe that is 1, 2, or 3?” and “What would
you set the maximum unemployment benefit to (realistically considering NYC living expenses) ? (write
only the number)”. In this regression test, the dependent variable remains the same, and the question
asking participants to set their own maximum unemployment rate, serves as the covariates. The p-value
for this ANOVA test is 0.035, > 0.05.
Figure 4.2:
Coefficients
Model Unstandardized Standard Standardized t p
Error
H₀ (Intercept) 1.327 0.079 16.737 <
.001
H₁ (Intercept) 1.549 0.128 12.128 <
.001
_____________________________________________________________________________________
International Socioeconomics Laboratory Pages 1-17 2021. All Rights Reserved Page 12Across the Spectrum of Socioeconomics
Volume 1 Issue 4
DOI: 10.5281/zenodo.4740635
_____________________________________________________________________________________
What would you set -2.219e -4 1.020e - -0.302 -2.175 0.035
the maximum 4
unemployment
benefit to
(realistically
considering NYC
living expenses) ?
(write only the
number)
Figure 4.2 provides the coefficients for the regression test. The standard and unstandardized error are
displayed for each value, as well as their respective p-values.
Data Analysis
The relationship between participants' experience with unemployment, and their opinion on the
current maximum unemployment benefits in NYC is significant. With a p-value of 0.042, the data
can be considered correlational. Considering the data, it is evident that those who have
experienced, or know someone who has experience, unemployment is inclined to believe that the
current maximum benefits in NYC are not sufficient, to support their living expenses. The
relationship between the borough of the participants and their evaluation of the current maximum
benefits proved insignificant, with a p-value of 0.165. However, this indicates that there are
people in the same borough who find that the current maximum benefits in NYC would and
would not accommodate their living expenses. The study can be redesigned to evaluate the
opinions, regarding the maximum unemployment benefits in NYC, based on specific
neighborhoods. This would provide more accurate information concerning the maximum
benefits’ support for living expenses, based on location.
The data shows that Queen’s residents are more likely to know someone who is unemployed,
considering this, unemployment policies would probably focus on queens over other boroughs.
This poses the question of why unemployment is so unevenly distributed. Considering Queens
has such a low cost of living, in most neighborhoods, it may be manageable for people to live
solely off of unemployment. In one of the borough's various housing projects, an applicant can
rent a three-bedroom apartment for $500/month. People on unemployment benefits are given that
much in a week. In combination with food stamps, there is no need to look for a job
Conclusion
When it comes to unemployment, the questions are endless; one could be asked about the skilled
vs. unskilled, specific distribution of benefits, how a larger population may react to
unemployment, etc. In seeking for those answers, we have observed other policies that have been
employed in an effort to see what NYC could potentially utilize. First off, can jobs be provided to
_____________________________________________________________________________________
International Socioeconomics Laboratory Pages 1-17 2021. All Rights Reserved Page 13Across the Spectrum of Socioeconomics
Volume 1 Issue 4
DOI: 10.5281/zenodo.4740635
_____________________________________________________________________________________
everyone? One would think that the most optimal solution would simply be to create an area in
which everyone is employed, but this simply is not viable, nor would it allow a society to
properly function. Rather, the goal should be to form job openings in which true workers can
show their passion.
According to a study conducted by UMass Amherst, building mass transit is frankly the most
cost-effective solution to unemployment. The formation creates approximately 20,000 job
openings and costs about 1 billion dollars to create. This solution may be broad but reaches a
scope that NYC has already shown to take decent advantage of. Several other ideas could be
utilized in order to create job openings and other regulatory factors. One main objective could
eventually shift into getting homeless off the streets. 1 out of every 106 people in NYC is
homeless, totally out to near 80,000. These large numbers could be a turning factor in terms of
employment, unemployment, benefits, etc. Compared to its neighboring state, New Jersey,
NYC’s problem of homelessness is quite severe. New Jersey boasts diverse populations, high
incomes, and low unemployment rate (around 3% in 2019). The sheer skill of laborers excels
those of many other states and policies in the works look to further impact the area.
Regarding unemployment benefits, it can be observed that a dollar of benefits eventually
translates into 1 dollar and 64 cents of Gross Domestic Product (GDP). This is caused by a ripple
effect. If one were to purchase an apple for one dollar at the grocery store, this apple is for eating,
while the dollar you pay gets infiltrated into paying for the store employees’ salaries: the
transporter of the apple’s salary, the farmer who planted the apple’s salary, etc. It becomes
evident that unemployment benefits are indeed improving the economy bit by bit, but as seen in
the data, the value can be considered too high or too low, to accommodate living expenses. A
solution, as utilized in several states around the world, is to enforce stricter requirements in order
to gain benefits. If the cost of living is exceeded by the benefits an unemployed individual would
not be inclined to search for a new job. By enforcing stricter regulations, benefit amounts can be
regulated more evenly. Several other ideas such as funding for education, forming a maximum
hour limit, etc. have been suggested as policies, but no immediate results have been displayed.
After analyzing this study’s results, there is a clear relation between NYC resident’s experience
with unemployment and their opinions on the suitability of the current maximum benefits. We
initially believed this to be the case as typically those with lower income and higher living
expenses will prefer a higher benefit amount especially if they have been unemployed. Our
survey and data pointed to this as well as our ANOVA test pointed towards a strong correlation
between the borough of the participant and whether they believed the current unemployment
benefit amount of 504$ was not enough to live comfortably or enough comfortably from a scale
of 1-3. Although there are factors limiting our study, specifically only 75 participants and a
strong skew towards Queens’s residents, we still believe a larger sample will reflect this trend.
Unemployment has always been prevalent across NYC and as living expenses and financial
instability occur throughout NYC; we can only expect a greater demand for higher
unemployment benefit amounts. Although we can neither confirm nor deny the effectiveness of
higher or lower unemployment benefits with this paper, it is important to note the difference in
need across varying communities. These results only highlight the income disparity and severe
effects unemployment has had across NYC. More importantly, we believe the results of our study
can provide insight into what New Yorker’s expect the government to provide and how New
_____________________________________________________________________________________
International Socioeconomics Laboratory Pages 1-17 2021. All Rights Reserved Page 14Across the Spectrum of Socioeconomics
Volume 1 Issue 4
DOI: 10.5281/zenodo.4740635
_____________________________________________________________________________________
Yorker’s perceptions towards unemployment policy and benefit amounts are affected by their
unique circumstances.
_____________________________________________________________________________________
International Socioeconomics Laboratory Pages 1-17 2021. All Rights Reserved Page 15Across the Spectrum of Socioeconomics
Volume 1 Issue 4
DOI: 10.5281/zenodo.4740635
_____________________________________________________________________________________
References
And, H. (2014, July). Henry S. Farber. Retrieved March 05, 2021, from
http://jhr.uwpress.org/content/50/4/873.short
Andrews, Jeff. (2019, December) “How NYC’s Home Prices Changed in the Past Decade.”
Curbed NY, from https://ny.curbed.com/2019/12/13/21009872/nyc-home-value-2010s-
manhattan-apartments
Bernard, Tara Siegel. “Stimulus Payments Start to Arrive: The Latest on the Coronavirus Relief
Bill - The New York Times.” The New York Times - Breaking News, US News, World News and
Videos, 6 Mar. 2021, http://www.nytimes.com/live/2021/stimulus-check-plan-details#how-does-
the-stimulus-package-affect-unemployment-payments.
Boomgaarden, H., & Vliegenthart, R. (2006, December 14). Explaining the rise of anti-immigrant
parties: The role of news media content. Retrieved April 16, 2021, from
https://www.sciencedirect.com/science/article/abs/pii/S0261379406001168
Careeronestop. (2015, September 09). Retrieved April 16, 2021, from
https://www.careeronestop.org/LocalHelp/UnemploymentBenefits/find-unemployment-
benefits.aspx?location=NY
David, G. (2021, January 22). Jobs take a hit in New York as local economy heads for A 'Second-
Wave Slowdown'. https://www.thecity.nyc/2021/1/21/22243502/jobs-take-a-hit-in-new-york-as-
local-economy-heads-for-a-second-wave-slowdown.
Doyle, A. (2020, May 02). Do you have to look for work while collecting unemployment?
Retrieved April 16, 2021, from https://www.thebalancecareers.com/unemployment-job-search-
and-work-requirements-206413
Freudenber, N., Fahs, M., Galea, S., & Greenberg, A. (2011, October 10). The American Journal
of public Health (AJPH) from the American public Health Association (apha) publications.
Retrieved April 16, 2021, from
https://ajph.aphapublications.org/doi/full/10.2105/AJPH.2005.063511
Furman, J. (2016). The Truth About American Unemployment: How to Grow the Country's
Labor Force. Foreign Affairs, 95(4), 127-138. Retrieved April 16, 2021, from
http://www.jstor.org/stable/43946939
Haag, M. (2020, June 19). The pandemic sent young new yorkers packing. will they return?
Retrieved April 16, 2021, from https://www.nytimes.com/2020/06/19/nyregion/nyc-coronavirus-
young-people.html
Heilman, Greg. “Does Getting a Third Stimulus Check Affect the New Unemployment Benefits?
- AS.Com.” AS.Com, AS En, 22 Mar. 2021,
_____________________________________________________________________________________
International Socioeconomics Laboratory Pages 1-17 2021. All Rights Reserved Page 16Across the Spectrum of Socioeconomics
Volume 1 Issue 4
DOI: 10.5281/zenodo.4740635
_____________________________________________________________________________________
https://en.as.com/en/2021/03/22/latest_news/1616447065_674476.html.
Hevesi, Dennis. (2001, April) “Across the City, A Strong Market.” The New York Times, from
https://www.nytimes.com/2001/04/08/realestate/across-the-city-a-strong-
market.html#:~:text=In%20the%20northeast%20Bronx%2C%20the,percent%2C%20from%20%
24321%2C000%20to%20%24384%2C000
Kong, E., & Prinz, D. (2020, August 23). Disentangling policy effects using proxy data: Which
SHUTDOWN Policies affected unemployment during the COVID-19 pandemic? Retrieved
March 05, 2021, from https://www.sciencedirect.com/science/article/abs/pii/S0047272720301213
Levine, L. (january 24, 2013). The Increase in Unemployment Since 2007: Is It Cyclical or
Structural? Congressional Research Service. https://hdl.handle.net/1813/77681
lucy@brickunderground.com. “Here’s How Much Apartment Prices Have Risen across NYC in
the Last 10 Years.” Brick Underground, 20 Nov. 2018, from
https://www.brickunderground.com/buy/how-prices-have-changed-over-10-years-NYC
NYS unemployment Insurance – access nyc. (n.d.). Retrieved April 16, 2021, from
https://access.nyc.gov/programs/nys-unemployment-insurance/
Pettinger, Tejvan. (2020, December) “Policies for Reducing Unemployment.” Economics Help,
from www.economicshelp.org/blog/3881/economics/policies-for-reducing-unemployment.
Press, Associated. “Stimulus Checks, Unemployment Benefits and More: Here’s How the
Pandemic Will Affect Filing Your Taxes | KTLA.” KTLA, KTLA, 10 Feb. 2021,
http://ktla.com/news/nationworld/stimulus-checks-unemployment-benefits-and-more-heres-how-
the-pandemic-will-affect-filing-your-taxes/.
U.S. Bureau of Labor Statistics. (2021, March 05). Retrieved March 06, 2021, from
https://www.bls.gov/
“State Employment and Unemployment Summary.” U.S. Bureau of Labor Statistics, U.S. Bureau
of Labor Statistics, 26 Jan. 2021, www.bls.gov/news.release/laus.nr0.htm.
“The Best Way to Solve High Unemployment According to Research.” The Balance, Accessed
15 Apr. 2021, from https://www.thebalance.com/unemployment-solutions-3306211
_____________________________________________________________________________________
International Socioeconomics Laboratory Pages 1-17 2021. All Rights Reserved Page 17You can also read