Summary findings on the impact of the Covid-19 crisis on food banks - The Trussell Trust
←
→
Page content transcription
If your browser does not render page correctly, please read the page content below
Summary findings on the
impact of the Covid-19 crisis
on food banks
JUNE 2020
The economic crisis caused by the impact of Covid-19 has continued to drive a sustained
surge in need for food banks in the United Kingdom. New figures from the Trussell Trust
show that across April there was an 89% increase in need, compared to the same period
last year.
Since the introduction of significant measures to restrict the spread of the pandemic in
the UK there has been an unprecedented level of demand placed on the social
security safety net and other forms of support. People across the country have
faced immediate cuts to their earned income, closures to their businesses, reduced hours,
and complete job losses. Data previously published by the Trussell Trust showed that the
economic consequences of Covid-19 had an immediate impact on people’s ability to
afford food. Overall levels of need for support from food banks increased by 81% in the
last two weeks of March, compared to the same time last year.
The new data now released by the Trussell Trust shows that, while welcome, the changes
that have been made in April to increase the financial support available to people have
not been nearly enough to protect many from being swept into crisis. Despite the
introduction of these measures, food banks in the Trussell Trust network have seen the
huge increases from March continue through April, and even worsen.
Headline findings for the United Kingdom
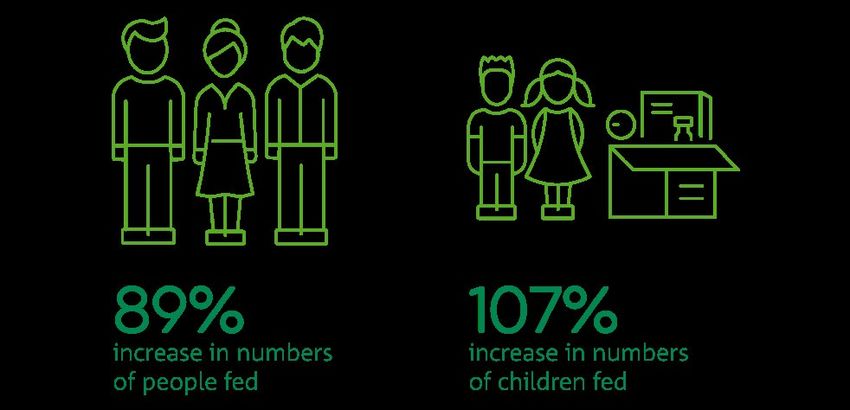
The most recent data collected from food banks in the Trussell Trust network shows that
the increase in need for food banks seen in the second half of March has continued
through April – with an 89% increase in the number of people supported by emergency
food parcels, and 107% more children receiving support from a food bank when
compared to the same period last year.
These figures compare the weeks 14-18 in the calendar years of 2019 and 2020, with most
of the time period falling within the month of April in both years1.
In April, the Trussell Trust has seen:
• An 89% increase in the number of food bank parcels given to people and a 67%
increase in the number of household referrals to food banks – up from 81% and 48%
in the second half of March, respectively. This means that the crisis we saw at the
beginning of lockdown has continued throughout April, despite government
measures to support people on low income.
• The number of children needing support from a food bank in April 2020 more than
double compared to the same period last year (107% increase). This is a reduced rate
of increase compared to the end of March, when food banks provided parcels to 122%
1
Unless otherwise stated, comparisons are between weeks 14-18 2019 (1 April – 5 May) and weeks 14-18 2020 (30 March – 3 May)
1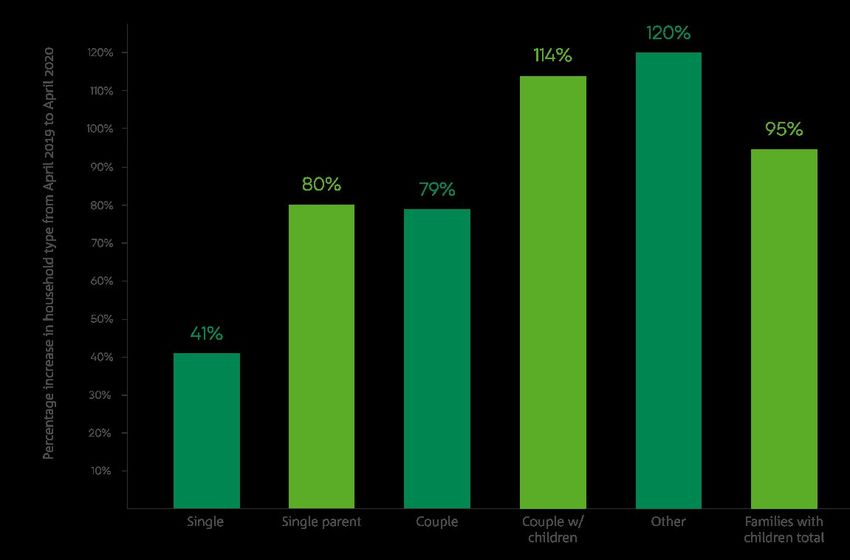
more children than the same period last year, but children continue to be
     disproportionately affected by this crisis.

•    Children aged 0-16 account for just 20% of the United Kingdom population as of mid-
     2019. These latest statistics show that they make up 43% of the additional parcels
     distributed across April 2.

•    These figures are significantly above the normal year on year increases we see across
     the network. Our latest yearly increase data from April 2018 – March 2019 showed a
     19% increase in the number of parcels provided to people.
Percentage increases in need April 2019 to April 2020:

Alongside the increase in the total volume of people given support, the Trussell Trust also
collects the underlying reason for referral to a food bank. These can be compared over
time to understand what the drivers of additional need have been.
These show that:
     •    43% of household referrals to food banks in this period were because of low
          income. Referrals made for this reason have more than doubled in comparison to
          the same period last year (a 102% increase), and they account for nearly half (48%)
          of the overall increase in referrals.

     •    11% of the increase is because of a higher number of people reporting sickness.

These percentage increases are broadly similar to those seen in the last two weeks of
March, but there are differences. For example, while there was a 9% decrease in referrals
because of benefit delays at the end of March, in April this category saw a 4% increase.

2
 Figures from: Mid-year population estimates: Persons by single year of age and sex for local authorities in the UK, mid-2019.
https://www.ons.gov.uk/peoplepopulationandcommunity/populationandmigration/populationestimates/datasets/populationestimatesforuke
nglandandwalesscotlandandnorthernireland

                                                                                                                               2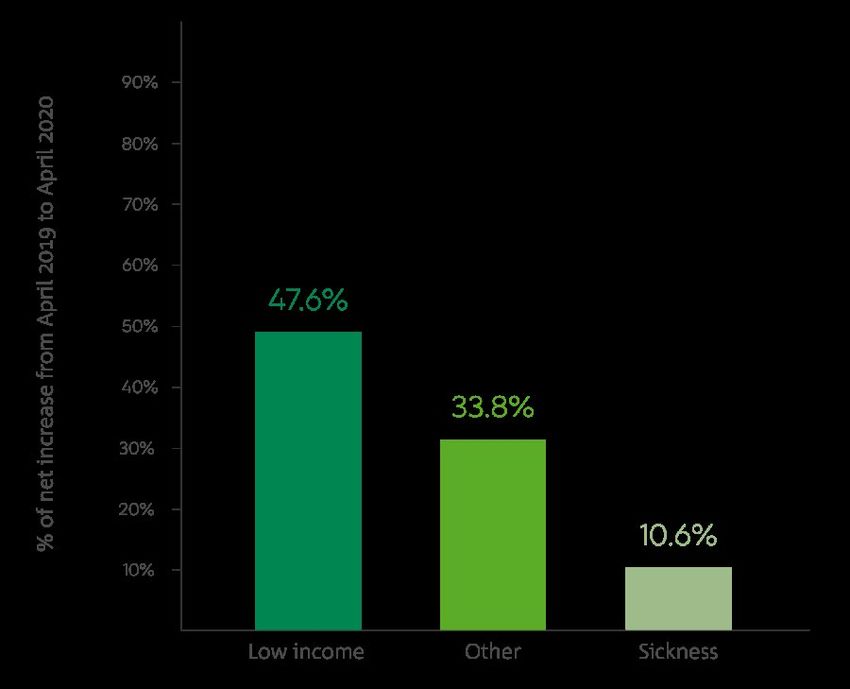
Top three drivers of increased need for food bank support – reasons for referral

Table 1: Top three reasons for referral for a food bank parcel and comparison to April 2019

                                         April 2020 % of total        % increase 2019 to 2020
    Low income                           43%                          102%
    Other                                19%                          406%
    Benefit delays                       11%                          4%

**Some categories may be having their numbers suppressed by the growth in the ‘other’ category. Due to the time constraints
that they are under some food banks may be coding some or all their data for crisis type under the ‘other’ category.

The Trussell Trust also collects information on the type of household that receives a food
parcel. The data for April 2020 shows:
•      Single person households remain the single biggest group accessing support from
       food banks in the Trussell Trust network at 42% of all households. This has declined
       from 51% in April 2019.

•      A 95% increase in the number of families with children that received a parcel from a
       food bank from April 2019.

•      Increases in the number of families with children receiving a parcel account for 46% of
       the total increase from April 2019 3.

•      Families with children made up 38% of households that received a parcel, in
       comparison to 33% of the total in the same period in 2019.

3
 Households with dependent children make up 29.2% of total households in England. English Housing Survey 2018-19 MHCLG.
https://www.gov.uk/government/statistics/english-housing-survey-2018-to-2019-headline-report

                                                                                                                              3
Table 2: Household type for households that received a food bank parcel, and change from April 2019
April 2019 % April 2020 % % of net increase
Single 50.5% 42.4% 13.1%
Single Parent 17.9% 19.3% 25.1%
Couple w/ children 14.9% 19.0% 10.0%
Couple 11.1% 11.9% 30.5%
Other 5.6% 7.4% 21.3%
Families with
32.8% 38.3% 46.4%
children total
Percentage increase in household type from April 2019 to April 2020
Breakdowns across the United Kingdom
England, Northern Ireland, Scotland and Wales have all seen significant increases in need
for food bank support this April compared to last. However, this latest data shows that
there are some differences in the experiences of food banks across the United Kingdom 4.
Table 3: Northern Ireland has seen bigger increases in need during April 2020, while the increases Scotland
has seen have been smaller.
England N Ireland Scotland Wales UK
% increase in no. of all
95% 142% 47% 89% 89%
people fed
% increase in no. of
115% 128% 62% 101% 107%
children fed
4
Please note that, because England is home to around three quarters of food banks in the Trussell Trust network, the figures for England are
likely to closely follow the figures of the whole UK.
4Factors that may result in differing levels of need across the UK
As low numbers make percentage increases difficult to interpret, a comparison of the
reasons for referral data between areas within the UK is not useful in understanding the
difference between the increases that are seen. However, we do know of several factors
which are likely to have affected the changing level of need food banks have seen in each
area.
Our level of data does not however allow us to say conclusively what impact each of these
may have had on supressing or increasing levels of need. This list is also not exhaustive of
all of the factors that may be relevant to drivers of need for support from a food bank 5.
• Areas within the United Kingdom have been differently affected by the crisis. This is
a result of both the circumstances of these areas before the crisis, and the direct
consequences of specific aspects of the crisis:
• The resilience and financial circumstances of businesses vary across the UK. ONS
data shows that Northern Ireland has the highest proportion of businesses with
less than six months of cash reserves at 46%, higher than any other region, while
Scotland has the highest proportion of businesses with more than six months of
cash reserves at 34% 6. This may impact on the ability of businesses to maintain the
employment of staff, or to avoid wage reductions.
• This data also shows that a smaller percentage of businesses in Northern Ireland
were continuing to trade during the crisis (74%) than in other areas of the UK
(Wales: 79%, Scotland: 80%, England: 81%). We know that some industries
including hospitality, tourism and retail have been more seriously affected by the
crisis, and the distribution of these industries is not even 7.
• Experimental DWP data also suggests that the four areas have seen different
increases to claims. The Claimant Count data, which covers claims for Jobseeker’s
Allowance and those claimants in the UC “searching for work” conditionality,
shows that there was a 69% increase in the number of claims between March and
April 2020. Northern Ireland saw larger increases than England, Scotland or
Wales8. This is likely related to differences in business resilience, and the extent to
which they dominate local labour markets.
England N Ireland Scotland Wales UK
% increase in no. of
68% 89% 67% 77% 69%
Claimant Count claims
• Differences in 2019 data. Overall, food banks in Scotland saw a significant increase in
need in March and (to a lesser extent) April 2019, while food banks in other areas saw
either a small increase or no increase. This could be expected to reduce the year-on-
5
For more information on why people may need to access food banks, and who is more likely to have to please see our State of Hunger
report: https://www.trusselltrust.org/state-of-hunger/
6
Final results, Wave 4 of ONS Business Impact of Coronavirus (COVID-19) Survey, businesses who have not permanently stopped trading in
the period 20 April to 3 May 2020.
https://www.ons.gov.uk/businessindustryandtrade/business/businessservices/bulletins/coronavirusandtheeconomicimpactsontheuk/21may2
020
7
Final results, Wave 4 of ONS Business Impact of Coronavirus (COVID-19) Survey.
https://www.ons.gov.uk/businessindustryandtrade/business/businessservices/bulletins/coronavirusandtheeconomicimpactsontheuk/21may2
020
8
https://www.ons.gov.uk/employmentandlabourmarket/peoplenotinwork/unemployment/datasets/claimantcountandvacanciesdataset
5year percentage increase that Scotland saw in March and April, relative to the other
areas of the UK.
• Operational differences. The food bank networks in each area have different features
and have also responded to the crisis in different ways. Both these factors are likely to
have affected the increases in the numbers of people the food banks in each area have
fed.
• Before the crisis, the make up of the food bank networks was different. For
example, the network in Northern Ireland generally has a higher proportion of
small food banks, and small food banks can expect to see bigger fluctuations in
percentage changes in general. During the crisis, our data has shown that small
food banks are more likely to see the biggest percentage increases in need.
• Many food banks across the UK have been forced to reduce or alter their service
provision in order to work safely during the crisis. This can include reduced hours
or choosing to open only some distribution centres and not others. Closures,
changes to the distribution model, and opening hours has a more significant
impact on the figures for the nations with a lower number of food banks.
• Policy differences may also impact on how levels of need evolve in different areas of
the UK. For example, Scotland have committed to working towards a ‘cash-first’
approach. These may evolve over time, for instance in policy differences on supporting
children entitled to free school meals when schools are closed.
• Parliaments in Scotland and Wales and the national Assembly in Northern Ireland,
alongside local authorities, have responded differently to the crisis. Many policies
that have been brought in to support people through the crisis have been UK-wide,
such as the Job Retention Scheme, scheme for self-employed people, and food parcels
distributed to those considered extremely vulnerable because of pre-existing health
conditions. However, other policy changes have been made at a national level, and
these differences may affect the levels of need that food banks in each area have seen.
Similarly, differing responses can be seen at the local level where local authorities
have discretion over how support is provided.
• Demographic differences at the local and national level may mean that some areas
see supressed levels of need for parcels from food banks in the Trussell Trust network.
Areas with higher numbers of people shielding and receiving support from local
authorities or the government may, for instance, see reduced levels of need for
parcels from food banks in the network.
• Emergence of, and increase in, local crisis support, including mutual aid networks.
Local support has developed across the UK, but some areas seem to have higher levels
of participation than others. Support could be practical, such as doing a neighbour’s
shopping, or involve food distribution or direct financial support. Our area managers
report many new food distribution centres opening in response to the crisis. It is
difficult to know the effect this support has had on levels of need seen by food banks
in different areas of the UK.
6About the data
Due to the urgency of reporting on the emerging findings from the Trussell Trust’s food
bank network, these figures do not fully represent all food banks in the network. They are
however representative in terms of the proportion of people usually supported.
• The figures are based on data provided by 351 of the 425 food bank charities in
the Trussell Trust network. These food banks represent 82% of those in the
network and, in normal times, they provide parcels to 82% of those who need a
Trussell Trust food bank. The food banks have not been weighted to be
demographically or geographically representative, but at least 80% of the food
banks from each area of the UK are included.
• Everyone who comes to a food bank in our network is referred by a local
organization that holds food bank vouchers, like a housing association or local
Citizens Advice. These organisations will often already be working with someone
to support with the situation they’re facing and can assess whether someone is in
need of a food bank and provide them with a voucher as part of that support if
needed.
• Every time someone is referred to a food bank, the Trussell Trust’s data system
logs the reason given by the agency for that household referral, and the number
of people in the household that need an emergency food parcel. This provides the
Trussell Trust with two datasets: the number of household referrals and the
number of food bank parcels that have been given to people.
No. food banks % of food banks % of parcels distributed
England 256/317 81% 82%
Northern Ireland 21/22 95% 99%
Scotland 40/48 83% 78%
Wales 34/38 89% 90%
• Unless otherwise stated, comparisons are between weeks 14-18 2019 (1 April – 5
May) and weeks 14-18 2020 (30 March – 3 May)
• The figures are significantly above the normal year on year increases we generally
see across the network. Our latest yearly increase data from April 2018 – March
2019 showed a 19% increase: https://www.trusselltrust.org/news-and-blog/latest-
stats/end-year-stats/
• The 2019 Easter school holidays fell in April. Although Christmas and the long
summer holidays have typically caused an increase in food bank use, particularly
for children, the same trend is not seen around Easter holidays.
• Food banks were first asked to complete their data in a video from the Trussell
Trust’s chief executive. This was followed by emailed requests, and personal phone
calls from their area managers
• April 2020 data was collected up until 5pm 22 May 2020. Only those food banks
which were able to confirm data completion by this date were included in this
analysis. Additionally, we excluded the five food banks which were closed (or
which had not yet opened) for the entirety of April 2019, and one food bank which
7had no data for April 2020. This is in order to provide a more accurate comparison
of need.
• As this analysis relies on data from a sample of food banks, the Trussell Trust
cannot report on the increase in the absolute numbers of people receiving food
bank parcels.
8You can also read