Sun-as-a-star observations of the 2017 August 21 solar eclipse
←
→
Page content transcription
If your browser does not render page correctly, please read the page content below
Solar and Stellar Magnetic Fields: Origins and Manifestations
             Proceedings IAU Symposium No. 354, 2019
             A. Kosovichev, K. Strassmeier & M. Jardine, ed.
             doi:10.1017/S1743921319010019

                       Sun-as-a-star observations of the 2017
                              August 21 solar eclipse
                          Ekaterina Dineva1,2 , Carsten Denker1 , Meetu Verma1 ,
                            Klaus G. Strassmeier1,2 , Ilya Ilyin1 and Ivan Milic3
                            1
                           Leibniz-Institut für Astrophysik Potsdam (AIP), An der Sternwarte 16,
                                                   14482 Potsdam, Germany
                                                    email: edineva@aip.de
                  2
                    Universität Potsdam, Institut für Physik und Astronomie, Karl-Liebknecht-Str. 24/25,
                                                   14476 Potsdam, Germany
                     3
                       University of Colorado Boulder, Laboratory for Atmospheric and Space Physics,
                                   1234 Innovation Drive, Boulder, CO 80303-7814, U.S.A.

             Abstract. The Potsdam Echelle Polarimetric and Spectroscopic Instrument (PEPSI) is a state-
             of-the-art, thermally stabilized, fiber-fed, high-resolution spectrograph for the Large Binocular
             Telescope (LBT) at Mt. Graham, Arizona. During daytime the instrument is fed with sun-
             light from the 10-millimeter aperture, fully automated, binocular Solar Disk-Integrated (SDI)
             telescope. The observed Sun-as-a-star spectra contain a multitude of photospheric and chro-
             mospheric spectral lines in the wavelength ranges 4200–4800 Å and 5300–6300 Å. One of the
             advantages of PEPSI is that solar spectra are recorded in the exactly same manner as nighttime
             targets. Thus, solar and stellar spectra can be directly compared. PEPSI/SDI recorded 116 Sun-
             as-a-star spectra during the 2017 August 21 solar eclipse. The observed maximum obscuration
             was 61.6%. The spectra were taken with a spectral resolution of R ≈ 250 000 and an exposure
             time of 0.3 s. The high-spectral resolution facilitates detecting subtle changes in the spectra while
             the Moon passes the solar disk. Sun-as-a-star spectra are affected by changing contributions due
             to limb darkening and solar differential rotation, and to a lesser extend by supergranular veloc-
             ity pattern and the presence of active regions on the solar surface. The goal of this study is to
             investigate the temporal evolution of the chromospheric Na D doublet during the eclipse and
             to compare observations with synthetic line profiles computed with the state-of-the-art Bifrost
             code.
             Keywords. Sun: chromosphere, instrumentation: spectrographs, techniques: spectroscopic,
             methods: data analysis

             1. Introduction
                Data collected during solar eclipse observations provide valuable input for studies of
             the outer atmosphere of the Sun including the chromosphere (Athay 1976). Its name
             originates from the red flash of Hα emission, which appears within the totality phase.
             The chromosphere is an intermediate layer between the relatively cool photosphere and
             the million-degree corona. The physical boundaries of this intermediate layer are in the
             range 500–5000 km above the solar surface (Vernazza et al. 1981; Rutten 2007) but the
             chromosphere is highly structured, both horizontally and vertically, e.g., spicules, mot-
             tles, rosettes, and various kinds of filaments, so that an exact definition of its borders
             is difficult and maybe not even appropriate. Aimanova & Gulyaev (1976) derived the
             formation height among other height-dependent properties of the Na i D doublet, using
             slitless spectrograms of the 1976 July 10 total solar eclipse over Chukotka, Russia.


             c International Astronomical Union, 2020
Downloaded from https://www.cambridge.org/core. Leibniz-Institute for Astrophysics Potsdam, on 01 Oct 2020 at 11:23:40, subject to the Cambridge Core terms of
use, available at https://www.cambridge.org/core/terms. https://doi.org/10.1017/S1743921319010019
474 E. Dineva et al.
The obscuration of the solar disk by the Moon presents a unique setting for researchers
to address a broad range of topics (Pasachoff 2009). Major parts of eclipse research con-
cern the corona (e.g., Saito & Tandberg-Hanssen 1973; Habbal et al. 2011; Koutchmy
et al. 2019). However, observations in the visible spectrum, as well as in the adjacent
infrared (IR), ultraviolet (UV), and extreme ultraviolet (EUV) bands, are popular in
solar physics (e.g., Dunn et al. 1968; Bazin & Koutchmy 2013), solar-stellar connec-
tion studies (Schleicher et al. 2004), and exoplanet research (e.g., Takeda et al. 2015;
Reiners et al. 2016). Albeit rarely in the focus of eclipse observations, manifestations of
magnetic activity are interesting because they affect the radial velocity measurements of
active stars (Haywood et al. 2016; Cauley et al. 2018, e.g.,). Although the Sun is not an
extremely active star, only the solar case delivers detailed knowledge about the evolution
and properties of the active regions (e.g., Verma et al. 2016; Verma 2018). Supported
by models of stellar atmospheres (Beeck et al. 2012), the above studies have two signifi-
cant outcomes, i.e., an improved understanding of the underlying physical processes and
additional input information to increase the precision of models.
The chromosphere is highly dynamics and feature-rich. Observing the Sun in vari-
ous strong chromospheric absorption lines, e.g., Hα, Ca ii K & H, and the infrared Ca ii
triplet, allows us to investigate the fine structure as well as the global behaviour of the
solar chromosphere. The solar alkali spectrum, in particular Sodium Na i D λ5890 Å and
Potassium K i λ7699 Å, gain significant popularity in solar and stellar research (e.g.,
Nikolov et al. 2016; Lendl et al. 2017). For example, conveniently used in helioseismology
(Bruls et al. 1992), the Na i D doublet offers diagnostics tools linking photospheric and
lower chromosphere dynamics (Leenaarts et al. 2010).
During the 2012 May 21 solar eclipse, Takeda et al. (2015) obtained 184 disk-integrated
spectra of with the High Dispersion Echelle Spectrograph (HIDES, Izumiura 1999)) at the
Okayama Astrophysical Observatory, Japan. The high-resolution spectra (R ≈ 520 000)
covered the wavelength range 4400–7500 Å. An exposure time of 10 s made it possible
to trace the eclipse with very good temporal resolution. Deriving the latitude depen-
dence of the solar differential rotation was the primary goal of this study. Thereby, the
Sun served as a template that can be utilized in the analysis of stellar radial velocity
curves, deriving sensitive information about stellar systems, star-planet interactions, and
eclipsing binaries and their rotational parameters.
In the spirit of the aforementioned study, Reiners et al. (2016) investigated the
the properties of disk-integrated photospheric absorption line spectra observed during
the 2015 March 20 solar eclipse. Employing a Fourier Transform Spectrometer (FTS,
Davis et al. 2001) at the 50-cm Vacuum Vertical Telescope (VVT) of the Institut für
Astrophysik, Göttingen (IAG), they obtained 159 disk-integrated spectra of the eclipse
in two spectral ranges, i.e., 5000–6200 Å and 6500–6700 Å. Similar to the observations
by Takeda et al. (2015), the Göttingen eclipse was not on the path of totality, which is
however irrelevant in the context of exoplanet research. Reiners et al. (2016) analyzed the
velocity curves computed from the eclipse spectra and quantified all solar contributions.
Thus, the crucial impact of the convective blueshift was revealed and the need for more
realistic models was demonstrated.
The studies by Takeda et al. (2015) and Reiners et al. (2016) motivated our investiga-
tion of the Na i D doublet during the 2017 August 21 solar eclipse and the modeling of
these strong chromospheric absorption lines based on magneto-hydrodynamics (MHD)
simulations. Additional impetus arises from the strong interest in the behavior of the
Fraunhofer lines within the stellar and exoplanet research communities (Czesla et al.
2015), in particular provoked by the Na i D abundance in the atmospheres of hot Jupiter
planets (Yan et al. 2015).
Downloaded from https://www.cambridge.org/core. Leibniz-Institute for Astrophysics Potsdam, on 01 Oct 2020 at 11:23:40, subject to the Cambridge Core terms of
use, available at https://www.cambridge.org/core/terms. https://doi.org/10.1017/S1743921319010019Sun-as-a-star observations of the 2017 August 21 solar eclipse 475
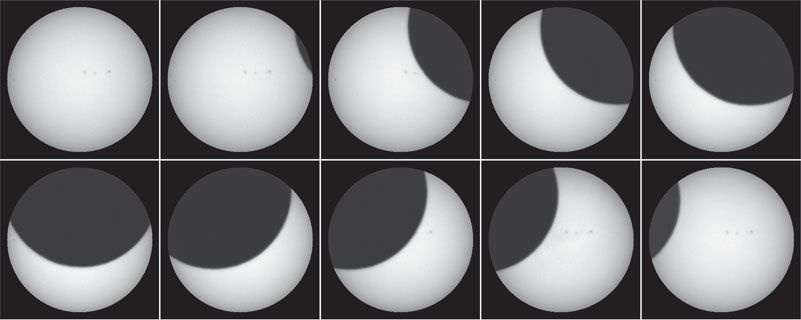
16:17 UT 16:23 UT 16:48 UT 17:04 UT 17:20 UT
17:35 UT 17:50 UT 18:06 UT 18:22 UT 18:43 UT
Figure 1. Full-disk broad-band images observed with the SDI guiding telescope during the
2017 August 21 solar eclipse. Active regions NOAA 12671 and 12672 are visible near disk center
and at the eastern limb, respectively.
2. Observations and data reduction
The 2017 August 21 total solar eclipse was only visible as a partial eclipse at
Mt. Graham Observatory, Arizona, U.S.A. The partial eclipse started at 16:17 UT and
ended at 19:06 UT, while the maximum obscuration (61.6%) took place at 17:38 UT, i.e.,
the elevation of the Sun rose from 42.6◦ to 68.8◦ during the eclipse, which corresponds
to an air mass of 1.48 at the beginning of the eclipse and about unity at its conclusion.
More details of solar eclipses can be obtained from the Solar Eclipse Computer (SEC)
provided by the U.S. Naval Observatory (Bartlett et al. 2019). Due to technical prob-
lems with the telescope drive between 16:23 and 16:49 UT, a chunk of data is missing.
Increasing overcast towards the end of the eclipse terminated observations after 18:43 UT.
Overall, however, the weather and seeing conditions were favorable during the eclipse.
The Potsdam Echelle Polarimetric and Spectroscopic Instrument (PEPSI, Strassmeier
et al. 2015, 2018) was designed to record stellar spectra with a spectral resolution of
up to R ≈ 250 000, exploiting the light gathering capability of the 2×8.4-meter diameter
Large Binocular Telescope (LBT, Hill et al. 2006). The 10-millimeter diameter Solar-Disk
Integrated (SDI) telescope is located on the LBT’s kitchen balcony. It observes the Sun
as a star, feeding a pair of 300 μm-core fibers that guide the light to the blue and red arm
of the spectrograph, while a small full-disk telescope provides accurate guiding. Selected
full-disk images tracing the evolution of the eclipse are shown in Figure 1. The time-series
contains more than 800 full-disk images at a cadence of 10 s. Two small active regions
(NOAA 12671 and 12672) were present on the disk, one at disk center and one near the
eastern limb, which were successively concealed by the passing Moon.
In a dedicated observing campaign during the solar eclipse, 116 high-resolution spectra
were obtained with PEPSI/SDI, covering the two spectral spectral windows 4200–4800 Å
and 5300–6300 Å with an average dispersion of 2 mÅ. An exposure time of 0.3 s followed
by a CCD readout time of 40–60 s, yields a cadence of approximately 60 s between con-
secutively acquired observation. The average signal-to-noise (S/N) ratio is approximately
700:1 for a single exposure. Stacking spectra to improve the S/N ratio is not an option
because a good temporal resolution is needed to track the evolution of the eclipse.
In the present study, we investigate the temporal evolution of the solar Na i D doublet
during the eclipse. Facilitated by the eclipse geometry, the 116 high-resolution spectra
provide snapshots with different contributions from solar differential rotation and limb
darkening. In the top panel of Figure 2, we display a “quiet-Sun” Na i D spectrum IqS (λ),
Downloaded from https://www.cambridge.org/core. Leibniz-Institute for Astrophysics Potsdam, on 01 Oct 2020 at 11:23:40, subject to the Cambridge Core terms of
use, available at https://www.cambridge.org/core/terms. https://doi.org/10.1017/S1743921319010019476 E. Dineva et al.
1.0
0.8
Intensity I / I0
0.6
0.4
0.2
0.0
0.2
(Iecl − I) / I
Contrast
0.0
−0.2
5887 5888 5889 5890 5891 5892 5893 5894 5895 5896 5897
Wavelength λ [Å]
Figure 2. Sun-as-a-star intensity profiles of the chromospheric Na i D doublet (top). This spec-
tral range was extracted from a PEPSI/SDI spectrum covering the spectral window 5300–6300 Å.
A spectrum I(λ) before the eclipse (blue) is compared with a spectrum Iecl (λ) recorded at
18:06 UT (red ), i.e., close to the culmination of the eclipse. Both spectra were normalized
so that the continuum intensity I0 corresponds to unity. The contrast profile was computed
according to Equation 2.1 and exhibits signals of up to 20% of the local intensity.
which was recorded just before the onset of the eclipse. An eclipse Na i D spectrum
Iecl (λ) is shown for comparison. The differences are small and hard to detect by visual
inspection. Some telluric lines exhibit a variation of line depth during the eclipse, which
can be attributed to the decreasing air mass. The sample eclipse spectrum was selected
27 min after the culmination of the eclipse because the eclipse geometry will produce a
spectrum at maximum obscuration that is almost indistinguishable from the quiet-Sun
profile, besides the lower intensity. Computing contrast profiles (see bottom panel of
Figure 2) will enhance and quantify the eclipse signal according to
Iecl (λ, t) − IqS (λ)
C(λ, t) = . (2.1)
IqS (λ)
After the culmination of the eclipse, the shape of contrast profile resembles that of the
derivative of a Gaussian, with the positive lobe at shorter wavelengths. The peak-to-valley
(PTV) contrast difference is 0.41. Before the eclipse both lobes change sign. An inclination
of the Moon’s path with respect to solar North-South will lead to an asymmetry of minima
and maxima of the contrast profiles and also affect the wings.
Despite the minimum of Solar Cycle 24, two small active regions were present, which
will however not significantly affect the spectral profiles. The Moon started to cover the
spots of active region NOAA 12671 at 16:45 UT, completely covered them at 16:48 UT,
and uncovered them at 18:15 UT. Due the location of active region NOAA 12672 near
the eastern limb, the first spot was covered at 17:41 UT. Observing its reemergence
was obstructed by clouds. The presence of sunspot groups facilitated the proper align-
ment of the images taken by SDI, which in turn confirmed the eclipse geometry. The
impact of active regions was neglected in the later comparison with the contrast profiles
derived from Bifrost simulations (Section 3). In principal, the time-dependent super-
granular velocity pattern will also affect the spectral profile but in the comparison, we
Downloaded from https://www.cambridge.org/core. Leibniz-Institute for Astrophysics Potsdam, on 01 Oct 2020 at 11:23:40, subject to the Cambridge Core terms of
use, available at https://www.cambridge.org/core/terms. https://doi.org/10.1017/S1743921319010019Sun-as-a-star observations of the 2017 August 21 solar eclipse 477
μ = 0.2 μ = 0.4 μ = 0.6 μ = 0.8 μ = 1.0
Figure 3. Center-to-limb variation (left to right) of a network element in the quiet Sun based
on a Bifrost simulation. Displayed are emergent continuum intensity, line-core intensity, center-
of-gravity velocity, and maximum degree of circular polarization (top to bottom), which were
derived from the strong chromospheric absorption line Na D2 . The intensities are scaled for
clarity, and the line-core intensity is shown on a logarithmic scale. The velocity is scaled between
±2 km s−1 and the degree of polarization between ±20%.
limited the velocity distribution across the disk to solar differential rotation including
the accurate B0 -angle (heliographic latitude of the central point of the solar disk).
3. Contrast profiles derived from Bifrost simulations
Bifrost is a state-of-the-art parallel numerical code for MHD simulations of stellar
atmospheres from the convection zone to the corona (Gudiksen et al. 2011). The version
employed in this study builds on many generations of numerical codes, e.g., the Oslo
Stagger code. Five spatio-spectral data cubes of the Na i D doublet describe the CLV
of a quiet-Sun region containing a strong magnetic network element. The cosine of the
heliocentric angle corresponds to μ = 0.2, 0.4, 0.6, 0.8, and 1.0. The full Stokes vector is
available for each of the 200 × 200 pixels. The Stokes profiles are sampled at 1 mÅ cover-
ing a 10 Å-wide spectral window in the range 5887–5897Å. The simulated spectra contain
the Na i D doublet as well as the photospheric Fe i λ5892.7 Å and Ni i λ5892.9Å lines.
In Figure 3, we present the CLV of four physical parameters describing the Na i D2 line,
i.e., emergent continuum intensity, line-core intensity, line-of-sight (LOS) velocity, and
degree of circular polarization. The field-of-view (FOV) contains a strong magnetic net-
work element in the lower right corner embedded in a quit-Sun background. Ideally, such
simulations would blanket the entire solar surface. This, however, will require immense
computational efforts and does not take into account the three-dimensional nature of an
atmosphere in a spherical shell encompassing the entire Sun. Thus, some simplifications
are needed.
The goal is to model the PEPSI/SDI Sun-as-a-star spectra of the eclipse with those
derived from Bifrost simulations. In a first step, the 200 × 200 Stokes-I spectra are aver-
aged for each of the five spatio-spectral data cubes. Our model Sun has a diameter of
1024 pixels, and for each pixel on the disk a spectrum is needed, which is appropriate
Downloaded from https://www.cambridge.org/core. Leibniz-Institute for Astrophysics Potsdam, on 01 Oct 2020 at 11:23:40, subject to the Cambridge Core terms of
use, available at https://www.cambridge.org/core/terms. https://doi.org/10.1017/S1743921319010019478 E. Dineva et al.
1.0 1.0
Cosine of the heliocentric angle μ
0.8 0.8
Intensity I / I0
0.6 0.6
0.4 0.4
0.2 0.2
0.0 0.0
5888 5890 5892 5894 5896
Wavelength λ [Å]
Figure 4. Center-to-limb variation of spatially averaged intensity profiles of the Na i D doublet,
which is based on the Bifrost simulation shown in Figure 3. The initial five profiles (solid lines)
correspond to a different value of the cosine of the heliocentric angle μ = 0.2, 0.4, 0.6, 0.8, and
1.0. The μ = 0.0 profile (dashed line) is a scaled version of the μ = 0.2 profile adjusted for the
CLV of the continuum intensity. The six intensity profiles of the Na i D doublet are the basis for
an interpolation to an equidistant grid in μ with a resolution of δμ = 0.001. The intensity profiles
of the Na i D doublet are plotted with increasing distance from disk center (violet to red ).
for a given μ and the Doppler shift due to solar differential rotation at the given loca-
tion. Active regions and the imprint of the supergranular velocity pattern are currently
neglected. Thus, in a second step, the five average Na i D profiles were interpolated to an
equidistant grid in μ with a grid spacing of δμ = 0.001. Since no Na i D profiles are avail-
able for μ < 0.2, we just scaled the profile for μ = 0.2 with an appropriate CLV value of the
continuum intensity. The results of this interpolation step are summarized in Figure 4.
Finally, we computed disk-integrated spectra for the eclipse with a time step of 1 min
using the exact eclipse geometry at the Mt. Graham Observatory. As mentioned in
Section 2, the differences are better seen in contrast profiles. A disk-integrated quiet-
Sun profile without any obscuration served as the reference profile. Each disk-integrated
eclipse spectrum was normalized such that the continuum intensity is unity. In principle,
model light curves can be computed for continuum and line-core intensity. Signals in
the contrast profiles are detected at the 10−5 level already one minute after the start
of the eclipse, which is comparable to the signal from a Mercury transit. The results of
this modeling effort are plotted in Figure 5 for every second computed contrast profile.
The red-blue color coded spectra vary smoothly from the start to the end of the eclipse.
The maximum of the PTV contrast difference of 0.63 occurs at 18:24 UT, which is about
50% higher and occurs 18 min later than in the observations. The shape of the contrast
profiles resembles that of a derivative of a Gaussian, switching sign after the culmination
of the eclipse. The asymmetries in the lobes and the wings of the contrast profiles are a
direct consequence of the eclipse geometry, breaking symmetries related to the CLV and
solar differential rotation. In summary, we demonstrated successfully that forward mod-
eling using the Bifrost simulations produces reasonable disk-integrated contrast profiles
of the 2017 August 21 eclipse but a more detailed comparison will be carried out in a
forthcoming study.
Downloaded from https://www.cambridge.org/core. Leibniz-Institute for Astrophysics Potsdam, on 01 Oct 2020 at 11:23:40, subject to the Cambridge Core terms of
use, available at https://www.cambridge.org/core/terms. https://doi.org/10.1017/S1743921319010019Sun-as-a-star observations of the 2017 August 21 solar eclipse 479
0.4
0.2
Contrast (Iecl − I) / I
0.0
−0.2
Start End
−0.4
5889.50 5889.75 5890.00 5890.25 5890.50
Wavelength λ [Å]
Figure 5. Series of contrast profiles covering the 2017 August 21 solar eclipse. The color
scale indicate the progress of the partial solar eclipse from start to end as observed at the Mt.
Graham Observatory. The contrast profiles were derived from a Bifrost simulation of the CLV
of the Na i D2 intensity profile.
4. Conclusion
The Sun is the only star, where we can obtain high-resolution spectra and spatially
resolved images. This allows us to study closely and to quantify with formidable pre-
cision phenomena such as convection, magnetic fields, solar activity, and differential
rotation. Their detailed examination provides a validation environment connecting solar
and stellar physics. Recent advances were made possible by state-of-the-art instruments,
facilities, and experiments such as the Synoptic Optical Long-term Investigations of
the Sun (SOLIS, Keller et al. 2003) program, High Accuracy Radial velocity Planet
Searcher (HARPS, Pepe et al. 2002), the Calar Alto high-Resolution search for M-dwarfs
with Exoearths with Near-infrared and optical Echelle Spectrographs (CARMENES,
Quirrenbach et al. 2018), and last but not least PEPSI (Strassmeier et al. 2015) The
last three instruments exploit during nighttime a spectral resolution that rivals high-
resolution solar spectroscopy, thus, facilitating close spectral comparisons between the
Sun and the stars. Synoptic full-disk data form space missions such as the Solar Dynamic
Observatory (SDO, Pesnell et al. 2012) enable us to relate spectral signatures from Sun-
as-a-star observations to activity and dynamics on the solar disk (e.g., Denker & Verma
2019). In this context, the present study of the 2017 August 21 eclipse serves as an
example demonstrating the power of high-resolution Sun-as-a-star spectroscopy.
Acknowledgments
PEPSI and SDI were made possible by longtime support of the Bundesministerium
für Bildung und Forschung (BMBF) for the collaborative research projects 05AL2BA1/3
and 05A08BAC. This study was supported by grant DE 787/5-1 of the Deutsche
Forschungsgemeinschaft (DFG). The support by the European Commission’s Horizon
2020 Program under grant agreements 824064 (ESCAPE – European Science
Cluster of Astronomy & Particle physics ESFRI research infrastructures) and 824135
(SOLARNET – Integrating High Resolution Solar Physics) is highly appreciated. ED
Downloaded from https://www.cambridge.org/core. Leibniz-Institute for Astrophysics Potsdam, on 01 Oct 2020 at 11:23:40, subject to the Cambridge Core terms of
use, available at https://www.cambridge.org/core/terms. https://doi.org/10.1017/S1743921319010019480 E. Dineva et al.
is grateful for the financial support from the Deutsche Akademische Austauschdienst
(DAAD) in form of a doctoral scholarship. This research made use of NASA’s
Astrophysics Data System (ADS).
References
Aimanova, G. K. & Gulyaev, R. A. 1976, Soviet Astron., 20, 201
Athay, R. G. 1976, The Solar Chromosphere and Corona: Quiet Sun, Astrophys. Space Sci. Lib.,
53, D. Reidel Publishing Company, Dordrecht, Holland
Bartlett, J. L., Frouard, M. R. C., Bell, S., et al. 2019, in Celebrating the 2017 Great American
Eclipse: Lessons Learned from the Path of Totality, S. R. Buxner, L. Shore, & J. B. Jensen
(eds.), ASP-CS, 516, 251
Bazin, C. & Koutchmy, S. 2013, J. Adv. Res., 4, 307
Beeck, B., Collet, R., Steffen, M., et al. 2012, A&A, 539, A121
Bruls, J. H. M. J., Rutten, R. J., & Shchukina, N. G. 1992, A&A, 265, 237
Cauley, P. W., Kuckein, C., Redfield, S., et al. 2018, Astron. J., 156, 189
Czesla, S., Klocová, T., Khalafinejad, S., et al. 2015, A&A, 582, A51
Davis, S. P., Abrams, M. C., & Brault, J. W. 2001, Fourier Transform Spectrometry, Academic
Press, San Diego, California
Denker, C. & Verma, M. 2019, SoPh, 294, 71
Dunn, R. B., Evans, J. W., Jefferies, J. T., et al. 1968, ApJSS, 15, 275
Gudiksen, B. V., Carlsson, M., Hansteen, V. H., et al. 2011, A&A, 531, A154
Habbal, S. R., Druckmüller, M., Morgan, H., et al. 2011, ApJ, 734, 120
Haywood, R. D., Collier Cameron, A., Unruh, Y. C., et al. 2016, MNRAS, 457, 3637
Hill, J. M., Green, R. F., & Slagle, J. H. 2006, in Ground-based and Airborne Telescopes, L. M.
Stepp (ed.), Proc. SPIE, 6267, 62670Y
Izumiura, H. 1999, in Observational Astrophysics in Asia and its Future, P. S. Chen (ed.), 4, 77
Keller, C. U., Harvey, J. W., & Giampapa, M. S. 2003, in Innovative Telescopes and
Instrumentation for Solar Astrophysics, S. L. Keil & S. V. Avakyan (eds.), Proc. SPIE,
4853, 194
Koutchmy, S., Baudin, F., Abdi, S., et al. 2019, A&A, in press
Leenaarts, J., Rutten, R. J., Reardon, K., et al. 2010, ApJ, 709, 1362
Lendl, M., Cubillos, P. E., Hagelberg, J., et al. 2017, A&A, 606, A18
Nikolov, N., Sing, D. K., Gibson, N. P., et al. 2016, ApJ, 832, 191
Pasachoff, J. M. 2009, Nature, 459, 789
Pepe, F., Mayor, M., Rupprecht, G., et al. 2002, Messenger, 110, 9
Pesnell, W. D., Thompson, B. J., & Chamberlin, P. C. 2012, SoPh, 275, 3
Quirrenbach, A., Amado, P. J., Ribas, I., et al. 2018, in Ground-based and Airborne
Instrumentation for Astronomy VII, C. J. Evans, L. Simard, & H. Takami (eds.), Proc.
SPIE, 10702, 107020W
Reiners, A., Lemke, U., Bauer, F., et al. 2016, A&A, 595, A26
Rutten, R. J. 2007, in The Physics of Chromospheric Plasmas, P. Heinzel, I. Dorotovič, &
R. J. Rutten (eds.), ASP-CS, 368, 27
Saito, K. & Tandberg-Hanssen, E. 1973, SoPh, 31, 105
Schleicher, H., Wiedemann, G., Wöhl, H., et al. 2004, A&A, 425, 1119
Strassmeier, K. G., Ilyin, I., Järvinen, A., et al. 2015, AN, 336, 324
Strassmeier, K. G., Ilyin, I., & Steffen, M. 2018, A&A, 612, A44
Takeda, Y., Ohshima, O., Kambe, E., et al. 2015, PASJ, 67, 10
Verma, M. 2018, A&A, 612, A101
Verma, M., Denker, C., Balthasar, H., et al. 2016, A&A, 596, A3
Vernazza, J. E., Avrett, E. H., & Loeser, R. 1981, ApJSS, 45, 635
Yan, F., Fosbury, R. A. E., Petr-Gotzens, M. G., et al. 2015, A&A, 574, A94
Downloaded from https://www.cambridge.org/core. Leibniz-Institute for Astrophysics Potsdam, on 01 Oct 2020 at 11:23:40, subject to the Cambridge Core terms of
use, available at https://www.cambridge.org/core/terms. https://doi.org/10.1017/S1743921319010019You can also read