Supplemental Information Package and Non-GAAP Reconciliations - First Quarter March 31, 2021 - Crown Castle
←
→
Page content transcription
If your browser does not render page correctly, please read the page content below

Supplemental Information Package
 and Non-GAAP Reconciliations
     First Quarter • March 31, 2021

                                      The pathway to possible.
                                              CrownCastle.com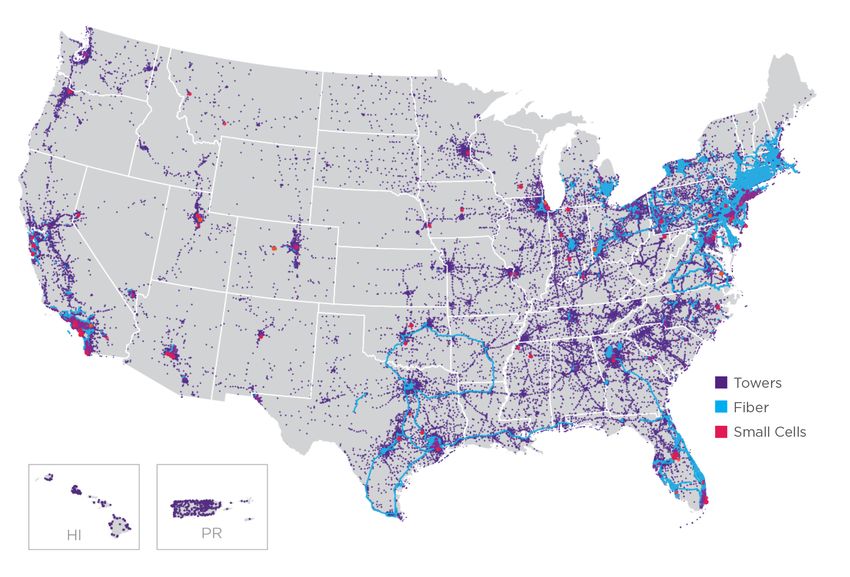
Crown Castle International Corp.
                                                      First Quarter 2021

                                                TABLE OF CONTENTS
                                                                                   Page
Company Overview
    Company Profile                                                                 3
    Strategy                                                                        3
    AFFO per Share                                                                  5
    Asset Portfolio Footprint                                                       5
    General Company Information                                                     6
    Research Coverage                                                               7
    Historical Common Stock Data                                                    7
    Portfolio and Financial Highlights                                              8
    Outlook                                                                         9
Financials & Metrics
    Condensed Consolidated Balance Sheet                                            11
    Condensed Consolidated Statement of Operations                                  12
    Segment Operating Results                                                       13
    Fiber Segment Site Rental Revenues Summary                                      13
    FFO and AFFO Reconciliations                                                    14
    Condensed Consolidated Statement of Cash Flows                                  15
    Components of Changes in Site Rental Revenues                                   16
    Summary of Straight-Lined and Prepaid Rent Activity                             16
    Summary of Capital Expenditures                                                 17
    Lease Renewal and Lease Distribution                                            17
    Consolidated Tenant Overview                                                    18
    Fiber Solutions Revenue Mix                                                     18
    Segment Cash Yields on Invested Capital                                         19
    Consolidated Return on Invested Capital                                         19
Asset Portfolio Overview
    Summary of Tower Portfolio by Vintage                                           20
    Portfolio Overview                                                              21
    Ground Interest Overview                                                        23
    Ground Interest Activity                                                        23
Capitalization Overview
    Capitalization Overview                                                         24
    Debt Maturity Overview                                                          25
    Liquidity Overview                                                              26
    Maintenance and Financial Covenants                                             27
    Interest Rate Sensitivity                                                       28
Appendix                                                                            29

                                                               1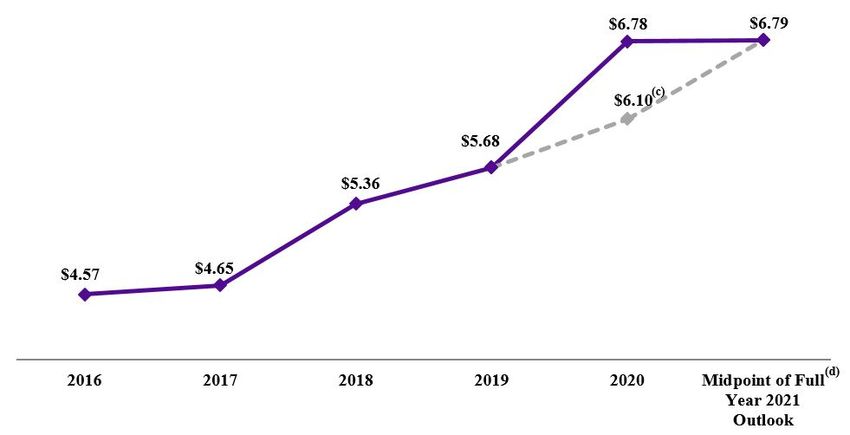
Crown Castle International Corp.
                                                            First Quarter 2021

Cautionary Language Regarding Forward-Looking Statements
This supplemental information package ("Supplement") contains forward-looking statements and information that are based on our
management's current expectations as of the date of this Supplement. Statements that are not historical facts are hereby identified as
forward-looking statements. Words such as "Outlook," "guide," "forecast," "estimate," "anticipate," "project," "plan," "intend,"
"believe," "expect," "likely," "predicted," "positioned," and any variations of these words and similar expressions are intended to
identify such forward looking statements. Such statements include plans, projections and estimates regarding (1) demand for data and
our communications infrastructure, and benefits derived therefrom, (2) cash flow growth, (3) tenant additions, (4) our Outlook for full
year 2021, (5) our strategy, (6) strategic position of our assets, (7) revenues from tenant contracts, (8) the expansion of our small cells
and fiber networks, including revenues generated therefrom, (9) ground lease expenses from existing ground leases, (10) the
recurrence of Nontypical Items, (11) the impact of our recent tower leasing agreement with Verizon and (12) availability under our
2016 Revolver.

Such forward-looking statements are subject to certain risks, uncertainties and assumptions, including, but not limited to, prevailing
market conditions. Should one or more of these or other risks or uncertainties materialize, or should underlying assumptions prove
incorrect, actual results may vary materially from those expected. Crown Castle assumes no obligation to update publicly any forward-
looking statements, whether as a result of new information, future events or otherwise. More information about potential risk factors
which could affect our results is included in our filings with the Securities and Exchange Commission ("SEC"). Our filings with the
SEC are available through the SEC website at www.sec.gov or through our investor relations website at investor.crowncastle.com. We
use our investor relations website to disclose information about us that may be deemed to be material. We encourage investors, the
media and others interested in us to visit our investor relations website from time to time to review up-to-date information or to sign
up for e-mail alerts to be notified when new or updated information is posted on the site.

The components of financial information presented herein, both historical and forward looking, may not sum due to rounding.
Definitions and reconciliations of non-GAAP financial measures, segment measures and other calculations are provided in the
Appendix to this Supplement.

As used herein, the term "including" and any variation thereof, means "including without limitation." The use of the word "or" herein
is not exclusive.

                                                                     2
Crown Castle International Corp.
First Quarter 2021
COMPANY ASSET PORTFOLIO CAPITALIZATION
FINANCIALS & METRICS APPENDIX
OVERVIEW OVERVIEW OVERVIEW
COMPANY PROFILE
Crown Castle International Corp. (to which the terms "Crown Castle," "CCIC," "we," "our," "the Company" or "us" as used herein
refer) owns, operates and leases shared communications infrastructure that is geographically dispersed throughout the U.S., including
(1) more than 40,000 towers and other structures, such as rooftops (collectively, "towers"), and (2) approximately 80,000 route miles
of fiber primarily supporting small cell networks ("small cells") and fiber solutions. We refer to our towers, fiber and small cells assets
collectively as "communications infrastructure," and to our customers on our communications infrastructure as "tenants." Our towers
have a significant presence in each of the top 100 basic trading areas, and the majority of our small cells and fiber are located in major
metropolitan areas, including a presence within every major U.S. market.
Our operating segments consist of (1) Towers and (2) Fiber, which includes both small cells and fiber solutions. Our core business is
providing access, including space or capacity, to our shared communications infrastructure via long-term contracts in various forms,
including lease, license, sublease and service agreements (collectively, "tenant contracts"). We seek to increase our site rental revenues
by adding more tenants on our shared communications infrastructure, which we expect to result in significant incremental cash flows
due to our low incremental operating costs.
We operate as a Real Estate Investment Trust ("REIT") for U.S. federal income tax purposes.
STRATEGY
As a leading provider of shared communications infrastructure in the U.S., our strategy is to create long-term stockholder value via a
combination of (1) growing cash flows generated from our existing portfolio of communications infrastructure, (2) returning a
meaningful portion of our cash generated by operating activities to our common stockholders in the form of dividends and (3)
investing capital efficiently to grow cash flows and long-term dividends per share. Our strategy is based, in part, on our belief that the
U.S. is the most attractive market for shared communications infrastructure investment with the greatest long-term growth potential.
We measure our efforts to create "long-term stockholder value" by the combined payment of dividends to stockholders and growth in
our per-share results. The key elements of our strategy are to:
• Grow cash flows from our existing communications infrastructure. We are focused on maximizing the recurring site rental
cash flows generated from providing our tenants with long-term access to our shared infrastructure assets, which we
believe is the core driver of value for our stockholders. Tenant additions or modifications of existing tenant equipment
(collectively, "tenant additions") enable our tenants to expand coverage and capacity in order to meet increasing demand
for data, while generating high incremental returns for our business. We believe our product offerings of towers and small
cells provide a comprehensive solution to our wireless tenants' growing network needs through our shared communications
infrastructure model, which is an efficient and cost-effective way to serve our tenants. Additionally, we believe our ability
to share our fiber assets across multiple tenants to deploy both small cells and offer fiber solutions allows us to generate
cash flows and increase stockholder return.
• Return cash generated by operating activities to common stockholders in the form of dividends. We believe that
distributing a meaningful portion of our cash generated by operating activities appropriately provides common
stockholders with increased certainty for a portion of expected long-term stockholder value while still allowing us to retain
sufficient flexibility to invest in our business and deliver growth. We believe this decision reflects the translation of the
high-quality, long-term contractual cash flows of our business into stable capital returns to common stockholders.
• Invest capital efficiently to grow cash flows and long-term dividends per share. In addition to adding tenants to existing
communications infrastructure, we seek to invest our available capital, including the net cash generated by our operating
activities and external financing sources, in a manner that will increase long-term stockholder value on a risk-adjusted
basis. These investments include constructing and acquiring new communications infrastructure that we expect will
generate future cash flow growth and attractive long-term returns by adding tenants to those assets over time. Our historical
investments have included the following (in no particular order):
◦ construction of towers, fiber and small cells;
◦ acquisitions of towers, fiber and small cells;
◦ acquisitions of land interests (which primarily relate to land assets under towers);
◦ improvements and structural enhancements to our existing communications infrastructure;
◦ purchases of shares of our common stock from time to time; and
◦ purchases, repayments or redemptions of our debt.
3Crown Castle International Corp.
First Quarter 2021
COMPANY ASSET PORTFOLIO CAPITALIZATION
FINANCIALS & METRICS APPENDIX
OVERVIEW OVERVIEW OVERVIEW
Our strategy to create long-term stockholder value is based on our belief that there will be considerable future demand for our
communications infrastructure based on the location of our assets and the rapid growth in the demand for data. We believe that such
demand for our communications infrastructure will continue, will result in growth of our cash flows due to tenant additions on our
existing communications infrastructure, and will create other growth opportunities for us, such as demand for newly constructed or
acquired communications infrastructure, as described above. Further, we seek to augment the long-term value creation associated with
growing our recurring site rental cash flows by offering certain ancillary site development and installation services within our Towers
segment.
4Crown Castle International Corp.
First Quarter 2021
COMPANY ASSET PORTFOLIO CAPITALIZATION
FINANCIALS & METRICS APPENDIX
OVERVIEW OVERVIEW OVERVIEW
AFFO PER SHARE(a)(b)
ASSET PORTFOLIO FOOTPRINT
(a) See "Non-GAAP Financial Measures, Segment Measures and Other Calculations" for further information and reconciliation of non-GAAP financial measures to
net income (loss), as computed in accordance with GAAP.
(b) Attributable to CCIC common stockholders.
(c) Excludes the impact of nontypical items that were completed in fourth quarter 2020 ("Nontypical Items"), as described in our press release dated January 27, 2021
and reconciled in "Non-GAAP Financial Measures, Segment Measures and Other Calculations" herein.
(d) Calculated based on midpoint of full year 2021 Outlook, issued on April 21, 2021.
5Crown Castle International Corp.
First Quarter 2021
COMPANY ASSET PORTFOLIO CAPITALIZATION
FINANCIALS & METRICS APPENDIX
OVERVIEW OVERVIEW OVERVIEW
GENERAL COMPANY INFORMATION
Principal executive offices 1220 Augusta Drive, Suite 600, Houston, TX 77057
Common shares trading symbol CCI
Stock exchange listing New York Stock Exchange
Fiscal year ending date December 31
Fitch - Long Term Issuer Default Rating BBB+
Moody’s - Long Term Corporate Family Rating Baa3
Standard & Poor’s - Long Term Local Issuer Credit Rating BBB-
Note: These credit ratings may not reflect the potential risks relating to the structure or trading of the Company’s securities and are provided solely
for informational purposes. Credit ratings are not recommendations to buy, sell or hold any security, and may be revised or withdrawn at any time
by the issuing organization in its sole discretion. The Company does not undertake any obligation to maintain the ratings or to advise of any change
in the ratings. Each agency’s rating should be evaluated independently of any other agency’s rating. An explanation of the significances of the
ratings can be obtained from each of the ratings agencies.
EXECUTIVE MANAGEMENT TEAM
Years with
Name Age Company Position
Jay A. Brown 48 21 President and Chief Executive Officer
Daniel K. Schlanger 47 5 Executive Vice President and Chief Financial Officer
Robert C. Ackerman 68 22 Executive Vice President and Chief Operating Officer - Towers
Christopher D. Levendos 53 2 Executive Vice President and Chief Operating Officer - Fiber
Kenneth J. Simon 60 5 Executive Vice President and General Counsel
Michael J. Kavanagh 52 10 Executive Vice President and Chief Commercial Officer
Philip M. Kelley 48 23 Executive Vice President - Corporate Development and Strategy
Laura B. Nichol 60 6 Executive Vice President - Business Support
BOARD OF DIRECTORS
Name Position Committees Age Years as Director
(a)
J. Landis Martin Chair NCG 75 25
P. Robert Bartolo Director Audit, Compensation 49 7
Cindy Christy Director Compensation, NCG(a), Strategy 55 13
Ari Q. Fitzgerald Director Compensation, NCG(a), Strategy 58 18
Anthony J. Melone Director Audit, NCG(a), Strategy 60 5
Jay A. Brown Director 48 4
Robert E. Garrison II Director Audit, Compensation 79 15
Andrea J. Goldsmith Director NCG(a), Strategy 56 3
Lee W. Hogan Director Audit, Compensation, Strategy 76 20
Edward C. Hutcheson Jr. Director Strategy 75 25
Tammy K. Jones Director Audit, NCG(a) 55Crown Castle International Corp.
First Quarter 2021
COMPANY ASSET PORTFOLIO CAPITALIZATION
FINANCIALS & METRICS APPENDIX
OVERVIEW OVERVIEW OVERVIEW
RESEARCH COVERAGE
Equity Research
Bank of America Barclays Citigroup
David Barden Tim Long Michael Rollins
(646) 855-1320 (212) 526-4043 (212) 816-1116
Cowen and Company Credit Suisse Deutsche Bank
Colby Synesael Sami Badri Matthew Niknam
(646) 562-1355 (212) 538-1727 (212) 250-4711
Goldman Sachs Green Street Jefferies
Brett Feldman David Guarino Jonathan Petersen
(212) 902-8156 (949) 640-8780 (212) 284-1705
JPMorgan KeyBanc LightShed Partners
Philip Cusick Brandon Nispel Walter Piecyk
(212) 622-1444 (503) 821-3871 (646) 450-9258
MoffettNathanson Morgan Stanley New Street Research
Nick Del Deo Simon Flannery Spencer Kurn
(212) 519-0025 (212) 761-6432 (212) 921-2067
Oppenheimer & Co. Raymond James RBC Capital Markets
Timothy Horan Ric Prentiss Jonathan Atkin
(212) 667-8137 (727) 567-2567 (415) 633-8589
Truist Securities UBS Wells Fargo Securities, LLC
Greg Miller Batya Levi Eric Luebchow
(212) 303-4169 (212) 713-8824 (312) 630-2386
Wolfe Research
Jeff Kvaal
(646) 582-9350
Rating Agencies
Fitch Moody’s Standard & Poor’s
John Culver Lori Marks Ryan Gilmore
(312) 368-3216 (212) 553-1098 (212) 438-0602
HISTORICAL COMMON STOCK DATA
Three Months Ended
(in millions, except per share amounts) 3/31/21 12/31/20 9/30/20 6/30/20 3/31/20
High price(a) $ 175.34 $ 169.25 $ 175.76 $ 171.43 $ 162.26
Low price(a) $ 144.87 $ 149.90 $ 152.38 $ 129.53 $ 110.34
Period end closing price(b) $ 172.13 $ 157.83 $ 163.69 $ 163.28 $ 139.91
Dividends paid per common share $ 1.33 $ 1.33 $ 1.20 $ 1.20 $ 1.20
Volume weighted average price for the period(a) $ 158.79 $ 159.13 $ 161.51 $ 156.57 $ 141.84
Common shares outstanding, at period end 432 431 431 417 417
Market value of outstanding common shares, at period end(c) $ 74,392 $ 68,074 $ 70,597 $ 68,047 $ 58,309
(a) Based on the sales price, adjusted for common stock dividends, as reported by Bloomberg.
(b) Based on the period end closing price, adjusted for common stock dividends, as reported by Bloomberg.
(c) Period end market value of outstanding common shares is calculated as the product of (1) shares of common stock outstanding at period end and (2) closing share
price at period end, adjusted for common stock dividends, as reported by Bloomberg.
7Crown Castle International Corp.
First Quarter 2021
ASSET PORTFOLIO CAPITALIZATION
COMPANY OVERVIEW FINANCIALS & METRICS APPENDIX
OVERVIEW OVERVIEW
SUMMARY PORTFOLIO HIGHLIGHTS
(as of March 31, 2021)
Towers
Number of towers (in thousands)(a) 40
Average number of tenants per tower 2.1
Remaining contracted tenant receivables ($ in billions)(b)(c) $ 21
Weighted average remaining tenant contract term (years)(d) 5
Percent of towers in the Top 50 / 100 Basic Trading Areas 56% / 71%
Percent of ground leased / owned(e) 59% / 41%
Weighted average maturity of ground leases (years)(e)(f) 36
Fiber
Number of route miles of fiber (in thousands) 80
Remaining contracted tenant receivables ($ in billions)(b) $ 6
Weighted average remaining tenant contract term (years)(d) 5
SUMMARY FINANCIAL HIGHLIGHTS
Three Months Ended March 31,
(in millions, except per share amounts) 2021 2020
Operating Data:
Net revenues
Site rental $ 1,369 $ 1,310
Services and other 116 111
Net revenues $ 1,485 $ 1,421
Costs of operations (exclusive of depreciation, amortization and accretion)
Site rental $ 381 $ 375
Services and other 81 99
Total cost of operations $ 462 $ 474
Net income (loss) attributable to CCIC common stockholders $ 121 $ 157
Net income (loss) attributable to CCIC common stockholders per share—diluted(g) $ 0.28 $ 0.38
Non-GAAP Data(h):
Adjusted EBITDA $ 897 $ 814
FFO(i) 519 547
AFFO(i) 738 593
AFFO per share(g)(i) $ 1.71 $ 1.42
(a) Excludes third-party land interests.
(b) Excludes renewal terms at tenants' option.
(c) Excludes the impact of the Company’s long-term tower leasing agreement with Verizon, effective April 1, 2021, which will be reflected beginning with the
Company’s second quarter 2021 Supplemental Information Package.
(d) Excludes renewal terms at tenants' option, weighted by site rental revenues.
(e) Weighted by Towers segment site rental gross margin exclusive of straight-lined revenues, amortization of prepaid rent, and straight-lined expenses.
(f) Includes all renewal terms at the Company's option.
(g) Based on diluted weighted-average common shares outstanding of 433 million and 418 million for the three months ended March 31, 2021 and 2020, respectively.
(h) See "Non-GAAP Financial Measures, Segment Measures and Other Calculations" for further information and reconciliation of non-GAAP financial measures to
net income (loss), as computed in accordance with GAAP.
(i) Attributable to CCIC common stockholders.
8Crown Castle International Corp.
First Quarter 2021
ASSET PORTFOLIO CAPITALIZATION
COMPANY OVERVIEW FINANCIALS & METRICS APPENDIX
OVERVIEW OVERVIEW
SUMMARY FINANCIAL HIGHLIGHTS (CONTINUED)
Three Months Ended March 31,
(in millions) 2021 2020
Summary Cash Flow Data(a):
Net cash provided by (used for) operating activities $ 584 $ 653
Net cash provided by (used for) investing activities(b) (311) (468)
Net cash provided by (used for) financing activities (217) (50)
(in millions) March 31, 2021 December 31, 2020
Balance Sheet Data (at period end):
Cash and cash equivalents $ 254 $ 232
Property and equipment, net 15,149 15,162
Total assets 38,752 38,768
Total debt and other long-term obligations 19,872 19,280
Total CCIC stockholders' equity 8,986 9,461
Three Months Ended
March 31, 2021
Other Data:
Net debt to last quarter annualized Adjusted EBITDA(c) 5.5 x
Dividend per common share $ 1.33
OUTLOOK FOR FULL YEAR 2021
(in millions, except per share amounts) Full Year 2021(d)
Site rental revenues $5,672 to $5,717
Site rental cost of operations(e) $1,538 to $1,583
Net income (loss) $1,044 to $1,124
Net income (loss) per share—diluted(f)(g) $2.41 to $2.59
Adjusted EBITDA(h) $3,734 to $3,779
Interest expense and amortization of deferred financing costs(i) $633 to $678
FFO(g)(h) $2,690 to $2,735
AFFO(g)(h) $2,923 to $2,968
AFFO per share(f)(g)(h) $6.74 to $6.85
(a) Includes impacts of restricted cash. See the condensed consolidated statement of cash flows for further information.
(b) Includes net cash used for acquisitions of approximately $4 million and $13 million for the three months ended March 31, 2021 and 2020, respectively.
(c) See the "Net Debt to Last Quarter Annualized Adjusted EBITDA Calculation" in the Appendix.
(d) As issued on April 21, 2021.
(e) Exclusive of depreciation, amortization and accretion.
(f) The assumption for diluted weighted-average common shares outstanding for full year 2021 Outlook is based on the diluted common shares outstanding as of
March 31, 2021.
(g) Attributable to CCIC common stockholders.
(h) See "Non-GAAP Financial Measures, Segment Measures and Other Calculations" for further information and reconciliation of non-GAAP financial measures to
net income (loss), as computed in accordance with GAAP.
(i) See the reconciliation of "Components of Current Outlook for Interest Expense and Amortization of Deferred Financing Costs" in the Appendix.
9Crown Castle International Corp.
First Quarter 2021
ASSET PORTFOLIO CAPITALIZATION
COMPANY OVERVIEW FINANCIALS & METRICS APPENDIX
OVERVIEW OVERVIEW
COMPONENTS OF CHANGES IN SITE RENTAL REVENUES FOR FULL YEAR 2020 ACTUAL AND FULL YEAR 2021 OUTLOOK
Full Year 2020 Full Year 2021
(dollars in millions) Actual Outlook(a)
Components of changes in site rental revenues:
Prior year site rental revenues exclusive of straight-lined revenues associated with fixed
escalators(b)(c) $5,013 $5,298
New leasing activity(b)(c) 376 375-405
Escalators 90 90-100
Non-renewals (183) (180)-(160)
Organic Contribution to Site Rental Revenues(d) 283 295-335
Impact from full year straight-lined revenues associated with fixed escalators 22 60-80
Acquisitions(e) 2Crown Castle International Corp.
First Quarter 2021
COMPANY ASSET PORTFOLIO CAPITALIZATION
FINANCIALS & METRICS APPENDIX
OVERVIEW OVERVIEW OVERVIEW
CONDENSED CONSOLIDATED BALANCE SHEET (Unaudited)
(in millions, except par values) March 31, 2021 December 31, 2020
ASSETS
Current assets:
Cash and cash equivalents $ 254 $ 232
Restricted cash 179 144
Receivables, net 412 431
Prepaid expenses 115 95
Other current assets 216 202
Total current assets 1,176 1,104
Deferred site rental receivables 1,389 1,408
Property and equipment, net 15,149 15,162
Operating lease right-of-use assets 6,514 6,464
Goodwill 10,078 10,078
Other intangible assets, net 4,324 4,433
Other assets, net 122 119
Total assets $ 38,752 $ 38,768
LIABILITIES AND EQUITY
Current liabilities:
Accounts payable $ 187 $ 230
Accrued interest 107 199
Deferred revenues 814 704
Other accrued liabilities 271 378
Current maturities of debt and other obligations 159 129
Current portion of operating lease liabilities 332 329
Total current liabilities 1,870 1,969
Debt and other long-term obligations 19,713 19,151
Operating lease liabilities 5,856 5,808
Other long-term liabilities 2,327 2,379
Total liabilities 29,766 29,307
Commitments and contingencies
CCIC stockholders' equity:
Common stock, $0.01 par value; 600 shares authorized; shares issued and outstanding: March
31, 2021—432 and December 31, 2020—431 4 4
Additional paid-in capital 17,917 17,933
Accumulated other comprehensive income (loss) (3) (4)
Dividends/distributions in excess of earnings (8,932) (8,472)
Total equity 8,986 9,461
Total liabilities and equity $ 38,752 $ 38,768
11Crown Castle International Corp.
First Quarter 2021
COMPANY ASSET PORTFOLIO CAPITALIZATION
FINANCIALS & METRICS APPENDIX
OVERVIEW OVERVIEW OVERVIEW
CONDENSED CONSOLIDATED STATEMENT OF OPERATIONS (Unaudited)
Three Months Ended March 31,
(in millions, except per share amounts) 2021 2020
Net revenues:
Site rental $ 1,369 $ 1,310
Services and other 116 111
Net revenues 1,485 1,421
Operating expenses:
Costs of operations(a):
Site rental 381 375
Services and other 81 99
Selling, general and administrative 164 175
Asset write-down charges 3 4
Acquisition and integration costs — 5
Depreciation, amortization and accretion 408 399
Total operating expenses 1,037 1,057
Operating income (loss) 448 364
Interest expense and amortization of deferred financing costs (170) (175)
Gains (losses) on retirement of long-term obligations (143) —
Interest income 1 1
Other income (expense) (8) —
Income (loss) before income taxes 128 190
Benefit (provision) for income taxes (7) (5)
Net income (loss) 121 185
Dividends/distributions on preferred stock — (28)
Net income (loss) attributable to CCIC common stockholders $ 121 $ 157
Net income (loss) attributable to CCIC common stockholders, per common share:
Net income (loss) attributable to CCIC common stockholders, basic $ 0.28 $ 0.38
Net income (loss) attributable to CCIC common stockholders, diluted $ 0.28 $ 0.38
Weighted-average common shares outstanding:
Basic 432 416
Diluted 433 418
(a) Exclusive of depreciation, amortization and accretion shown separately.
12Crown Castle International Corp.
First Quarter 2021
COMPANY FINANCIALS & METRICS ASSET PORTFOLIO OVERVIEW CAPITALIZATION OVERVIEW APPENDIX
OVERVIEW
SEGMENT OPERATING RESULTS
Three Months Ended March 31, 2021 Three Months Ended March 31, 2020
Consolidated Consolidated
(in millions) Towers Fiber Other Total Towers Fiber Other Total
Segment site rental revenues $ 895 $ 474 $ 1,369 $ 867 $ 443 $ 1,310
Segment services and other revenues 111 5 116 108 3 111
Segment revenues 1,006 479 1,485 975 446 1,421
Segment site rental cost of operations 212 161 373 214 152 366
Segment services and other cost of operations 76 3 79 95 2 97
(a)(b)
Segment cost of operations 288 164 452 309 154 463
Segment site rental gross margin(c) 683 313 996 653 291 944
Segment services and other gross margin(c) 35 2 37 13 1 14
Segment selling, general and administrative expenses(b) 25 45 70 24 51 75
Segment operating profit(c) 693 270 963 642 241 883
Other selling, general and administrative expenses(b) $ 66 66 $ 70 70
Stock-based compensation expense 33 33 36 36
Depreciation, amortization and accretion 408 408 399 399
Interest expense and amortization of deferred financing costs 170 170 175 175
Other (income) expenses to reconcile to income (loss) before
income taxes(d) 158 158 13 13
Income (loss) before income taxes $ 128 $ 190
FIBER SEGMENT SITE RENTAL REVENUES SUMMARY
Three Months Ended March 31,
2021 2020
(in millions) Fiber Solutions Small Cells Total Fiber Solutions Small Cells Total
Site rental revenues $ 331 $ 143 $ 474 $ 312 $ 131 $ 443
(a) Exclusive of depreciation, amortization and accretion shown separately.
(b) Segment cost of operations excludes (1) stock-based compensation expense of $5 million and $6 million for the three months ended March 31, 2021 and 2020, respectively and (2) prepaid lease purchase price
adjustments of $5 million for each of the three months ended March 31, 2021 and 2020. Selling, general and administrative expenses exclude stock-based compensation expense of $28 million and $30 million for the
three months ended March 31, 2021 and 2020, respectively.
(c) See "Non-GAAP Financial Measures, Segment Measures and Other Calculations" for a discussion of our definitions of segment site rental gross margin, segment services and other gross margin and segment operating
profit.
(d) See condensed consolidated statement of operations for further information.
13Crown Castle International Corp.
First Quarter 2021
COMPANY ASSET PORTFOLIO CAPITALIZATION
FINANCIALS & METRICS APPENDIX
OVERVIEW OVERVIEW OVERVIEW
FFO AND AFFO RECONCILIATIONS
Three Months Ended March 31,
(in millions, except per share amounts) 2021 2020
Net income (loss) $ 121 $ 185
Real estate related depreciation, amortization and accretion 395 386
Asset write-down charges 3 4
Dividends/distributions on preferred stock — (28)
FFO(a)(b)(c)(d) $ 519 $ 547
(e)
Weighted-average common shares outstanding—diluted 433 418
FFO per share(a)(b)(c)(d) $ 1.20 $ 1.31 (e)
FFO (from above) $ 519 $ 547
Adjustments to increase (decrease) FFO:
Straight-lined revenue 10 (14)
Straight-lined expense 19 20
Stock-based compensation expense 33 36
Non-cash portion of tax provision 7 4
Non-real estate related depreciation, amortization and accretion 13 13
Amortization of non-cash interest expense 3 1
Other (income) expense 8 —
(Gains) losses on retirement of long-term obligations 143 —
Acquisition and integration costs — 5
Sustaining capital expenditures (17) (21)
AFFO(a)(b)(c)(d) $ 738 $ 593
(e)
Weighted-average common shares outstanding—diluted 433 418
AFFO per share(a)(b)(c)(d) $ 1.71 $ 1.42 (e)
(a) See "Non-GAAP Financial Measures, Segment Measures and Other Calculations" for a discussion of our definitions of FFO and AFFO, including per share
amounts.
(b) FFO and AFFO are reduced by cash paid for preferred stock dividends during the period in which they are paid.
(c) Attributable to CCIC common stockholders.
(d) The above reconciliation excludes line items included in our definition which are not applicable for the periods shown.
(e) For the period ended March 31, 2020, the diluted weighted-average common shares outstanding does not include any assumed conversions of preferred stock in
the share count.
14Crown Castle International Corp.
First Quarter 2021
COMPANY ASSET PORTFOLIO CAPITALIZATION
FINANCIALS & METRICS APPENDIX
OVERVIEW OVERVIEW OVERVIEW
CONDENSED CONSOLIDATED STATEMENT OF CASH FLOWS (Unaudited)
Three Months Ended March 31,
(in millions) 2021 2020
Cash flows from operating activities:
Net income (loss) $ 121 $ 185
Adjustments to reconcile net income (loss) to net cash provided by (used for) operating activities:
Depreciation, amortization and accretion 408 399
(Gains) losses on retirement of long-term obligations 143 —
Amortization of deferred financing costs and other non-cash interest, net 3 1
Stock-based compensation expense 33 37
Asset write-down charges 3 4
Deferred income tax (benefit) provision 1 1
Other non-cash adjustments, net 10 —
Changes in assets and liabilities, excluding the effects of acquisitions:
Increase (decrease) in liabilities (146) (68)
Decrease (increase) in assets 8 94
Net cash provided by (used for) operating activities 584 653
Cash flows from investing activities:
Capital expenditures (302) (447)
Payments for acquisitions, net of cash acquired (4) (13)
Other investing activities, net (5) (8)
Net cash provided by (used for) investing activities (311) (468)
Cash flows from financing activities:
Proceeds from issuance of long-term debt 3,237 —
Principal payments on debt and other long-term obligations (1,026) (26)
Purchases and redemptions of long-term debt (1,789) —
Borrowings under revolving credit facility 580 1,340
Payments under revolving credit facility (290) (595)
Net borrowings (repayments) under commercial paper program (245) (155)
Payments for financing costs (29) —
Purchases of common stock (67) (73)
Dividends/distributions paid on common stock (588) (513)
Dividends/distributions paid on preferred stock — (28)
Net cash provided by (used for) financing activities (217) (50)
Net increase (decrease) in cash, cash equivalents, and restricted cash 56 135
Effect of exchange rate changes on cash 1 (1)
Cash, cash equivalents, and restricted cash at beginning of period 381 338
Cash, cash equivalents, and restricted cash at end of period $ 438 $ 472
Supplemental disclosure of cash flow information:
Interest paid 259 223
Income taxes paid — 1
15Crown Castle International Corp.
First Quarter 2021
COMPANY ASSET PORTFOLIO CAPITALIZATION
FINANCIALS & METRICS APPENDIX
OVERVIEW OVERVIEW OVERVIEW
COMPONENTS OF CHANGES IN SITE RENTAL REVENUES
Three Months Ended March 31,
(dollars in millions) 2021 2020
Components of changes in site rental revenues:
Prior year site rental revenues exclusive of straight-lined revenues associated with fixed
escalators(a)(b) $ 1,296 $ 1,225
New leasing activity(a)(b) 99 99
Escalators 23 22
Non-renewals (40) (51)
Organic Contribution to Site Rental Revenues(c) 82 71
Impact from straight-lined revenues associated with fixed escalators (10) 14
Acquisitions(d) 1 —
Other — —
Total GAAP site rental revenues $ 1,369 $ 1,310
Year-over-year changes in revenue:
Reported GAAP site rental revenues 4.5 %
Organic Contribution to Site Rental Revenues(c)(e) 6.3 %
SUMMARY OF SITE RENTAL STRAIGHT-LINED REVENUES AND EXPENSES ASSOCIATED WITH FIXED
ESCALATORS(f)
Three Months Ended March 31,
2021 2020
(dollars in millions) Towers Fiber Total Towers Fiber Total
Site rental straight-lined revenues $ (11) $ 1 $ (10) $ 13 $ 1 $ 14
Site rental straight-lined expenses 19 — 19 20 — 20
SUMMARY OF PREPAID RENT ACTIVITY(g)
Three Months Ended March 31,
2021 2020
(dollars in millions) Towers Fiber Total Towers Fiber Total
Prepaid rent additions $ 26 $ 59 $ 85 $ 64 $ 71 $ 135
Amortization of prepaid rent 79 57 136 73 53 126
(a) Includes revenues from amortization of prepaid rent in accordance with GAAP.
(b) Includes revenues from the construction of new small cell nodes, exclusive of straight-lined revenues related to fixed escalators.
(c) See "Non-GAAP Measures, Segment Measures and Other Calculations" for a discussion of our definition of Organic Contribution to Site Rental Revenues.
(d) Represents the initial contribution of recent acquisitions. The financial impact of recent acquisitions is excluded from Organic Contribution to Site Rental
Revenues until the one-year anniversary of the acquisition.
(e) Calculated as the percentage change from prior year site rental revenues, exclusive of straight-lined revenues associated with fixed escalations, compared to
Organic Contribution to Site Rental Revenues for the current period.
(f) In accordance with GAAP accounting, if payment terms call for fixed escalations or rent free periods, the revenue is recognized on a straight-line basis over the
fixed, non-cancelable term of the contract. Since the Company recognizes revenue on a straight-line basis, a portion of the site rental revenue in a given period
represents cash collected or contractually collectible in other periods.
(g) Reflects up-front consideration from long-term tenants and other deferred credits (commonly referred to as prepaid rent), and the amortization thereof for GAAP
revenue recognition purposes.
16Crown Castle International Corp.
First Quarter 2021
COMPANY ASSET PORTFOLIO CAPITALIZATION
FINANCIALS & METRICS APPENDIX
OVERVIEW OVERVIEW OVERVIEW
SUMMARY OF CAPITAL EXPENDITURES
Three Months Ended March 31,
2021 2020
(dollars in millions) Towers Fiber Other Total Towers Fiber Other Total
Discretionary:
Purchases of land interests $ 14 $ — $ — $ 14 $ 13 $ — $ — $ 13
Communications infrastructure
improvements and other capital
projects 35 225 11 271 87 319 7 413
Sustaining 2 12 3 17 5 9 7 21
Total $ 51 $ 237 $ 14 $ 302 $ 105 $ 328 $ 14 $ 447
PROJECTED REVENUES FROM TENANT CONTRACTS(a)(b)
Remaining
Nine Months Years Ending December 31,
(as of March 31, 2021; dollars in millions) 2021 2022 2023 2024 2025
Components of site rental revenues:
Site rental revenues exclusive of straight-line
associated with fixed escalators $ 4,155 $ 5,624 $ 5,666 $ 5,670 $ 5,725
Straight-lined site rental revenues associated with
fixed escalators (62) (157) (173) (150) (142)
GAAP site rental revenues $ 4,093 $ 5,467 $ 5,493 $ 5,520 $ 5,583
PROJECTED GROUND LEASE EXPENSES FROM EXISTING GROUND LEASES(c)
Remaining
Nine Months Years Ending December 31,
(as of March 31, 2021; dollars in millions) 2021 2022 2023 2024 2025
Components of ground lease expenses:
Ground lease expenses exclusive of straight-line
associated with fixed escalators $ 684 $ 929 $ 948 $ 967 $ 986
Straight-lined site rental ground lease expenses
associated with fixed escalators 52 57 45 34 23
GAAP ground lease expenses $ 736 $ 986 $ 993 $ 1,001 $ 1,009
(a) Based on tenant licenses as of March 31, 2021. All tenant licenses are assumed to renew for a new term no later than the respective current term end date, and as
such, projected revenues does not reflect the impact of estimated annual churn. CPI-linked tenant contracts are assumed to escalate at 3% per annum.
(b) Excludes the impact of the Company’s long-term tower leasing agreement with Verizon, effective April 1, 2021, which will be reflected beginning with the
Company’s second quarter 2021 Supplemental Information Package.
(c) Based on existing ground leases as of March 31, 2021. CPI-linked leases are assumed to escalate at 3% per annum.
17Crown Castle International Corp.
First Quarter 2021
COMPANY ASSET PORTFOLIO CAPITALIZATION
FINANCIALS & METRICS APPENDIX
OVERVIEW OVERVIEW OVERVIEW
ANNUALIZED RENTAL CASH PAYMENTS AT TIME OF RENEWAL(a)
Remaining
Nine Months Years Ending December 31,
(as of March 31, 2021; dollars in millions) 2021 2022 2023 2024 2025
AT&T $20 $28 $334 $20 $22
T-Mobile 37 352 261 75 89
Verizon(b) 29 46 50 507 80
All Others Combined 149 178 198 96 87
Total $235 $604 $843 $698 $278
LEGACY SPRINT RENTAL PAYMENTS AT TIME OF RENEWAL(a)(c)
Remaining
Nine Months Years Ending December 31,
(as of March 31, 2021; dollars in millions) 2021 2022 2023 2024 2025 Thereafter
Sprint collocated on sites with T-Mobile $15 $21 $105 $14 $23 $180
Other Sprint 10 13 105 8 21 187
Total legacy Sprint $25 $34 $210 $22 $44 $367
CONSOLIDATED TENANT OVERVIEW
Percentage of Q1 Weighted Average Long-Term Credit
2021 LQA Site Current Rating
(as of March 31, 2021) Rental Revenues Term Remaining(d) (S&P / Moody’s)
T-Mobile 34% 5 BB / Ba2
AT&T 22% 6 BBB / Baa2
Verizon 18% 4(b) BBB+ / Baa1
All Others Combined 26% 3 N/A
Total / Weighted Average 100% 5
FIBER SOLUTIONS REVENUE MIX
Percentage of Q1
2021 LQA Site
(as of March 31, 2021) Rental Revenues
Carrier(e) 39%
Education 13%
Healthcare 10%
Financial Services 10%
Other 28%
Total 100%
(a) Reflects lease renewals by year by tenant; dollar amounts represent annualized cash site rental revenues from assumed renewals or extensions as reflected in the
table "Projected Revenues from Tenant Contracts."
(b) Excludes the impact of the Company’s long-term tower leasing agreement with Verizon, effective April 1, 2021, which will be reflected beginning with the
Company’s second quarter 2021 Supplemental Information Package.
(c) As of March 31, 2021, there is a weighted average current term remaining of 5 years, weighted by site rental revenues, exclusive of straight-lined revenues and
amortization of prepaid rent, on Sprint licenses collocated on tower and small cell sites with T-Mobile.
(d) Weighted by site rental revenue revenues; excludes renewals at the tenants' option.
(e) Includes revenues derived from both wireless carriers and wholesale carriers.
18Crown Castle International Corp.
First Quarter 2021
COMPANY ASSET PORTFOLIO CAPITALIZATION
FINANCIALS & METRICS APPENDIX
OVERVIEW OVERVIEW OVERVIEW
SEGMENT CASH YIELDS ON INVESTED CAPITAL(a)
Q1 2021 LQA
(as of March 31, 2021; dollars in millions) Towers Fiber
Segment site rental gross margin(b) $ 2,732 $ 1,252
Less: Amortization of prepaid rent (316) (228)
Less: Site rental straight-lined revenues 44 (4)
Add: Site rental straight-lined expenses 76 —
Add: Indirect labor costs(c) — 87
Numerator $ 2,536 $ 1,107
Segment net investment in property and equipment(d) $ 12,972 $ 7,485
Segment investment in site rental contracts and tenant relationships 4,512 3,287
Segment investment in goodwill(e) 5,351 4,073
Segment net invested capital(a) $ 22,835 $ 14,845
Segment Cash Yield on Invested Capital(a) 11.1 % 7.5 %
CONSOLIDATED RETURN ON INVESTED CAPITAL(a)
(as of March 31, 2021; dollars in millions) Q1 2021 LQA
Adjusted EBITDA(f) $ 3,588
Cash taxes refunded (paid) 1
Numerator $ 3,589
Historical gross investment in property and equipment(g) $ 25,251
Historical gross investment in site rental contracts and tenant relationships 7,799
Historical gross investment in goodwill 10,078
Consolidated invested capital(a) $ 43,128
Consolidated Return on Invested Capital(a) 8.3 %
(a) See "Non-GAAP Financial Measures, Segment Measures and Other Calculations" for further information on, and definition and our calculation of segment cash
yields on invested capital, segment net invested capital, consolidated return on invested capital and consolidated invested capital.
(b) See "Segment Operating Results" and "Non-GAAP Financial Measures, Segment Measures and Other Calculations" for further information on, and definition and
our calculation of segment site rental gross margin.
(c) This adjustment represents indirect labor costs in the Fiber segment that are not capitalized, but that primarily support the Company's ongoing expansion of its
small cells and fiber networks that management expects to generate future revenues for the Company. Removal of these indirect labor costs presents segment cash
yield on invested capital on a direct cost basis, consistent with the methodology used by management when evaluating project-level investment opportunities.
(d) Segment investment in property and equipment excludes the impact of construction in process and non-productive assets (such as information technology assets
and buildings) and is reduced by the amount of prepaid rent received from customers (excluding any deferred credits recorded in connection with acquisitions).
(e) Segment investment in goodwill excludes the impact of certain assets and liabilities recorded in connection with acquisitions (primarily deferred credits).
(f) See "Reconciliations of Non-GAAP Financial Measures to Comparable GAAP Financial Measures and Other Calculations" for further information and
reconciliation of this non-GAAP financial measure to net income (loss). See also "Non-GAAP Financial Measures, Segment Measures and Other Calculations" in
the Appendix for a discussion of our definition of Adjusted EBITDA.
(g) Historical gross investment in property and equipment excludes the impact of construction in process.
19Crown Castle International Corp.
First Quarter 2021
ASSET PORTFOLIO CAPITALIZATION
COMPANY OVERVIEW FINANCIALS & METRICS APPENDIX
OVERVIEW OVERVIEW
SUMMARY OF TOWER PORTFOLIO BY VINTAGE(a)
(as of March 31, 2021; dollars in thousands)
CASH YIELD(b) NUMBER OF TENANTS PER TOWER
18%
2.6
2.0
8%
Acquired and built Acquired and built Acquired and built Acquired and built
2006 and prior 2007 to present 2006 and prior 2007 to present
LQA TOWERS SEGMENT SITE RENTAL GROSS CASH
LQA CASH SITE RENTAL REVENUE PER TOWER(c) MARGIN PER TOWER(d)
$115
$97
$67
$46
Acquired and built Acquired and built Acquired and built Acquired and built
2006 and prior 2007 to present 2006 and prior 2007 to present
NET INVESTED CAPITAL PER TOWER(e) NUMBER OF TOWERS
$543 $563
28,836
11,250
Acquired and built Acquired and built Acquired and built Acquired and built
2006 and prior 2007 to present 2006 and prior 2007 to present
(a) All tower portfolio figures are calculated exclusively for the Company’s towers and rooftops and do not give effect to other activities within the Company’s
Towers segment.
(b) Yield is calculated as LQA Towers segment site rental gross margin, exclusive of straight-lined revenues and amortization of prepaid rent, divided by invested
capital net of the amount of prepaid rent received from customers.
(c) Exclusive of straight-lined revenues and amortization of prepaid rent.
(d) Exclusive of straight-lined revenues, amortization of prepaid rent, and straight-lined expenses.
(e) Reflects gross total assets (including incremental capital invested by the Company since time of acquisition or construction completion), less any prepaid rent.
Inclusive of invested capital related to land at the tower site.
20Crown Castle International Corp.
First Quarter 2021
COMPANY FINANCIALS & METRICS ASSET PORTFOLIO OVERVIEW CAPITALIZATION OVERVIEW APPENDIX
OVERVIEW
TOWER PORTFOLIO OVERVIEW(a)
(as of March 31, 2021; dollars in thousands)
LQA CASH SITE RENTAL REVENUE PER
NUMBER OF TOWERS TENANTS PER TOWER TOWER(b)
$116
2.6
7,942
2.0
$67
2.6 $111
20,894 2.0
3,622
$67
7,628
Acquired and built Acquired and built Acquired and built Acquired and built Acquired and built Acquired and built
2006 and prior 2007 to present 2006 and prior 2007 to present 2006 and prior 2007 to present
Top 100 BTA Top 100 BTA Top 100 BTA
Outside Top 100 BTA Outside Top 100 BTA Outside Top 100 BTA
(a) All tower portfolio figures are calculated exclusively for the Company’s towers and rooftops and do not give effect to other activities within the Company’s Towers segment.
(b) Exclusive of straight-lined revenues and amortization of prepaid rent.
21Crown Castle International Corp.
First Quarter 2021
COMPANY FINANCIALS & METRICS ASSET PORTFOLIO OVERVIEW CAPITALIZATION OVERVIEW APPENDIX
OVERVIEW
DISTRIBUTION OF TOWER TENANCY (as of March 31, 2021)(a)
PERCENTAGE OF TOWERS BY TENANTS PER TOWER
SITES ACQUIRED AND BUILT 2006 AND PRIOR SITES ACQUIRED AND BUILT 2007 TO PRESENT
3 tenants: 21%
3 tenants: 15%
2 tenants: 27%
4 tenants: 15%
4 tenants: 7%
5 tenants: 3%
2 tenants: 25%
5 tenants: 7% Greater than 5 tenants: 2%
Greater than 5 tenants: 4%
Less than 2 tenants: 28% Less than 2 tenants: 46%
Average: 2.6 Average: 2.0
GEOGRAPHIC TOWER DISTRIBUTION (as of March 31, 2021)(a)
PERCENTAGE OF LQA CASH SITE RENTAL REVENUE BY GEOGRAPHIC
PERCENTAGE OF TOWERS BY GEOGRAPHIC LOCATION LOCATION(b)
NY: 3% Other US: 46% IN: 3% Other US: 47%
NC: 4% OH: 3%
NY: 4%
TN: 4%
PA: 5%
GA: 4%
TN: 5%
PA: 4%
GA: 5%
IL: 4%
CA: 11% TX: 9%
NC: 5%
OH: 4%
TX: 11% CA: 7%
FL: 7%
FL: 5%
(a) All tower portfolio figures are calculated exclusively for the Company’s towers and rooftops and do not give effect to other activities within the Company’s Towers segment.
(b) Exclusive of straight-lined revenues and amortization of prepaid rent.
22Crown Castle International Corp.
First Quarter 2021
COMPANY ASSET PORTFOLIO CAPITALIZATION
FINANCIALS & METRICS APPENDIX
OVERVIEW OVERVIEW OVERVIEW
GROUND INTEREST OVERVIEW
Percentage of
LQA Towers LQA Towers
Percentage of Segment Site Segment Site Weighted
LQA Cash LQA Cash Rental Gross Rental Gross Average Term
(as of March 31, 2021; Site Rental Site Rental Cash Cash Number of Percentage of Remaining (by
dollars in millions) Revenues(a) Revenues(a) Margin(b) Margin(b) Towers(c) Towers years)(d)
Less than 10 years $ 342 10 %$ 178 7 % 5,144 13 %
10 to 20 years 423 13 % 247 10 % 6,017 15 %
Greater than 20 years 1,412 44 % 1,009 42 % 17,857 44 %
Total leased $ 2,177 67 %$ 1,434 59 % 29,018 72 % 36
Owned $ 1,050 33 % $ 983 41 % 11,068 28 %
Total / Average $ 3,227 100 % $ 2,417 100 % 40,086 100 %
GROUND INTEREST ACTIVITY
Three Months Ended
(dollars in millions) March 31, 2021
Ground Extensions Under Crown Castle Towers:
Number of ground leases extended 162
Average number of years extended 27
Percentage increase in consolidated cash ground lease expense due to extension activities(e) 0.1 %
Ground Purchases Under Crown Castle Towers:
Number of ground leases purchased 41
Ground lease purchases (including capital expenditures, acquisitions and installment purchases) $ 15
Percentage of Towers segment site rental gross margin from towers on purchased landCrown Castle International Corp.
First Quarter 2021
COMPANY ASSET PORTFOLIO CAPITALIZATION
FINANCIALS & METRICS APPENDIX
OVERVIEW OVERVIEW OVERVIEW
CAPITALIZATION OVERVIEW
Net Debt to
LQA
Fixed vs. Interest Adjusted
(As of March 31, 2021; dollars in millions) Face Value Variable Rate(a) EBITDA(b) Maturity
Cash, cash equivalents and restricted cash $ 438
3.849% Secured Notes 1,000 Fixed 3.9% 2023
Senior Secured Notes, Series 2009-1, Class A-2 59 Fixed 9.0% 2029
Senior Secured Tower Revenue Notes, Series 2015-1(c) 300 Fixed 3.2% 2042(c)
Senior Secured Tower Revenue Notes, Series 2018-1(c) 250 Fixed 3.7% 2043(c)
Senior Secured Tower Revenue Notes, Series 2015-2(c) 700 Fixed 3.7% 2045(c)
Senior Secured Tower Revenue Notes, Series 2018-2(c) 750 Fixed 4.2% 2048(c)
Finance leases and other obligations 231 Various Various Various
Total secured debt $ 3,290 3.9% 0.9x
2016 Revolver(d) 580 Variable 1.2% 2024
2016 Term Loan A 1,238 Variable 1.2% 2024
Commercial Paper Notes(e) 40 Variable 0.4% 2021
3.150% Senior Notes 750 Fixed 3.2% 2023
3.200% Senior Notes 750 Fixed 3.2% 2024
1.350% Senior Notes 500 Fixed 1.4% 2025
4.450% Senior Notes 900 Fixed 4.5% 2026
3.700% Senior Notes 750 Fixed 3.7% 2026
1.050% Senior Notes 1,000 Fixed 1.1% 2026
4.000% Senior Notes 500 Fixed 4.0% 2027
3.650% Senior Notes 1,000 Fixed 3.7% 2027
3.800% Senior Notes 1,000 Fixed 3.8% 2028
4.300% Senior Notes 600 Fixed 4.3% 2029
3.100% Senior Notes 550 Fixed 3.1% 2029
3.300% Senior Notes 750 Fixed 3.3% 2030
2.250% Senior Notes 1,100 Fixed 2.3% 2031
2.100% Senior Notes 1,000 Fixed 2.1% 2031
4.750% Senior Notes 350 Fixed 4.8% 2047
2.900% Senior Notes 1,250 Fixed 2.9% 2041
5.200% Senior Notes 400 Fixed 5.2% 2049
4.000% Senior Notes 350 Fixed 4.0% 2049
4.150% Senior Notes 500 Fixed 4.2% 2050
3.250% Senior Notes 900 Fixed 3.3% 2051
Total unsecured debt $ 16,758 3.0% 4.7x
Total net debt $ 19,610 3.1% 5.5x
Market Capitalization(f) 74,392
Firm Value(g) $ 94,002
(a) Represents the weighted-average stated interest rate, as applicable.
(b) Represents the applicable amount of debt divided by LQA consolidated Adjusted EBITDA. See the "Net Debt to Last Quarter Annualized Adjusted EBITDA
Calculation" in the Appendix.
(c) If the respective series of such debt is not paid in full on or prior to an applicable date, then the Excess Cash Flow (as defined in the indenture) of the issuers of
such notes will be used to repay principal of the applicable series, and additional interest (of an additional approximately 5% per annum) will accrue on the
respective series. The Senior Secured Tower Revenue Notes, Series 2015-1 and 2015-2 have anticipated repayment dates in 2022 and 2025, respectively. The
Senior Secured Tower Revenue Notes, 2018-1 and 2018-2 have anticipated repayment dates in 2023 and 2028, respectively. Notes are prepayable at par if
voluntarily repaid six months or less prior to maturity; earlier prepayment may require additional consideration.
(d) As of March 31, 2021, the undrawn availability under the $5.0 billion 2016 Revolver was $4.4 billion.
(e) As of March 31, 2021, the Company had $960 million available for issuance under the $1.0 billion unsecured commercial paper program ("CP Program"). The
maturities of commercial paper notes under the CP Program, when outstanding, may vary but may not exceed 397 days from the date of issue.
(f) Market capitalization calculated based on $172.13 closing price and 432 million shares outstanding as of March 31, 2021.
(g) Represents the sum of net debt and market capitalization.
24Crown Castle International Corp.
First Quarter 2021
COMPANY OVERVIEW FINANCIALS & METRICS ASSET PORTFOLIO OVERVIEW CAPITALIZATION OVERVIEW APPENDIX
DEBT MATURITY OVERVIEW(a)(b)
% of Debt Outstanding
Fixed
Variable 9%
91%
(as of March 31, 2021; dollars in millions)
$5,850
$1,654
$1,412
$1,091 $1,120 $1,004 $1,004 $1,004
$754 $704 $753 $750
$504 $503 $603 $550
$362
$71 $62 $62 $0
1H 2H 1H 2H 1H 2H 1H 2H 1H 2H 1H 2H 1H 2H 1H 2H 1H 2H 1H 2H Thereafter
2021 2021 2022 2022 2023 2023 2024 2024 2025 2025 2026 2026 2027 2027 2028 2028 2029 2029 2030 2030
(a) Where applicable, maturities reflect the Anticipated Repayment Date, as defined in the respective debt agreement; excludes finance leases and other obligations; amounts presented at face value, net of repurchases held at CCIC.
(b) Debt maturities reflected in 1H 2021 are predominantly comprised of $40 million outstanding in commercial paper notes. Amounts available under the CP Program may be borrowed, repaid and re-borrowed from time to time.
25Crown Castle International Corp.
First Quarter 2021
COMPANY ASSET PORTFOLIO CAPITALIZATION
FINANCIALS & METRICS APPENDIX
OVERVIEW OVERVIEW OVERVIEW
LIQUIDITY OVERVIEW(a)
(dollars in millions) March 31, 2021
(b)
Cash, cash equivalents, and restricted cash $ 438
Undrawn 2016 Revolver availability(c) 4,387
Debt and other long-term obligations 19,872
Total equity 8,986
(a) In addition, we have the following sources of liquidity:
i. In March 2021, we established an at-the-market stock offering program ("ATM Program") through which we may, from time to time, issue and sell
shares of our common stock having an aggregate gross sales price of up to $750 million to or through sales agents. No shares of common stock have
been sold under the ATM Program.
ii. In April 2019, we established a CP Program through which we may issue short term, unsecured commercial paper notes ("CP Notes"). Amounts
available under the CP Program may be issued, repaid and re-issued from time to time, with the aggregate principal amount of CP Notes outstanding
under the CP Program at any time not to exceed $1.0 billion. As of March 31, 2021, there were $40 million of CP Notes outstanding under our CP
Program. We intend to maintain available commitments under our 2016 Revolver in an amount at least equal to the amount of CP Notes outstanding at
any point in time.
(b) Inclusive of $5 million included within "Other assets, net" on our condensed consolidated balance sheet.
(c) Availability at any point in time is subject to reaffirmation of the representations and warranties in, and there being no default under, the credit agreement
governing our 2016 Revolver.
26Crown Castle International Corp.
First Quarter 2021
COMPANY OVERVIEW FINANCIALS & METRICS ASSET PORTFOLIO OVERVIEW CAPITALIZATION OVERVIEW APPENDIX
SUMMARY OF MAINTENANCE AND FINANCIAL COVENANTS
Covenant Level
Debt Borrower / Issuer Covenant(a) Requirement As of March 31, 2021
Maintenance Financial Covenants(b)
2016 Credit Facility CCIC Total Net Leverage Ratio ≤ 6.50x 5.2x
2016 Credit Facility CCIC Total Senior Secured Leverage Ratio ≤ 3.50x 0.8x
2016 Credit Facility CCIC Consolidated Interest Coverage Ratio(c) N/A N/A
Restrictive Negative Financial Covenants
Financial covenants restricting ability to incur additional debt
2012 Secured Notes CC Holdings GS V LLC and Crown Castle GS III Corp. Debt to Adjusted Consolidated Cash Flow Ratio ≤ 3.50x 2.1x
Financial covenants requiring excess cash flows to be deposited in a cash trap reserve account and not released
(d)
2015 Tower Revenue Notes Crown Castle Towers LLC and its Subsidiaries Debt Service Coverage Ratio > 1.75x 11.6x
(d)
2018 Tower Revenue Notes Crown Castle Towers LLC and its Subsidiaries Debt Service Coverage Ratio > 1.75x 11.6x
(d)
2009 Securitized Notes Pinnacle Towers Acquisition Holdings LLC and its Subsidiaries Debt Service Coverage Ratio > 1.30x 14.3x
Financial covenants restricting ability of relevant issuer to issue additional notes under the applicable indenture
(e)
2015 Tower Revenue Notes Crown Castle Towers LLC and its Subsidiaries Debt Service Coverage Ratio ≥ 2.00x 11.6x
(e)
2018 Tower Revenue Notes Crown Castle Towers LLC and its Subsidiaries Debt Service Coverage Ratio ≥ 2.00x 11.6x
2009 Securitized Notes Pinnacle Towers Acquisition Holdings LLC and its Subsidiaries Debt Service Coverage Ratio ≥ 2.34x (e)
14.3x
(a) As defined in the respective debt agreement. In the indentures for the 2015 Tower Revenue Notes, 2018 Tower Revenue Notes and the 2009 Securitized Notes, the defined term for Debt Service Coverage Ratio is
"DSCR."
(b) Failure to comply with the financial maintenance covenants would, absent a waiver, result in an event of default under the credit agreement governing our 2016 Credit Facility.
(c) Applicable solely to the extent that the senior unsecured debt rating by any two of S&P, Moody's and Fitch is lower than BBB-, Baa3 or BBB-, respectively. If applicable, the consolidated interest coverage ratio must be
greater than or equal to 2.50.
(d) The 2015 Tower Revenue Notes, 2018 Tower Revenue Notes and 2009 Securitized Notes also include the potential for amortization events, which could result in applying current and future cash flow to the prepayment
of debt with applicable prepayment consideration. An amortization event occurs when the Debt Service Coverage Ratio falls below 1.45x, 1.45x or 1.15x, in each case as described under the indentures for the 2015
Tower Revenue Notes, 2018 Tower Revenue Notes or 2009 Securitized Notes, respectively.
(e) Rating Agency Confirmation (as defined in the respective debt agreement) is also required.
27You can also read